 RSS Feed
 by Calculated Risk on 5/15/2025 09:15:00 AM
Thursday, May 15, 2025
Industrial Production Unchanged in April
From the Fed: Industrial Production and Capacity Utilization
Industrial production (IP) was little changed in April as declines in manufacturing and mining output were offset by growth in utilities output. The index for manufacturing decreased 0.4 percent after increasing 0.4 percent in March. In April, manufacturing output excluding motor vehicles and parts decreased 0.3 percent. The index for mining fell 0.3 percent, and the index for utilities rose 3.3 percent. At 103.9 percent of its 2017 average, total IP in April was 1.5 percent above its year-earlier level. Capacity utilization edged down to 77.7 percent, a rate that is 1.9 percentage points below its long-run (1972–2024) average.
emphasis added
 Click on graph for larger image.
This graph shows Capacity Utilization. This series is up from the record low set in April 2020, and close to the level in February 2020 (pre-pandemic).
Capacity utilization at 77.7% is 1.9% below the average from 1972 to 2023. This was below consensus expectations.
Note: y-axis doesn't start at zero to better show the change.
 The second graph shows industrial production since 1967.
Industrial production was unchanged at 103.9. This is above the pre-pandemic level.
Industrial production was slightly below consensus expectations.
Fed Chair Powell: "Longer-run level of the policy rate have risen"
by Calculated Risk on 5/15/2025 08:58:00 AM
From Fed Chair Powell: Opening Remarks. Excerpts:
The economic environment has changed significantly since 2020, and our review will reflect our assessment of those changes. Longer-term interest rates are a good deal higher now, driven largely by real rates given the stability of longer-term inflation expectations. Many estimates of the longer-run level of the policy rate have risen, including those in the Summary of Economic Projections.All rates will likely be higher this decade (barring an economic downturn) than in the 2010s.
Higher real rates may also reflect the possibility that inflation could be more volatile going forward than in the inter-crisis period of the 2010s. We may be entering a period of more frequent, and potentially more persistent, supply shocks—a difficult challenge for the economy and for central banks.
Retail Sales Increased 0.1% in April
by Calculated Risk on 5/15/2025 08:45:00 AM
On a monthly basis, retail sales increased 0.1% from March to April (seasonally adjusted), and sales were up 5.2 percent from April 2024.
From the Census Bureau report:
Advance estimates of U.S. retail and food services sales for April 2025, adjusted for seasonal variation and holiday and trading-day differences, but not for price changes, were $724.1 billion, up 0.1 percent from the previous month, and up 5.2 percent from April 2024. ... The February 2025 to March 2025 percent change was revised from up 1.5 percent to up 1.7 percent.
emphasis added
 Click on graph for larger image.
This graph shows retail sales since 1992. This is monthly retail sales and food service, seasonally adjusted (total and ex-gasoline).
Retail sales ex-gasoline was up 0.1% in April.
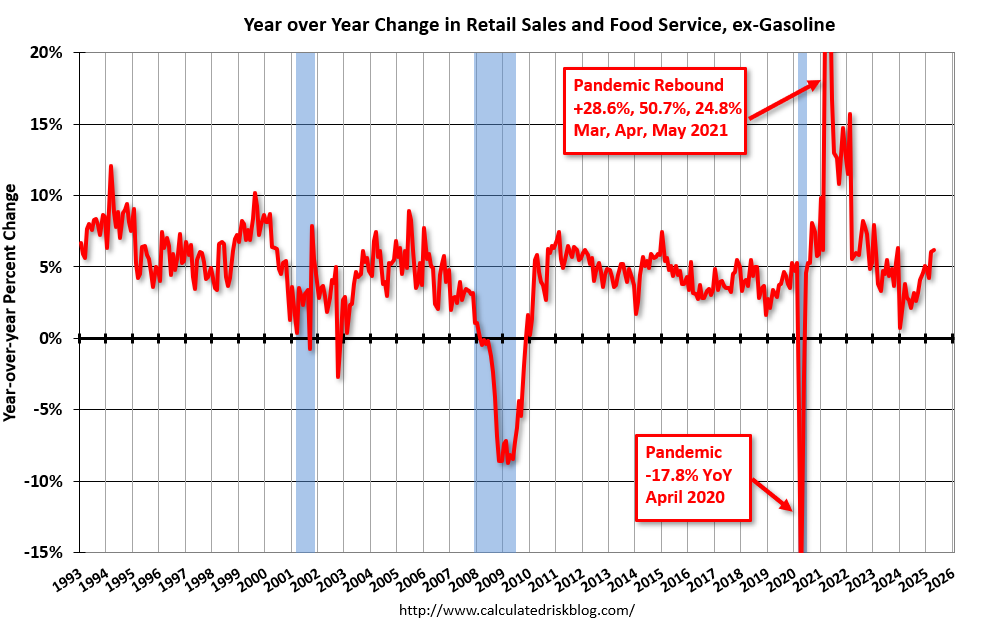
The second graph shows the year-over-year change in retail sales and food service (ex-gasoline) since 1993.
Retail and Food service sales, ex-gasoline, increased by 6.2% on a YoY basis.
 The change in sales in April were at expectations.
Weekly Initial Unemployment Claims at 229,000
by Calculated Risk on 5/15/2025 08:30:00 AM
The DOL reported:
In the week ending May 10, the advance figure for seasonally adjusted initial claims was 229,000, unchanged from the previous week's revised level. The previous week's level was revised up by 1,000 from 228,000 to 229,000. The 4-week moving average was 230,500, an increase of 3,250 from the previous week's revised average. The previous week's average was revised up by 250 from 227,000 to 227,250.The following graph shows the 4-week moving average of weekly claims since 1971.
emphasis added
 Click on graph for larger image.
The dashed line on the graph is the current 4-week average. The four-week average of weekly unemployment claims increased to 230,500.
The previous week was revised up.
Weekly claims were at the consensus forecast.
Wednesday, May 14, 2025
Thursday: Unemployment Claims, Retail Sales, PPI, NY & Philly Fed Mfg, Fed Chair Powell Speaks, Industrial Production, Homebuilder Survey
by Calculated Risk on 5/14/2025 07:15:00 PM
 Note: Mortgage rates are from MortgageNewsDaily.com and are for top tier scenarios.
Thursday:
• At 8:30 AM ET, The initial weekly unemployment claims report will be released. The consensus is for initial claims of 230 thousand, up from 228 thousand last week.
• Also at 8:30 AM, Retail sales for April are scheduled to be released. The consensus is for 0.1% increase in retail sales.
• Also at 8:30 AM, The Producer Price Index for April from the BLS. The consensus is for a 0.3% increase in PPI, and a 0.3% increase in core PPI.
• Also at 8:30 AM, The New York Fed Empire State manufacturing survey for May. The consensus is for a reading of -7.1, up from -8.1.
• Also at 8:30 AM, the Philly Fed manufacturing survey for May. The consensus is for a reading of -8.5, up from -26.4.
• At 8:40 AM, Speech, Fed Chair Jerome Powell, Framework Review, At the Thomas Laubach Research Conference, Washington, D.C.
• At 9:15 AM, The Fed will release Industrial Production and Capacity Utilization for April. The consensus is for a 0.1% increase in Industrial Production, and for Capacity Utilization to be unchanged at 77.8%.
• At 10:00 AM, The May NAHB homebuilder survey. The consensus is for a reading of 40 up from 39 last month. Any number below 50 indicates that more builders view sales conditions as poor than good.
Part 2: Current State of the Housing Market; Overview for mid-May 2025
by Calculated Risk on 5/14/2025 01:26:00 PM
Today, in the Calculated Risk Real Estate Newsletter: Part 2: Current State of the Housing Market; Overview for mid-May 2025
A brief excerpt:
Last Friday, in Part 1: Current State of the Housing Market; Overview for mid-May 2025 I reviewed home inventory, housing starts and sales. I noted that the key story right now for existing homes is that inventory is increasing sharply, and sales are essentially flat compared to last year. That means prices will be under pressure (although there will not be a huge wave of distressed sales). And there are significant regional differences too.There is much more in the article.
In Part 2, I will look at house prices, mortgage rates, rents and more.
...
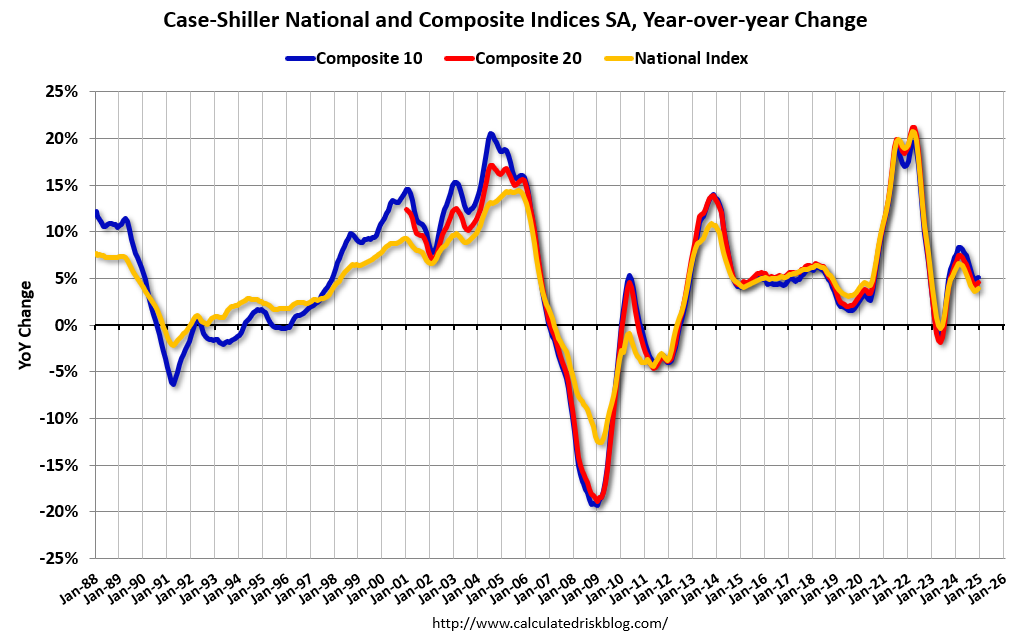
The Case-Shiller National Index increased 3.9% year-over-year (YoY) in February and will likely be lower year-over-year in the March report compared to February (based on other data).
The MoM increase in the seasonally adjusted (SA) Case-Shiller National Index was at 0.26% (a 3.1% annual rate), This was the 25th consecutive MoM increase in the seasonally adjusted index.
Q1 NY Fed Report: Mortgage Originations by Credit Score, Delinquencies Increase, Foreclosures Increase
by Calculated Risk on 5/14/2025 10:36:00 AM
Today, in the Calculated Risk Real Estate Newsletter: Q1 NY Fed Report: Mortgage Originations by Credit Score, Delinquencies Increase, Foreclosures Increase
A brief excerpt:
The transition rate to serious delinquent is generally increasing and foreclosures are close to pre-pandemic levels. The Q1 increase is likely due to the end of the VA foreclosure moratorium.There is much more in the article.
...
There is much more in the report.

MBA: Mortgage Applications Increase in Latest MBA Weekly Survey
by Calculated Risk on 5/14/2025 07:00:00 AM
From the MBA: Mortgage Applications Increase in Latest MBA Weekly Survey
Mortgage applications increased 1.1 percent from one week earlier, according to data from the Mortgage Bankers Association’s (MBA) Weekly Mortgage Applications Survey for the week ending May 9, 2025.
The Market Composite Index, a measure of mortgage loan application volume, increased 1.1 percent on a seasonally adjusted basis from one week earlier. On an unadjusted basis, the Index increased 1 percent compared with the previous week. The Refinance Index decreased 0.4 percent from the previous week and was 44 percent higher than the same week one year ago. The seasonally adjusted Purchase Index increased 2 percent from one week earlier. The unadjusted Purchase Index increased 2 percent compared with the previous week and was 18 percent higher than the same week one year ago.
“Last week saw steadier mortgage rates, as the FOMC meeting played as predicted, and market movements led to a small two-basis point increase in the 30-year conforming rate to 6.86 percent,” said Mike Fratantoni, MBA’s SVP and Chief Economist. “Refinance volume was little changed for the week, with a small increase in government refinances, and a decrease in conventional refinances. The news for the week was the growth in purchase applications, up 2.3 percent and almost 18 percent higher than last year’s pace. Despite the economic uncertainty, the increase in home inventory means there are additional properties to buy, unlike the last two years, and this supply is supporting more transactions.”
Added Fratantoni, “There was a notable gain in government purchase applications, up almost 5 percent for the week and 40 percent on an annual basis.”
...
The average contract interest rate for 30-year fixed-rate mortgages with conforming loan balances ($806,500 or less) increased to 6.86 percent from 6.84 percent, with points remaining unchanged at 0.68 (including the origination fee) for 80 percent loan-to-value ratio (LTV) loans.
emphasis added
 Click on graph for larger image.
The first graph shows the MBA mortgage purchase index.
According to the MBA, purchase activity is up 18% year-over-year unadjusted.
Red is a four-week average (blue is weekly).
Purchase application activity is up from the lows in late October 2023 and is 10% above the lowest levels during the housing bust.

The second graph shows the refinance index since 1990.
The refinance index decreased and remained very low.
Tuesday, May 13, 2025
Wednesday: Mortgage Applications
by Calculated Risk on 5/13/2025 07:56:00 PM
 Note: Mortgage rates are from MortgageNewsDaily.com and are for top tier scenarios.
Wednesday:
• At 7:00 AM ET, The Mortgage Bankers Association (MBA) will release the results for the mortgage purchase applications index.
Cleveland Fed: Median CPI increased 0.3% and Trimmed-mean CPI increased 0.2% in April
by Calculated Risk on 5/13/2025 12:39:00 PM
The Cleveland Fed released the median CPI and the trimmed-mean CPI.
According to the Federal Reserve Bank of Cleveland, the median Consumer Price Index rose 0.3% in April. The 16% trimmed-mean Consumer Price Index increased 0.2%. "The median CPI and 16% trimmed-mean CPI are measures of core inflation calculated by the Federal Reserve Bank of Cleveland based on data released in the Bureau of Labor Statistics’ (BLS) monthly CPI report".
 Click on graph for larger image.
This graph shows the year-over-year change for these four key measures of inflation.
On a year-over-year basis, the median CPI rose 3.5% (unchanged from 3.5% YoY in March), the trimmed-mean CPI rose 3.0% (unchanged from 3.0%), and the CPI less food and energy rose 2.8% (unchanged from 2.8%).
Core PCE is for March was up 2.7% YoY, down from 2.8% in February.
Based on the CPI report this morning, Core PCE is expected to decline to 2.6% YoY in April.


