 RSS Feed
 by Calculated Risk on 5/12/2025 10:31:00 AM
Monday, May 12, 2025
2nd Look at Local Housing Markets in April
Today, in the Calculated Risk Real Estate Newsletter: 2nd Look at Local Housing Markets in April
A brief excerpt:
It appears sales will be down year-over-year for the 3rd consecutive month, and sales-to-date in 2025 are trailing sales in 2024 - and 2024 was the lowest sales year since 1995! And sales in April might have a 3 handle (be under 4 million).There is much more in the article.
...
Here is a look at months-of-supply using NSA sales. Since this is NSA data, it is likely months-of-supply will increase into the Summer.
Months in red are areas that are seeing 5 months of supply now and might see price pressures later this summer.
...
Many more local markets to come!

Housing May 12th Weekly Update: Inventory up 1.6% Week-over-week, Up 32.9% Year-over-year
by Calculated Risk on 5/12/2025 08:11:00 AM
Altos reports that active single-family inventory was up 1.6% week-over-week.
Inventory is now up 21.1% from the seasonal bottom in January and is increasing.
Usually, inventory is up about 11.5% from the seasonal low by this week in the year. So, 2025 is seeing a larger than normal pickup in inventory.
The first graph shows the seasonal pattern for active single-family inventory since 2015.
 Click on graph for larger image.
The red line is for 2025. The black line is for 2019.
Inventory was up 32.9% compared to the same week in 2024 (last week it was up 32.9%), and down 15.7% compared to the same week in 2019 (last week it was down 16.0%).
This is the highest level since prior to the pandemic.
It now appears inventory will be close to 2019 levels towards the end of 2025.
 This second inventory graph is courtesy of Altos Research.
As of May 9th, inventory was at 756 thousand (7-day average), compared to 744 thousand the prior week.
Mike Simonsen discusses this data regularly on Youtube
Sunday, May 11, 2025
Sunday Night Futures
by Calculated Risk on 5/11/2025 06:21:00 PM
Weekend:
• Schedule for Week of May 11, 2025
Monday:
• At 2:00 PM ET, Senior Loan Officer Opinion Survey on Bank Lending Practices for April.
From CNBC: Pre-Market Data and Bloomberg futures S&P 500 are up 73 and DOW futures are up 449 (fair value).
Oil prices were up over the last week with WTI futures at $61.39 per barrel and Brent at $64.21 per barrel. A year ago, WTI was at $80, and Brent was at $83 - so WTI oil prices are down about 23% year-over-year.
Here is a graph from Gasbuddy.com for nationwide gasoline prices. Nationally prices are at $3.08 per gallon. A year ago, prices were at $3.59 per gallon, so gasoline prices are down $0.51 year-over-year.
Trends in Educational Attainment in the U.S. Labor Force
by Calculated Risk on 5/11/2025 08:16:00 AM
The first graph shows the unemployment rate by four levels of education (all groups are 25 years and older) through April 2025. Note: This is an update to a post from several years ago.
Unfortunately, this data only goes back to 1992 and includes only three recessions (the stock / tech bust in 2001, and the housing bust/financial crisis, and the 2020 pandemic). Clearly education matters with regards to the unemployment rate, with the lowest rate for college graduates at 2.5% in April, and highest for those without a high school degree at 6.2% in April.
All four groups were generally trending down prior to the pandemic, and all are close to pre-pandemic levels now.
 Click on graph for larger image.
Note: This says nothing about the quality of jobs - as an example, a college graduate working at minimum wage would be considered "employed".
This brings up an interesting question: What is the composition of the labor force by educational attainment, and how has that been changing over time?
Here is some data on the U.S. labor force by educational attainment since 1992.
 Currently, almost 67 million people (25 and over) in the U.S. labor force have a bachelor's degree or higher. This is almost 45% of the labor force, up from 26.2% in 1992.
This is the only category trending up. "Some college", "high school" and "less than high school" have been trending down.
Based on recent trends, probably half the labor force will have at least a bachelor's degree sometime next decade (2030s).
Some thoughts: Since workers with bachelor's degrees typically have a lower unemployment rate, rising educational attainment is probably a factor in pushing down the overall unemployment rate over time.
Also, I'd guess more education would mean less labor turnover, and that education is a factor in lower weekly claims.
A more educated labor force is a positive for the future.
Saturday, May 10, 2025
Real Estate Newsletter Articles this Week: Current State of the Housing Market
by Calculated Risk on 5/10/2025 02:11:00 PM
At the Calculated Risk Real Estate Newsletter this week:
 Click on graph for larger image.
• Part 1: Current State of the Housing Market; Overview for mid-May 2025
• ICE Mortgage Monitor: Home Prices Continue to Cool
• 1st Look at Local Housing Markets in April
• Asking Rents Mostly Unchanged Year-over-year
This is usually published 4 to 6 times a week and provides more in-depth analysis of the housing market.
Schedule for Week of May 11, 2025
by Calculated Risk on 5/10/2025 08:11:00 AM
The key reports this week are April CPI, Retail Sales and Housing Starts.
For manufacturing, April Industrial Production, and the May NY and Philly Fed manufacturing surveys will be released.
2:00 PM: Senior Loan Officer Opinion Survey on Bank Lending Practices for April.
6:00 AM ET: NFIB Small Business Optimism Index for April.
8:30 AM: The Consumer Price Index for April from the BLS. The consensus is for 0.3% increase in CPI (up 2.4% YoY), and a 0.3% increase in core CPI (up 2.8% YoY).
11:00 AM: NY Fed: Q1 Quarterly Report on Household Debt and Credit
7:00 AM ET: The Mortgage Bankers Association (MBA) will release the results for the mortgage purchase applications index.
8:30 AM: The initial weekly unemployment claims report will be released. The consensus is for initial claims of 230 thousand, up from 228 thousand last week.
 8:30 AM ET: Retail sales for April are scheduled to be released. The consensus is for 0.1% increase in retail sales.
This graph shows retail sales since 1992. This is monthly retail sales and food service, seasonally adjusted (total and ex-gasoline).
8:30 AM: The Producer Price Index for April from the BLS. The consensus is for a 0.3% increase in PPI, and a 0.3% increase in core PPI.
8:30 AM: The New York Fed Empire State manufacturing survey for May. The consensus is for a reading of -7.1, up from -8.1.
8:30 AM: the Philly Fed manufacturing survey for May. The consensus is for a reading of -8.5, up from -26.4.
8:40 AM: Speech, Fed Chair Jerome Powell, Framework Review, At the Thomas Laubach Research Conference, Washington, D.C.
 9:15 AM: The Fed will release Industrial Production and Capacity Utilization for April.
This graph shows industrial production since 1967.
The consensus is for a 0.1% increase in Industrial Production, and for Capacity Utilization to be unchanged at 77.8%.
10:00 AM: The May NAHB homebuilder survey. The consensus is for a reading of 40 up from 39 last month. Any number below 50 indicates that more builders view sales conditions as poor than good.
 8:30 AM ET: Housing Starts for April.
 This graph shows single and total housing starts since 2000.
The consensus is for 1.360 million SAAR, up from 1.324 million SAAR in March.
10:00 AM: University of Michigan's Consumer sentiment index (Preliminary for May).
Friday, May 09, 2025
May 9th COVID Update: COVID Deaths Continue to Decline
by Calculated Risk on 5/09/2025 07:10:00 PM
 Note: Mortgage rates are from MortgageNewsDaily.com and are for top tier scenarios.
For deaths, I'm currently using 4 weeks ago for "now", since the most recent three weeks will be revised significantly.
Note: "Effective May 1, 2024, hospitals are no longer required to report COVID-19 hospital admissions, hospital capacity, or hospital occupancy data." So, I'm no longer tracking hospitalizations.
| COVID Metrics | ||||
|---|---|---|---|---|
| Now | Week Ago | Goal | ||
| Deaths per Week | 337✅ | 393 | ≤3501 | |
| 1my goals to stop weekly posts. 🚩 Increasing number weekly for Deaths. ✅ Goal met. | ||||
 Click on graph for larger image.
This graph shows the weekly (columns) number of deaths reported since Jan 2023.
Although weekly deaths met the original goal to stop posting in June 2023 (low of 314 deaths), I've continued to post since deaths were above the goal again - and I'll continue to post until weekly deaths are once again below the goal for several weeks.
Weekly deaths are steadily decreasing following the winter pickup and are nearing the lows of last June.
 This appears to be a leading indicator for COVID hospitalizations and deaths. This is moving towards the lows last May.
Nationally COVID in wastewater is "Low".
Q2 GDP Tracking: Around 2%
by Calculated Risk on 5/09/2025 02:27:00 PM
Plenty of data next week! Note that the Blue Chip consensus is wide - and currently around 1%.
From the Atlanta Fed: 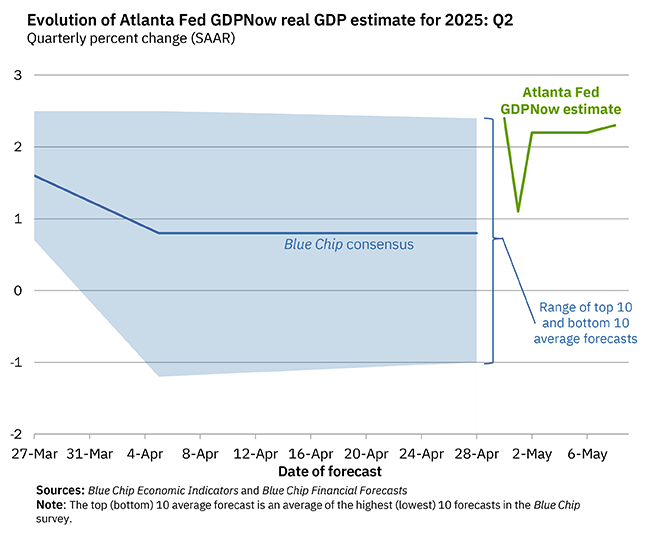
The GDPNow model estimate for real GDP growth (seasonally adjusted annual rate) in the second quarter of 2025 is 2.3 percent on May 8, up from 2.2 percent on May 6. After this morning’s wholesale trade report from the US Census Bureau, the nowcast of the contribution of inventory investment to annualized second-quarter real GDP growth increased from -0.46 percentage points to -0.43 percentage points. [May 8th estimate]
Part 1: Current State of the Housing Market; Overview for mid-May 2025
by Calculated Risk on 5/09/2025 11:00:00 AM
Today, in the Calculated Risk Real Estate Newsletter: Part 1: Current State of the Housing Market; Overview for mid-May 2025
A brief excerpt:
This 2-part overview for mid-May provides a snapshot of the current housing market.There is much more in the article.
Right now, the key story for existing homes is that inventory is increasing sharply, and sales are essentially flat compared to last year. That means prices will be under pressure (although there will not be a huge wave of distressed sales).
Yesterday, Realtor.com reported that there were “more than 1 million homes for sale last week, crossing this threshold for the first time since December 2019”.
...
Since inventory has increased sharply and sales are flat, a key for house prices is to watch months-of-supply. The following graph shows months-of-supply since 2017 using data from the NAR. Note that months-of-supply is higher than the previous 8 years!
Months-of-supply was at 4.0 months in March compared to 3.8 months in March 2019.
Inventory would probably have to increase to 5 1/2 to 6 months of supply to see national price declines.
AAR: Rail Carloads and Intermodal Up in April
by Calculated Risk on 5/09/2025 08:12:00 AM
From the Association of American Railroads (AAR) AAR Data Center. Graph and excerpts reprinted with permission.
Recent shifts in U.S. policies on trade and immigration have introduced volatility in financial markets and heightened uncertainty for firms. The ultimate outcomes and impacts of these policy changes remain unclear. Nevertheless, U.S. rail volumes have thus far remained stable, and many core economic indicators continue to signal underlying resilience. Railroads have long adapted to changing conditions, a legacy of resilience that continues today.
emphasis added
 Click on graph for larger image.
This table from the AAR shows the year-over-year change in carloads by category.
U.S. railroads originated 1.13 million total carloads in April 2025, up 6.2% (65,524 carloads) over April 2024. That’s the largest year-over-year percentage gain in 16 months and the third largest in nearly four years. Carloads averaged 225,569 per week in April—slightly below March, but otherwise the highest since October 2024, with gains in 13 of 20 categories tracked by AAR. Through the first four months of 2025, total carloads were up 1.8% (67,282 carloads) over the same period last year, with 11 of 20 carload categories seeing gains.
emphasis added
 And on intermodal:
 U.S. rail intermodal traffic, which is not included in carload counts, totaled 1.36 million containers and trailers in April 2025, up 7.4% (93,244 units) over April 2024. Weekly intermodal volume averaged 272,300 units in April 2025. The only April with higher intermodal volume was April 2021. In fact, April 2021 holds the all-time intermodal record for any month, averaging 290,955 units per week. Year-to-date intermodal volume in 2025 through April was 4.90 million units, up 8.1% (365,456 units) over 2024 and the second highest ever for the first four months of a year (again behind 2021). Intermodal volume closely tracks port activity, making it a bellwether for international trade trends.As yet, there is no apparent impact on carloads and intermodal from policy changes.


