 RSS Feed
 by Calculated Risk on 4/28/2025 07:15:00 PM
Monday, April 28, 2025
Tuesday: Case-Shiller House Prices, Job Openings
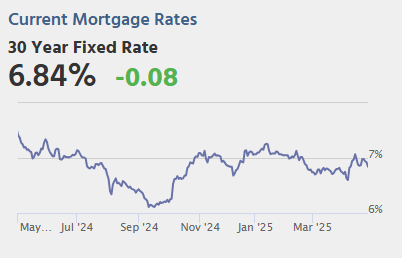
 From Matthew Graham at Mortgage News Daily: Mortgage Rates Start New Week Slightly Lower
Mortgage rates ended last week at the lowest levels since April 7th. The average lender remained at those same levels at the start of business today, but many lenders offered modest improvements as the day progressed.Tuesday:
...
As the week continues, there will be more and more scheduled events with the power to cause intraday volatility and even to impact the longer-term trend. As for that trend, it is arguably flat at the moment after experiencing significant volatility for most of the month of April. [30 year fixed 6.82%]
emphasis added
• At 9:00 AM ET, S&P/Case-Shiller House Price Index for February. The consensus is for a 4.8% year-over-year increase in the Comp 20 index for February, up from 4.7% YoY.
• Also at 9:00 AM, FHFA House Price Index for February. This was originally a GSE only repeat sales, however there is also an expanded index.
• At 10:00 AM, Job Openings and Labor Turnover Survey for March from the BLS.
Final Look at Local Housing Markets in March and a Look Ahead to April Sales
by Calculated Risk on 4/28/2025 11:26:00 AM
Today, in the Calculated Risk Real Estate Newsletter: Final Look at Local Housing Markets in March and a Look Ahead to April Sales
A brief excerpt:
After the National Association of Realtors® (NAR) releases the monthly existing home sales report, I pick up additional local market data that is reported after the NAR. This is the final look at local markets in March.There is much more in the article.
The big story for March was that existing home sales decreased year-over-year (YoY) for the 2nd consecutive month following four consecutive months with a year-over-year increase. Sales at 4.02 million on a Seasonally Adjusted Annual Rate (SAAR) basis were below the consensus estimate; however, housing economist Tom Lawler’s estimate was very close (as usual).
Sales averaged close to 5.5 million SAAR for the month of March in the 2017-2019 period. So, sales are still about 27% below pre-pandemic levels.
Also, months-of-supply for March was above pre-pandemic levels for the period 2017-2019.
...
Here is a look at months-of-supply using NSA sales. Since this is NSA data, it is likely months-of-supply will increase into the Summer.
Months in red will likely see 6+ months of supply this summer and might see price pressures. There is nothing magical about 6 months; some areas see price declines with less inventory, some more.
Note: This month, for months-of-supply, I broke out Miami (Miami-Dade) from the “Miami Area” this also includes Broward County and Palm Beach.
...
More local data coming in May for activity in April!

HVS: Q1 2025 Homeownership and Vacancy Rates
by Calculated Risk on 4/28/2025 10:00:00 AM
The Census Bureau released the Residential Vacancies and Homeownership report for Q1 2025 today.
The results of this survey were significantly distorted by the pandemic in 2020.
This report is frequently mentioned by analysts and the media to track household formation, the homeownership rate, and the homeowner and rental vacancy rates. However, there are serious questions about the accuracy of this survey.
This survey might show the trend, but I wouldn't rely on the absolute numbers. Analysts probably shouldn't use the HVS to estimate the excess vacant supply or household formation, or rely on the homeownership rate, except as a guide to the trend.
National vacancy rates in the first quarter 2025 were 7.1 percent for rental housing and 1.1 percent for homeowner housing. The rental vacancy rate was higher than the rate in the first quarter 2024 (6.6 percent) and not statistically different from the rate in the fourth quarter 2024 (6.9 percent).
The homeowner vacancy rate of 1.1 percent was higher than the rate in the first quarter 2024 (0.8 percent) and virtually the same as the rate in the fourth quarter 2024 (1.1 percent).
The homeownership rate of 65.1 percent was not statistically different from the rate in the first quarter 2024 (65.6 percent) and lower than the rate in the fourth quarter 2024 (65.7 percent).
emphasis added
 Click on graph for larger image.
The Red dots are the decennial Census homeownership rates for April 1st, 1990, 2000, 2010, and 2020.
The HVS homeownership rate was decreased to 65.1% in Q1, from 65.7% in Q4.
The HVS homeownership rate was decreased to 65.1% in Q1, from 65.7% in Q4.
The results in Q2 and Q3 2020 were distorted by the pandemic and should be ignored.
 The HVS homeowner vacancy was unchanged at 1.1% in Q1 from 1.1% in Q4.
 The homeowner vacancy rate declined sharply during the pandemic and includes homes that are vacant and for sale (so this mirrors the low but increasing levels of existing home inventory).
Once again - this probably shows the general trend, but I wouldn't rely on the absolute numbers.
 The rental vacancy rate increased to 7.1% in Q1 from 6.9% in Q4. This is up from the low of 5.6% in 2021 and 2022 and at the highest level since 2018.
The quarterly HVS is the timeliest survey on households, but there are many questions about the accuracy of this survey.
Housing April 28th Weekly Update: Inventory up 1.3% Week-over-week, Up 31.0% Year-over-year
by Calculated Risk on 4/28/2025 08:14:00 AM
Altos reports that active single-family inventory was up 1.3% week-over-week.
Inventory is now up 16.7% from the seasonal bottom in January and is increasing.
Usually, inventory is up about 9% from the seasonal low by this week in the year. So, 2025 is seeing a larger than normal pickup in inventory.
The first graph shows the seasonal pattern for active single-family inventory since 2015.
 Click on graph for larger image.
The red line is for 2025. The black line is for 2019.
Inventory was up 31.0% compared to the same week in 2024 (last week it was up 32.6%), and down 16.1% compared to the same week in 2019 (last week it was down 16.7%).
Inventory will likely pass 2020 same week levels next week and also be close to the peak for 2024.
It now appears inventory will be close to 2019 levels towards the end of 2025.
 This second inventory graph is courtesy of Altos Research.
As of April 25th, inventory was at 729 thousand (7-day average), compared to 719 thousand the prior week.
Mike Simonsen discusses this data regularly on Youtube
Sunday, April 27, 2025
Monday: Housing Vacancies and Homeownership, Dallas Fed Mfg
by Calculated Risk on 4/27/2025 06:17:00 PM
Weekend:
• Schedule for Week of April 27, 2025
Monday:
• At 10:00 AM ET, the Q1 2025 Housing Vacancies and Homeownership from the Census Bureau.
• At 10:30 AM, Dallas Fed Survey of Manufacturing Activity for April.
From CNBC: Pre-Market Data and Bloomberg futures S&P 500 are down 12 and DOW futures are down 75 (fair value).
Oil prices were up over the last week with WTI futures at $63.02 per barrel and Brent at $66.87 per barrel. A year ago, WTI was at $85, and Brent was at $90 - so WTI oil prices are down about 26% year-over-year.
Here is a graph from Gasbuddy.com for nationwide gasoline prices. Nationally prices are at $3.12 per gallon. A year ago, prices were at $3.66 per gallon, so gasoline prices are down $0.54 year-over-year.
Update: Lumber Prices Up 11% YoY
by Calculated Risk on 4/27/2025 08:47:00 AM
This is something to watch again. Here is another monthly update on lumber prices.
SPECIAL NOTE: The CME group discontinued the Random Length Lumber Futures contract on May 16, 2023. I switched to a physically-delivered Lumber Futures contract that was started in August 2022. Unfortunately, this impacts long term price comparisons since the new contract was priced about 24% higher than the old random length contract for the period when both contracts were available.
This graph shows CME random length framing futures through August 2022 (blue), and the new physically-delivered Lumber Futures (LBR) contract starting in August 2022 (Red).
On April 25, 2025, LBR was at $573.00 per 1,000 board feet, up 11% from a year ago.
 Click on graph for larger image.
There is somewhat of a seasonal demand for lumber, and lumber prices frequently peak in the first half of the year.
Last year, prices bottomed in July at $449.00 per 1,000 board feet.
The recent year-over-year increase might be due to the tariffs.
Saturday, April 26, 2025
Real Estate Newsletter Articles this Week: Existing-Home Sales Decreased to 4.02 million SAAR in March; Down 2.4% YoY
by Calculated Risk on 4/26/2025 02:11:00 PM
At the Calculated Risk Real Estate Newsletter this week:
 Click on graph for larger image.
• NAR: Existing-Home Sales Decreased to 4.02 million SAAR in March; Down 2.4% YoY
• New Home Sales Increase to 724,000 Annual Rate in March
• NMHC on Apartments: Market conditions Tightened in Q1 pre-Tariffs
• Lawler: Early Read on Existing Home Sales in March
• California Home Sales Up 4.9% YoY in March; 4th Look at Local Housing Markets
This is usually published 4 to 6 times a week and provides more in-depth analysis of the housing market.
Schedule for Week of April 27, 2025
by Calculated Risk on 4/26/2025 08:11:00 AM
The key report scheduled for this week is the April employment report.
Other key reports include the advance estimate of Q1 GDP, March Personal Income and Outlays, February Case-Shiller house prices, and April vehicle sales.
For manufacturing, the April Dallas Fed manufacturing survey, and the ISM index will be released.
10:00 AM: the Q1 2025 Housing Vacancies and Homeownership from the Census Bureau.
10:30 AM: Dallas Fed Survey of Manufacturing Activity for April.
 9:00 AM: S&P/Case-Shiller House Price Index for February.
This graph shows the nominal seasonally adjusted National Index, Composite 10 and Composite 20 indexes through the most recent report (the Composite 20 was started in January 2000).
The consensus is for a 4.8% year-over-year increase in the Comp 20 index for February, up from 4.7% YoY.
9:00 AM: FHFA House Price Index for February. This was originally a GSE only repeat sales, however there is also an expanded index.
 10:00 AM ET: Job Openings and Labor Turnover Survey for March from the BLS.
 This graph shows job openings (black line), hires (dark blue), Layoff, Discharges and other (red column), and Quits (light blue column) from the JOLTS.
Jobs openings decreased in February to 7.57 million from 7.76 million in January.
The number of job openings (black) were down 10% year-over-year.
7:00 AM ET: The Mortgage Bankers Association (MBA) will release the results for the mortgage purchase applications index.
8:15 AM: The ADP Employment Report for April. This report is for private payrolls only (no government). The consensus is for 130,000 payroll jobs added in April, down from 155,000 added in March.
8:30 AM: Gross Domestic Product, 1st quarter 2025 (Advance estimate). The consensus is that real GDP increased 0.4% annualized in Q1, down from 2.4% in Q4.
9:45 AM: Chicago Purchasing Managers Index for April. The consensus is for a reading of 45.5, down from 47.6 in March.
10:00 AM: Personal Income and Outlays, March 2025. The consensus is for a 0.4% increase in personal income, and for a 0.6% increase in personal spending. And for the Core PCE price index to increase 0.1%. PCE prices are expected to be up 2.6% YoY, and core PCE prices up 2.2% YoY.
10:00 AM: Pending Home Sales Index for March. The consensus is for a 1.0% increase in the index.
8:30 AM: The initial weekly unemployment claims report will be released. The consensus is for initial claims of 218 thousand, down from 222 thousand last week.
10:00 AM ET: ISM Manufacturing Index for April. The consensus is for the ISM to be at 48.1, down from 49.0 in March.
10:00 AM: Construction Spending for March. The consensus is for a 0.3% increase in construction spending.
 All day: Light vehicle sales for April. The consensus expectation is for light vehicle sales to be 16.8 million SAAR in April, down from 17.8 million in March (Seasonally Adjusted Annual Rate).
This graph shows light vehicle sales since the BEA started keeping data in 1967. The dashed line is the sales rate for the previous month.
The WardsAuto estimate is for sales of 17.4 million SAAR in April.
 8:30 AM: Employment Report for April. The consensus is for 130,000 jobs added, and for the unemployment rate to be unchanged at 4.2%.
There were 228,000 jobs added in March, and the unemployment rate was at 4.2%.
This graph shows the jobs added per month since January 2021.
Friday, April 25, 2025
April 25th COVID Update: COVID Deaths Continue to Decline
by Calculated Risk on 4/25/2025 06:55:00 PM
 Note: Mortgage rates are from MortgageNewsDaily.com and are for top tier scenarios.
For deaths, I'm currently using 4 weeks ago for "now", since the most recent three weeks will be revised significantly.
Note: "Effective May 1, 2024, hospitals are no longer required to report COVID-19 hospital admissions, hospital capacity, or hospital occupancy data." So, I'm no longer tracking hospitalizations.
| COVID Metrics | ||||
|---|---|---|---|---|
| Now | Week Ago | Goal | ||
| Deaths per Week | 442 | 444 | ≤3501 | |
| 1my goals to stop weekly posts. 🚩 Increasing number weekly for Deaths. ✅ Goal met. | ||||
 Click on graph for larger image.
This graph shows the weekly (columns) number of deaths reported since Jan 2023.
Although weekly deaths met the original goal to stop posting in June 2023 (low of 314 deaths), I've continued to post since deaths are above the goal again - and I'll continue to post until weekly deaths are once again below the goal.
Weekly deaths are now decreasing following the winter pickup and are heading towards the lows of last June.
 This appears to be a leading indicator for COVID hospitalizations and deaths. This has been moving down.
Nationally COVID in wastewater is "Low".
Philly Fed: State Coincident Indexes Increased in 43 States in March (3-Month Basis)
by Calculated Risk on 4/25/2025 03:53:00 PM
From the Philly Fed:
The Federal Reserve Bank of Philadelphia has released the coincident indexes for the 50 states for March 2025. Over the past three months, the indexes increased in 43 states, decreased in four states, and remained stable in three, for a three-month diffusion index of 78. Additionally, in the past month, the indexes increased in 39 states, decreased in seven states, and remained stable in four, for a one-month diffusion index of 64. For comparison purposes, the Philadelphia Fed has also developed a similar coincident index for the entire United States. The Philadelphia Fed’s U.S. index increased 0.6 percent over the past three months and 0.2 percent in March.Note: These are coincident indexes constructed from state employment data. An explanation from the Philly Fed:
emphasis added
The coincident indexes combine four state-level indicators to summarize current economic conditions in a single statistic. The four state-level variables in each coincident index are nonfarm payroll employment, average hours worked in manufacturing by production workers, the unemployment rate, and wage and salary disbursements deflated by the consumer price index (U.S. city average). The trend for each state’s index is set to the trend of its gross domestic product (GDP), so long-term growth in the state’s index matches long-term growth in its GDP.
 Click on map for larger image.
Here is a map of the three-month change in the Philly Fed state coincident indicators. This map was all red during the worst of the Pandemic and also at the worst of the Great Recession.
The map is mostly positive on a three-month basis.
Source: Philly Fed.
 And here is a graph is of the number of states with one month increasing activity according to the Philly Fed.
 This graph includes states with minor increases (the Philly Fed lists as unchanged).
In March, 41 states had increasing activity including minor increases.
In March, 41 states had increasing activity including minor increases.


