 RSS Feed
 by Calculated Risk on 9/27/2023 07:00:00 AM
Wednesday, September 27, 2023
MBA: Mortgage Applications Decreased in Weekly Survey
From the MBA: Mortgage Applications Decrease in Latest MBA Weekly Survey
Mortgage applications decreased 1.3 percent from one week earlier, according to data from the Mortgage Bankers Association’s (MBA) Weekly Mortgage Applications Survey for the week ending September 22, 2023.
The Market Composite Index, a measure of mortgage loan application volume, decreased 1.3 percent on a seasonally adjusted basis from one week earlier. On an unadjusted basis, the Index decreased 2 percent compared with the previous week. The Refinance Index decreased 1 percent from the previous week and was 21 percent lower than the same week one year ago. The seasonally adjusted Purchase Index decreased 2 percent from one week earlier. The unadjusted Purchase Index decreased 2 percent compared with the previous week and was 27 percent lower than the same week one year ago.
“Mortgage rates moved to their highest levels in over 20 years as Treasury yields increased late last week. The 30-year fixed mortgage rate increased to 7.41 percent, the highest rate since December 2000, and the 30-year fixed jumbo mortgage rate increased to 7.34 percent, the highest rate in the history of the jumbo rate series dating back to 2011,” said Joel Kan, MBA’s Vice President and Deputy Chief Economist. “Based on the FOMC’s most recent projections, rates are expected to be higher for longer, which drove the increase in Treasury yields. Overall applications declined, as both prospective homebuyers and homeowners continue to feel the impact of these elevated rates. The purchase market, which is still facing limited for-sale inventory and eroded purchasing power, saw applications down over the week and 27 percent behind last year’s pace. Refinance activity was down over 20 percent from last year and accounted for approximately one third of applications, as many homeowners have little incentive to refinance.”
...
The average contract interest rate for 30-year fixed-rate mortgages with conforming loan balances ($726,200 or less) increased to 7.41 percent, the highest level since December 2000, from 7.31 percent, with points decreasing to 0.71 from 0.72 (including the origination fee) for 80 percent loan-to-value ratio (LTV) loans.
emphasis added
 Click on graph for larger image.
The first graph shows the MBA mortgage purchase index.
According to the MBA, purchase activity is down 27% year-over-year unadjusted.
Red is a four-week average (blue is weekly).

The second graph shows the refinance index since 1990.
With higher mortgage rates, the refinance index declined sharply in 2022 - and has mostly flat lined at a low level since then.
Tuesday, September 26, 2023
Wednesday: Durable Goods
by Calculated Risk on 9/26/2023 07:37:00 PM
 Note: Mortgage rates are from MortgageNewsDaily.com and are for top tier scenarios.
Wednesday:
• At 7:00 AM ET, The Mortgage Bankers Association (MBA) will release the results for the mortgage purchase applications index.
• 8:30 AM, Durable Goods Orders for August from the Census Bureau. The consensus is for a 1.6% decrease in durable goods orders.
New Home Sales decrease to 675,000 Annual Rate in August; Median New Home Price is Down 13% from the Peak
by Calculated Risk on 9/26/2023 11:52:00 AM
Today, in the Calculated Risk Real Estate Newsletter: New Home Sales decrease to 675,000 Annual Rate in August
Brief excerpt:
The Census Bureau reports New Home Sales in August were at a seasonally adjusted annual rate (SAAR) of 675 thousand. The previous three months were revised up, combined.You can subscribe at https://calculatedrisk.substack.com/.
...
The next graph shows new home sales for 2022 and 2023 by month (Seasonally Adjusted Annual Rate). Sales in August 2023 were up 5.8% from August 2022. Year-to-date sales are up 1.8% compared to the same period in 2022.
As expected, new home sales were up year-over-year in August, and it is fairly certain there will be more sales in 2023 than in 2022 - although 7%+ mortgage rates will likely slow sales.

New Home Sales decrease to 675,000 Annual Rate in August
by Calculated Risk on 9/26/2023 10:00:00 AM
The Census Bureau reports New Home Sales in August were at a seasonally adjusted annual rate (SAAR) of 675 thousand.
The previous three months were revised up, combined.
Sales of new single‐family houses in August 2023 were at a seasonally adjusted annual rate of 675,000, according to estimates released jointly today by the U.S. Census Bureau and the Department of Housing and Urban Development. This is 8.7 percent below the revised July rate of 739,000, but is 5.8 percent above the August 2022 estimate of 638,000.
emphasis added
 Click on graph for larger image.
The first graph shows New Home Sales vs. recessions since 1963. The dashed line is the current sales rate.
New home sales are close to pre-pandemic levels.
The second graph shows New Home Months of Supply.
 The months of supply increased in August to 7.8 months from 7.0 months in July.
 The all-time record high was 12.2 months of supply in January 2009. The all-time record low was 3.3 months in August 2020.
This is above the top of the normal range (about 4 to 6 months of supply is normal).
"The seasonally‐adjusted estimate of new houses for sale at the end of August was 436,000. This represents a supply of 7.8 months at the current sales rate."Sales were below expectations of 700 thousand SAAR, however, sales for the three previous months were revised up, combined. I'll have more later today.
Comments on July Case-Shiller and FHFA House Prices
by Calculated Risk on 9/26/2023 09:46:00 AM
Today, in the Calculated Risk Real Estate Newsletter: Case-Shiller: National House Price Index Up 1.0% year-over-year in July; New all-time High
Excerpt:
S&P/Case-Shiller released the monthly Home Price Indices for July ("July" is a 3-month average of May, June and July closing prices). July closing prices include some contracts signed in March, so there is a significant lag to this data. Here is a graph of the month-over-month (MoM) change in the Case-Shiller National Index Seasonally Adjusted (SA).
The MoM increase in the seasonally adjusted Case-Shiller National Index was at 0.65%. This was the sixth consecutive MoM increase following seven straight MoM decreases.
On a seasonally adjusted basis, prices increased in all of the 20 Case-Shiller cities on a month-to-month basis. Seasonally adjusted, San Francisco has fallen 9.7% from the recent peak, Seattle is down 8.8% from the peak, Las Vegas is down 8.3%, and Phoenix is down 7.6%.

There is much more in the article. You can subscribe at https://calculatedrisk.substack.com/
Case-Shiller: National House Price Index Up 1.0% year-over-year in July; New all-time High
by Calculated Risk on 9/26/2023 09:00:00 AM
S&P/Case-Shiller released the monthly Home Price Indices for July ("July" is a 3-month average of May, June and July closing prices).
This release includes prices for 20 individual cities, two composite indices (for 10 cities and 20 cities) and the monthly National index.
From S&P S&P CoreLogic Case-Shiller Index Continues to Trend Upward in July
The S&P CoreLogic Case-Shiller U.S. National Home Price NSA Index, covering all nine U.S. census divisions, reported 1.0% annual change in July, up from a 0% change in the previous month. The 10- City Composite showed an increase of 0.9%, which improves from a -0.5% loss in the previous month. The 20-City Composite posted a year-over-year increase of 0.1%, improving from a loss of -1.2% in the previous month.
...
Before seasonal adjustment, the U.S. National Index, 10-City and 20-City Composites, all posted a 0.6% month-over-month increase in July.
After seasonal adjustment, the U.S. National Index posted a month-over-month increase of 0.6%, while the 10-City posted a 0.8% increase and 20-City Composite a 0.9% increase.
“U.S. home prices continued to rally in July 2023,” says Craig J. Lazzara, Managing Director at S&P DJI. “Our National Composite rose by 0.6% in July, and now stands 1.0% above its year-ago level. Our 10- and 20-City Composites each also rose in July 2023, and likewise stand slightly above their July 2022 levels.
“We have previously noted that home prices peaked in June 2022 and fell through January of 2023, declining by 5.0% in those seven months. The increase in prices that began in January has now erased the earlier decline, so that July represents a new all-time high for the National Composite. Moreover, this recovery in home prices is broadly based. As was the case last month, 10 of the 20 cities in our sample have reached all-time high levels. In July, prices rose in all 20 cities after seasonal adjustment (and in 19 of them before adjustment).
“That said, regional differences continue to be striking. On a year-over-year basis, the Revenge of the Rust Belt continues. The three best-performing metropolitan areas in July were Chicago (+4.4%), Cleveland (+4.0%), and New York (+3.8%), repeating the ranking we saw in May and June. The bottom of the leader board reshuffled somewhat, with Las Vegas (-7.2%) and Phoenix (-6.6%) this month’s worst performers.
emphasis added
 Click on graph for larger image.
 The first graph shows the nominal seasonally adjusted Composite 10, Composite 20 and National indices (the Composite 20 was started in January 2000).
The Composite 10 index is up 0.8 in July (SA) and is at a new all-time high.
The Composite 20 index is up 0.9% (SA) in July and is also at a new all-time high.
The National index is up 0.6% (SA) in July and is also at a new all-time high.
 The second graph shows the year-over-year change in all three indices.
The Composite 10 SA is up 0.9% year-over-year. The Composite 20 SA is up 0.1% year-over-year.
The National index SA is up 1.0% year-over-year.
Annual price changes were close to expectations. I'll have more later.
Monday, September 25, 2023
Tuesday: Case-Shiller House Prices, New Home Sales
by Calculated Risk on 9/25/2023 07:45:00 PM
 From Matthew Graham at Mortgage News Daily: Mortgage Rates Officially Hit New Multi-Decade Highs
For the average lender, a top tier 30yr fixed rate is now over 7.5% for the first time in at least 22 years. The average borrower (not "top tier") is seeing rates that are even higher. This assumes an adjustment for discount points. Many loans are being quoted with points currently, and in those cases, the note rate would be a bit lower. [30 year fixed 7.51%]Tuesday:
emphasis added
• At 9:00 AM ET, S&P/Case-Shiller House Price Index for July. The consensus is for a 0.5% year-over-year increase in the National index for July.
• Also at 9:00 AM, FHFA House Price Index for July. This was originally a GSE only repeat sales, however there is also an expanded index.
• At 10:00 AM, New Home Sales for August from the Census Bureau. The consensus is for 700 thousand SAAR, down from 714 thousand in July.
• Also at 10:00 AM, the Richmond Fed manufacturing survey for September.
Final Look at Local Housing Markets in August
by Calculated Risk on 9/25/2023 01:56:00 PM
Today, in the Calculated Risk Real Estate Newsletter: Final Look at Local Housing Markets in August
A brief excerpt:
Each month I track closed sales, new listings and active inventory in a sample of local markets around the country (over 40 local housing markets) in the US to get an early sense of changes in the housing market. In addition, we can look for regional differences.There is much more in the article. You can subscribe at https://calculatedrisk.substack.com/
After the National Association of Realtors® (NAR) releases the monthly existing home sales report, I pick up additional local market data that is reported after the NAR (and I’m adding more markets). This is the final look at local markets in August.
The big story for August existing home sales was the near cycle low sales volume, and the large year-over-year (YoY) decline in sales. Also new listings were down YoY, but much less than in previous months.
This table shows the YoY change in new listings since the start of 2023. The smaller decline is due to a combination of new listings collapsing in the 2nd half of 2022, and new listings holding up more seasonally than normal (but still historically very low).
...
More local data coming in October for activity in September!

Update on Four High Frequency Indicators
by Calculated Risk on 9/25/2023 12:19:00 PM
I stopped the weekly updates of high frequency indicators at the end of 2022.
Here is a late September look at four indicators:
The TSA is providing daily travel numbers.
This data is as of September 24th.
 Click on graph for larger image.
This data shows the 7-day average of daily total traveler throughput from the TSA for 2019 (Light Blue), 2020 (Black), 2021 (Blue), 2022 (Orange) and 2023 (Red).
The dashed line is the percent of 2019 for the seven-day average.
The 7-day average is above the level for the same week in 2019 (103.4% of 2019). (Dashed line)
Air travel - as a percent of 2019 - is tracking above pre-pandemic levels.
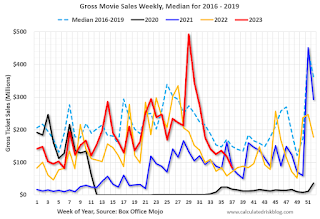
----- Movie Tickets: Box Office Mojo -----
 This data shows domestic box office for each week and the median for the years 2016 through 2019 (dashed light blue).
 This data shows domestic box office for each week and the median for the years 2016 through 2019 (dashed light blue).
 Black is 2020, Blue is 2021 and Red is 2022.
The data is from BoxOfficeMojo through September 21st.
Note that the data is usually noisy week-to-week and depends on when blockbusters are released.
Movie ticket sales (dollars) have mostly been running below the pre-pandemic levels.
Note that the data is usually noisy week-to-week and depends on when blockbusters are released.
Movie ticket sales (dollars) have mostly been running below the pre-pandemic levels.
 This graph shows the seasonal pattern for the hotel occupancy rate using the four-week average.
 The red line is for 2023, black is 2020, blue is the median, and dashed light blue is for 2022. Dashed purple is for 2018, the record year for hotel occupancy.
This data is through September 16th. The occupancy rate was down 2.2% compared to the same week in 2022.
The 4-week average of the occupancy rate is tracking just below last year, and slightly above the median rate for the period 2000 through 2022 (Blue).
Notes: Y-axis doesn't start at zero to better show the seasonal change.
Notes: Y-axis doesn't start at zero to better show the seasonal change.

This graph, based on weekly data from the U.S. Energy Information Administration (EIA) shows gasoline supplied compared to the same week of 2019.
Blue is for 2020. Purple is for 2021, and Orange is for 2022, and Red is for 2023.
Gasoline supplied in 2023 is running about 5% below 2019 levels.
Housing September 25th Weekly Update: Inventory increased 1.8% Week-over-week; Down 5.2% Year-over-year
by Calculated Risk on 9/25/2023 08:21:00 AM
Altos reports that active single-family inventory was up 1.8% week-over-week.
 Click on graph for larger image.
This inventory graph is courtesy of Altos Research.
As of September 22nd, inventory was at 527 thousand (7-day average), compared to 519 thousand the prior week.
Year-to-date, inventory is up 7.6%. And inventory is up 30.2% from the seasonal bottom 23 weeks ago.

The red line is for 2023. The black line is for 2019. Note that inventory is up from the record low for the same week in 2021, but below last year and still well below normal levels.
Inventory was down 5.2% compared to the same week in 2022 (last week it was down 6.1%), and down 44.7% compared to the same week in 2019 (last week down 45.6%).
In 2022, inventory didn't peak until late October, and it appears same week inventory will be below 2022 levels for the remainder of the year - depending on when inventory peaks seasonally this year!
It seems likely that inventory will be close to or above 2020 levels (dark blue line) by the end of the year.
Mike Simonsen discusses this data regularly on Youtube.


