 RSS Feed
 by Calculated Risk on 12/15/2022 08:45:00 AM
Thursday, December 15, 2022
Retail Sales Decreased 0.6% in November
On a monthly basis, retail sales were up 0.6% from October to November (seasonally adjusted), and sales were up 6.5 percent from November 2021.
From the Census Bureau report:
Advance estimates of U.S. retail and food services sales for November 2022, adjusted for seasonal variation and holiday and trading-day differences, but not for price changes, were $689.4 billion, down 0.6 percent from the previous month, but up 6.5 percent above November 2021. ... The September 2022 to October 2022 percent change was unrevised from up 1.3 percent.
emphasis added
 Click on graph for larger image.
This graph shows retail sales since 1992. This is monthly retail sales and food service, seasonally adjusted (total and ex-gasoline).
Retail sales ex-gasoline were down 0.6% in November.
The second graph shows the year-over-year change in retail sales and food service (ex-gasoline) since 1993.
Retail and Food service sales, ex-gasoline, increased by 5.6% on a YoY basis.
 Sales in November were below expectations, and sales in September and October were revised down, combined.
Weekly Initial Unemployment Claims decrease to 211,000
by Calculated Risk on 12/15/2022 08:33:00 AM
The DOL reported:
In the week ending December 10, the advance figure for seasonally adjusted initial claims was 211,000, a decrease of 20,000 from the previous week's revised level. The previous week's level was revised up by 1,000 from 230,000 to 231,000. The 4-week moving average was 227,250, a decrease of 3,000 from the previous week's revised average. The previous week's average was revised up by 250 from 230,000 to 230,250.The following graph shows the 4-week moving average of weekly claims since 1971.
emphasis added
 Click on graph for larger image.
The dashed line on the graph is the current 4-week average. The four-week average of weekly unemployment claims decreased to 227,250.
The previous week was revised up.
Weekly claims were lower than the consensus forecast.
Wednesday, December 14, 2022
Thursday: Retail Sales, Unemployment Claims, Industrial Production
by Calculated Risk on 12/14/2022 09:02:00 PM
 Note: Mortgage rates are from MortgageNewsDaily.com and are for top tier scenarios.
Thursday:
• At 8:30 AM ET, Retail sales for November will be released. The consensus is for a 0.2% decrease in retail sales.
• Also at 8:30 AM, The initial weekly unemployment claims report will be released. The consensus is for 230 thousand initial claims, unchanged from 230 thousand last week.
• Also at 8:30 AM, The New York Fed Empire State manufacturing survey for December. The consensus is for a reading of -1.0, down from 4.5.
• Also at 8:30 AM, the Philly Fed manufacturing survey for December. The consensus is for a reading of -12.0, up from -19.4.
• At 9:15 AM, The Fed will release Industrial Production and Capacity Utilization for November. The consensus is for a 0.1% increase in Industrial Production, and for Capacity Utilization to decrease to 79.8%.
FOMC Projections and Press Conference
by Calculated Risk on 12/14/2022 02:12:00 PM
Statement here.
Fed Chair Powell press conference video here or on YouTube here, starting at 2:30 PM ET.
Here are the projections. In September, the FOMC participants’ midpoint of the target level for the federal funds rate was 4.625%. The FOMC participants’ midpoint of the target range is now closer to 5.125%.
Current Wall Street forecasts are for GDP to increase in 2022 Q4 over Q4, slightly above FOMC September projections. These tracking estimates would put Q4/Q4 at 0.63% in 2022. So, the FOMC revised up 2022 GDP slightly, but revised down 2023 GDP.
| GDP projections of Federal Reserve Governors and Reserve Bank presidents, Change in Real GDP1 | ||||
|---|---|---|---|---|
| Projection Date | 2022 | 2023 | 2024 | 2025 |
| Dec 2022 | 0.4 to 0.5 | 0.4 to 1.0 | 1.3 to 2.0 | 1.6 to 2.0 |
| Sept 2022 | 0.1 to 0.3 | 0.5 to 1.5 | 1.4 to 2.0 | 1.6 to 2.0 |
The unemployment rate was at 3.7% in November. So far, the economic slowdown has barely pushed up the unemployment rate, and the FOMC revised down the 2022 projection but revised 2023 up.
| Unemployment projections of Federal Reserve Governors and Reserve Bank presidents, Unemployment Rate2 | ||||
|---|---|---|---|---|
| Projection Date | 2022 | 2023 | 2024 | 2025 |
| Dec 2022 | 3.7 | 4.4 to 4.7 | 4.3 to 4.8 | 4.0 to 4.7 |
| Sept 2022 | 3.8 to 3.9 | 4.1 to 4.5 | 4.0 to 4.6 | 4.0 to 4.5 |
As of October 2022, PCE inflation was up 6.0% from October 2021. This was below the cycle high of 7.0% YoY in June. The FOMC revised up PCE inflation for 2022.
| Inflation projections of Federal Reserve Governors and Reserve Bank presidents, PCE Inflation1 | ||||
|---|---|---|---|---|
| Projection Date | 2022 | 2023 | 2024 | 2025 |
| Dec 2022 | 5.6 to 5.8 | 2.9 to 3.5 | 2.3 to 2.7 | 2.0 to 2.2 |
| Sept 2022 | 5.3 to 5.7 | 2.6 to 3.5 | 2.1 to 2.6 | 2.0 to 2.2 |
PCE core inflation was up 5.0% in October year-over-year. This was below the cycle high of 5.4% YoY in February. Core inflation has picked up more than expected and the FOMC revised up their projections.
| Core Inflation projections of Federal Reserve Governors and Reserve Bank presidents, Core Inflation1 | ||||
|---|---|---|---|---|
| Projection Date | 2022 | 2023 | 2024 | 2025 |
| Dec 2022 | 4.7 to 4.8 | 3.2 to 3.7 | 2.3 to 2.7 | 2.0 to 2.2 |
| Sept 2022 | 4.4 to 4.6 | 3.0 to 3.4 | 2.2 to 2.5 | 2.0 to 2.2 |
FOMC Statement: Raise Rates 50 bp; "Ongoing increases appropriate"
by Calculated Risk on 12/14/2022 02:02:00 PM
Fed Chair Powell press conference video here or on YouTube here, starting at 2:30 PM ET.
FOMC Statement:
Recent indicators point to modest growth in spending and production. Job gains have been robust in recent months, and the unemployment rate has remained low. Inflation remains elevated, reflecting supply and demand imbalances related to the pandemic, higher food and energy prices, and broader price pressures.
Russia's war against Ukraine is causing tremendous human and economic hardship. The war and related events are contributing to upward pressure on inflation and are weighing on global economic activity. The Committee is highly attentive to inflation risks.
The Committee seeks to achieve maximum employment and inflation at the rate of 2 percent over the longer run. In support of these goals, the Committee decided to raise the target range for the federal funds rate to 4-1/4 to 4-1/2 percent. The Committee anticipates that ongoing increases in the target range will be appropriate in order to attain a stance of monetary policy that is sufficiently restrictive to return inflation to 2 percent over time. In determining the pace of future increases in the target range, the Committee will take into account the cumulative tightening of monetary policy, the lags with which monetary policy affects economic activity and inflation, and economic and financial developments. In addition, the Committee will continue reducing its holdings of Treasury securities and agency debt and agency mortgage-backed securities, as described in the Plans for Reducing the Size of the Federal Reserve's Balance Sheet that were issued in May. The Committee is strongly committed to returning inflation to its 2 percent objective.
In assessing the appropriate stance of monetary policy, the Committee will continue to monitor the implications of incoming information for the economic outlook. The Committee would be prepared to adjust the stance of monetary policy as appropriate if risks emerge that could impede the attainment of the Committee's goals. The Committee's assessments will take into account a wide range of information, including readings on public health, labor market conditions, inflation pressures and inflation expectations, and financial and international developments.
Voting for the monetary policy action were Jerome H. Powell, Chair; John C. Williams, Vice Chair; Michael S. Barr; Michelle W. Bowman; Lael Brainard; James Bullard; Susan M. Collins; Lisa D. Cook; Esther L. George; Philip N. Jefferson; Loretta J. Mester; and Christopher J. Waller.
emphasis added
Current State of the Housing Market; Overview for mid-December
by Calculated Risk on 12/14/2022 10:18:00 AM
Today, in the Calculated Risk Real Estate Newsletter: Current State of the Housing Market; Overview for mid-December
A brief excerpt:
Over the last month …There is much more in the article. You can subscribe at https://calculatedrisk.substack.com/
1. New listings have declined further year-over-year (YoY).
2. Mortgage rates have declined recently but are still up sharply YoY.
3. House prices are declining month-over-month (MoM) as measured by the Case-Shiller repeat sales index.
4. Rents are falling.
...
And here is a graph comparing the YoY change in the NAR median prices vs the Case-Shiller National Index (the median is distorted by the mix of homes sold, and also lagged since this is for closing prices).
The YoY change in the median price peaked at 25.2% in May 2021 and has now slowed to 6.6%. In general, the NAR median price leads the Case-Shiller index by 2 to 3 months, so I expect the Case-Shiller index to show significantly slower YoY growth over the next several months.
...
Next Wednesday, the NAR will release existing home sales for November. This report will likely show another sharp year-over-year decline in sales for November.

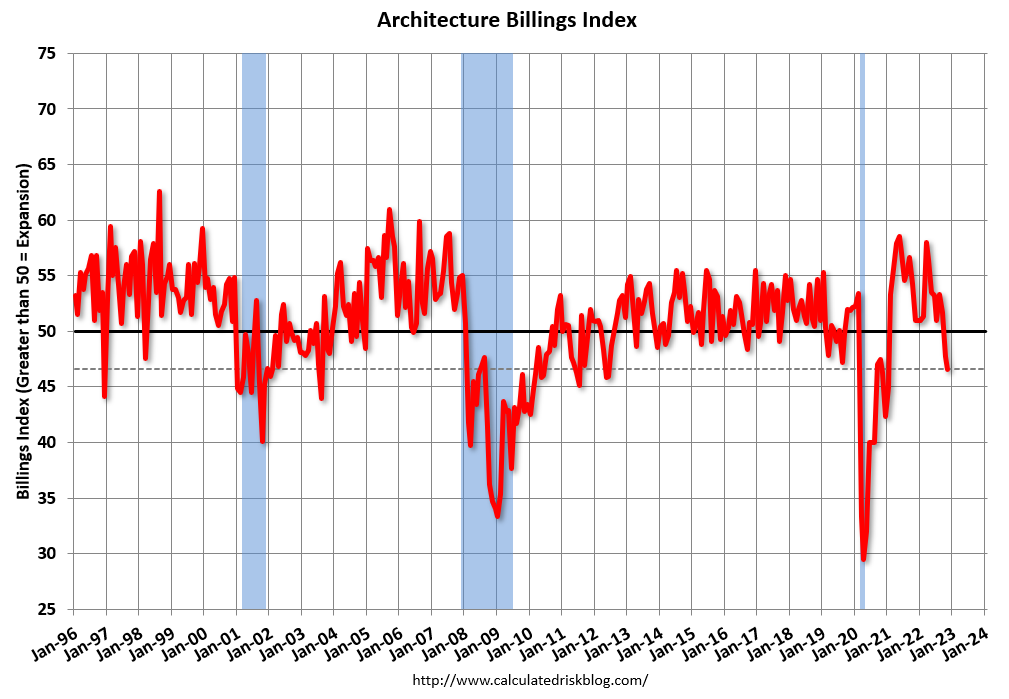
AIA: Architecture Billings Index Declines Further in November
by Calculated Risk on 12/14/2022 09:29:00 AM
Note: This index is a leading indicator primarily for new Commercial Real Estate (CRE) investment.
From the AIA: Demand for design services continues to slow
Demand for design services from architecture firms continued to decrease in November, according to a new report from The American Institute of Architects (AIA).
The pace of decline during November accelerated from October, posting an Architecture Billings Index (ABI) score of 46.6 from 47.7 (any score below 50 indicates a decline in firm billings). The pace of inquiries into new projects slowed, but remained positive with a score of 52.0, however new design contracts remained in negative territory with a score of 46.9.
“Given the slowdown in new project work, many architecture firms will rely on their near record levels of backlogs to support revenue,” said AIA Chief Economist, Kermit Baker, Hon. AIA, PhD. “Still, firm leaders remain largely optimistic about future business trends. Almost two-thirds of architecture firms project that 2023 will be either a good year or great year for their firm.”
...
• Regional averages: South (50.5); Midwest (47.6); West (45.8); Northeast (42.4)
• Sector index breakdown: mixed practice (51.5); institutional (47.7); multi-family residential (46.1); commercial/industrial (44.2)
emphasis added
 Click on graph for larger image.
This graph shows the Architecture Billings Index since 1996. The index was at 46.6 in November, down from 47.7 in October. Anything below 50 indicates contraction in demand for architects' services.
Note: This includes commercial and industrial facilities like hotels and office buildings, multi-family residential, as well as schools, hospitals and other institutions.
This index had been positive for 20 consecutive months but indicated a decline the last two months. This index usually leads CRE investment by 9 to 12 months, so this index suggests a pickup in CRE investment in early 2023, but if the weakness persists - a slowdown in CRE investment later in 2023.
Note that multi-family billing turned down in September and has been negative for three consecutive months, and if that continues, we will see a downturn in multi-family starts sometime in 2023.
MBA: Mortgage Applications Increase in Latest Weekly Survey
by Calculated Risk on 12/14/2022 07:00:00 AM
From the MBA: Mortgage Applications Decrease in Latest MBA Weekly Survey
Mortgage applications increased 3.2 percent from one week earlier, according to data from the Mortgage Bankers Association’s (MBA) Weekly Mortgage Applications Survey for the week ending December 9, 2022.
... The Refinance Index increased 3 percent from the previous week and was 85 percent lower than the same week one year ago. The seasonally adjusted Purchase Index increased 4 percent from one week earlier. The unadjusted Purchase Index decreased 1 percent compared with the previous week and was 38 percent lower than the same week one year ago.
“Mortgage rates increased slightly after a month of declines, as financial markets reacted to mixed signals regarding inflation and the Federal Reserve’s next policy moves. The 30-year fixed rate inched to 6.42 percent, which is still close to the lowest rate in a month,” said Joel Kan, MBA’s Vice President and Deputy Chief Economist. “Overall applications increased, driven by increases in purchase and refinance activity. However, with rates more than three percentage points higher than a year ago, both purchase and refinance applications are still well behind last year’s pace.”
Added Kan, “The ongoing moderation in home-price growth, along with further declines in mortgage rates, may encourage more buyers to return to the market in the coming months.”
...
The average contract interest rate for 30-year fixed-rate mortgages with conforming loan balances ($647,200 or less) increased to 6.42 percent from 6.41 percent, with points increasing to 0.64 from 0.63 (including the origination fee) for 80 percent loan-to-value ratio (LTV) loans.
emphasis added
 Click on graph for larger image.
The first graph shows the refinance index since 1990.
With higher mortgage rates, the refinance index has declined sharply this year.
The refinance index is up slightly from the low in November 2022 (an extreme low).
The second graph shows the MBA mortgage purchase index
 According to the MBA, purchase activity is down 38% year-over-year unadjusted.
The purchase index is at the pandemic low and up from the low in October 2022.
Note: Red is a four-week average (blue is weekly).
Note: Red is a four-week average (blue is weekly).
Tuesday, December 13, 2022
Wednesday: FOMC Statement and Press Conference
by Calculated Risk on 12/13/2022 09:01:00 PM
 Note: Mortgage rates are from MortgageNewsDaily.com and are for top tier scenarios.
Wednesday:
• At 7:00 AM ET, The Mortgage Bankers Association (MBA) will release the results for the mortgage purchase applications index.
• During the day, The AIA's Architecture Billings Index for November (a leading indicator for commercial real estate).
• At 2:00 PM, FOMC Meeting Announcement. The FOMC is expected to announce a 50 bp hike in the Fed Funds rate.
• At 2:00 PM, FOMC Forecasts This will include the Federal Open Market Committee (FOMC) participants' projections of the appropriate target federal funds rate along with the quarterly economic projections.
• At 2:30 PM, Fed Chair Jerome Powell holds a press briefing following the FOMC announcement.
CoreLogic: 1.1 million Homeowners with Negative Equity in Q3 2022
by Calculated Risk on 12/13/2022 02:38:00 PM
Note: This was released last Friday. From CoreLogic: CoreLogic: US Home Equity Gains Rose Annually in Q3 but Fell Sharply From Q2
CoreLogic® ... today released the Homeowner Equity Report (HER) for the third quarter of 2022. The report shows that U.S. homeowners with mortgages (which account for roughly 63% of all properties) saw equity increase by 15.8% year over year, representing a collective gain of $2.2 trillion, for an average of $34,300 per borrower, since the third quarter of 2021.
Nationwide, annual home equity gains began to slow in the third quarter of 2022, with the average borrower netting $34,300, compared with the nearly $60,000 year-over-year gain recorded in the second quarter. Slowing prices also caused an additional 43,000 properties to fall underwater. The quarter-over-quarter decline in equity is partially due to cooling home price growth across the country, as annual appreciation fell from about 18% in June to just slightly more than 10% in October. As home price gains are projected to relax into single digits for the rest of 2022, then possibly move into negative territory by the spring of 2023, equity increases will likely decline accordingly in some parts of the country.
“At 43.6%, the average U.S. loan-to-value (LTV) ratio is only slightly higher than in the past two quarters and still significantly lower than the 71.3% LTV seen moving into the Great Recession in the first quarter of 2010,” said Selma Hepp, interim lead of the Office of the Chief Economist at CoreLogic. “Therefore, today’s homeowners are in a much better position to weather the current housing slowdown and a potential recession than they were 12 years ago.”
“Weakening housing demand and the resulting decline in home prices since the spring’s peak reduced annual home equity gains and pushed an additional number of properties underwater in the third quarter,” said Hepp. “Nevertheless, while these negative impacts are concentrated in Western states such as California, homeowners with a mortgage there still average more than $580,000 in home equity.”
Negative equity, also referred to as underwater or upside-down mortgages, applies to borrowers who owe more on their mortgages than their homes are currently worth. As of the third quarter of 2022, the quarterly and annual changes in negative equity were:
• Quarterly change: From the second quarter of 2022 to the third quarter of 2022, the total number of mortgaged homes in negative equity increased by 4% to 1.1 million homes or 1.9% of all mortgaged properties.
• Annual change: In the third quarter of 2021, 1.2 million homes, or 2.2% of all mortgaged properties, were in negative equity. This number declined by 9.8% in the third quarter of 2022, to 1.1 million homes or 1.9% of all mortgage properties.
emphasis added
 Click on graph for larger image.
This graph from CoreLogic compares Q3 2022 to Q2 2022 equity distribution by LTV. There are still a few properties with LTV over 125%. But most homeowners have a significant amount of equity. This is a very different picture than at the start of the housing bust when many homeowners had little equity.
On a year-over-year basis, the number of homeowners with negative equity has declined from 1.2 million to 1.1 million.


