 RSS Feed
 by Calculated Risk on 7/18/2025 08:30:00 AM
Friday, July 18, 2025
Housing Starts Increased to 1.321 million Annual Rate in June
From the Census Bureau: Permits, Starts and Completions
Housing Starts:
Privately-owned housing starts in June were at a seasonally adjusted annual rate of 1,321,000. This is 4.6 percent above the revised May estimate of 1,263,000, but is 0.5 percent below the June 2024 rate of 1,327,000. Single-family housing starts in June were at a rate of 883,000; this is 4.6 percent below the revised May figure of 926,000. The June rate for units in buildings with five units or more was 414,000.
Building Permits:
Privately-owned housing units authorized by building permits in June were at a seasonally adjusted annual rate of 1,397,000. This is 0.2 percent above the revised May rate of 1,394,000, but is 4.4 percent below the June 2024 rate of 1,461,000. Single-family authorizations in June were at a rate of 866,000; this is 3.7 percent below the revised May figure of 899,000. Authorizations of units in buildings with five units or more were at a rate of 478,000 in June.
emphasis added
 Click on graph for larger image.
The first graph shows single and multi-family housing starts since 2000.
Multi-family starts (blue, 2+ units) increased sharply month-over-month in June. Multi-family starts were up 26.6% year-over-year.
Single-family starts (red) decreased in June and were down 10.0% year-over-year.
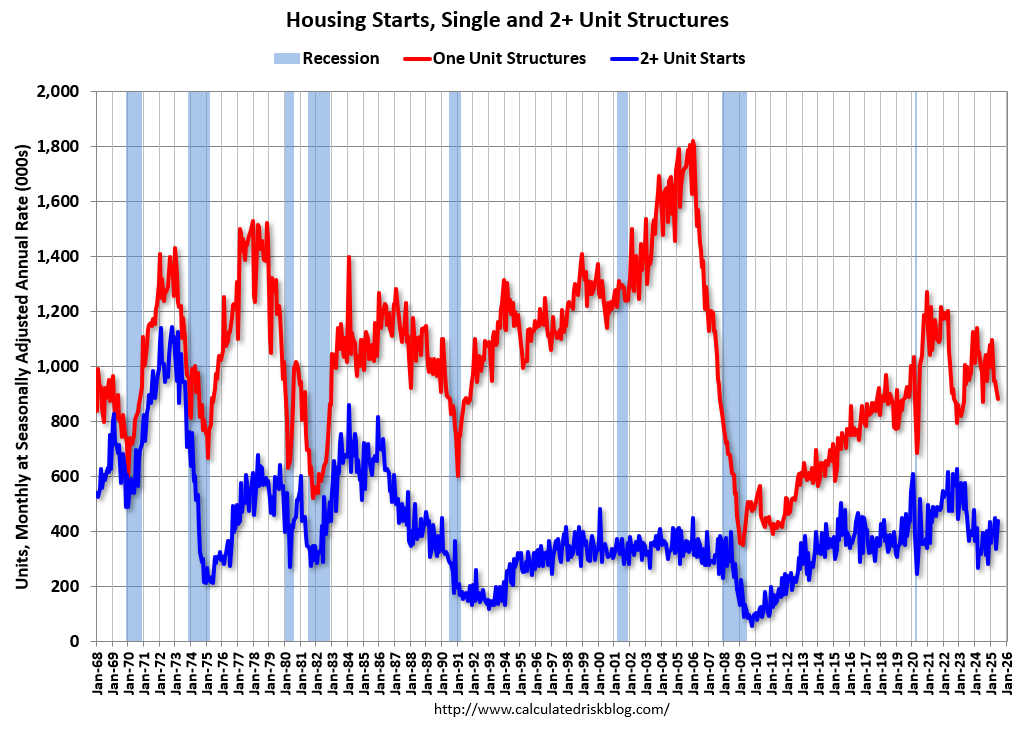 The second graph shows single and multi-family housing starts since 1968.
 Total housing starts in June were above expectations and starts in April and May were revised up.
I'll have more later …
Thursday, July 17, 2025
Friday: Housing Starts
by Calculated Risk on 7/17/2025 07:57:00 PM
 Note: Mortgage rates are from MortgageNewsDaily.com and are for top tier scenarios.
Friday:
• At 8:30 AM ET, Housing Starts for June. The consensus is for 1.300 million SAAR, up from 1.256 million SAAR in May.
• At 10:00 AM, University of Michigan's Consumer sentiment index (Preliminary for July).
• Also at 10:00 AM, State Employment and Unemployment (Monthly) for June 2025
LA Ports: Traffic Down 3% YoY in June
by Calculated Risk on 7/17/2025 03:16:00 PM
Container traffic gives us an idea about the volume of goods being exported and imported - and usually some hints about the trade report since LA area ports handle about 40% of the nation's container port traffic.
The following graphs are for inbound and outbound traffic at the ports of Los Angeles and Long Beach in TEUs (TEUs: 20-foot equivalent units or 20-foot-long cargo container).
The first graph is the monthly data (with a strong seasonal pattern for imports).
 Click on graph for larger image.
Usually imports peak in the July to October period as retailers import goods for the Christmas holiday and then decline sharply and bottom in the Winter depending on the timing of the Chinese New Year.
To remove the strong seasonal component for inbound traffic, the second graph shows the rolling 12-month average.
 On a rolling 12-month basis, inbound traffic decreased 0.3% in June compared to the rolling 12 months ending the previous month. Outbound traffic decreased 0.3% compared to the rolling 12 months ending the previous month.
 Click on graph for larger image.
Usually imports peak in the July to October period as retailers import goods for the Christmas holiday and then decline sharply and bottom in the Winter depending on the timing of the Chinese New Year.
Imports were down 3% YoY in June and exports were also down 3% YoY.
To remove the strong seasonal component for inbound traffic, the second graph shows the rolling 12-month average.
 On a rolling 12-month basis, inbound traffic decreased 0.3% in June compared to the rolling 12 months ending the previous month. Outbound traffic decreased 0.3% compared to the rolling 12 months ending the previous month.
Early this year, importers rushed to beat the tariffs.
Hotels: Occupancy Rate Decreased 3.2% Year-over-year
by Calculated Risk on 7/17/2025 01:11:00 PM
The U.S. hotel industry reported negative year-over-year comparisons, according to CoStar’s latest data through 12 July. ...The following graph shows the seasonal pattern for the hotel occupancy rate using the four-week average.
6-12 July 2025 (percentage change from comparable week in 2024):
• Occupancy: 67.2% (-3.2%)
• Average daily rate (ADR): US$158.42 (-0.5%)
• Revenue per available room (RevPAR): US$106.39 (-3.7%)
emphasis added
 Click on graph for larger image.
The red line is for 2025, blue is the median, and dashed light blue is for 2024. Dashed purple is for 2018, the record year for hotel occupancy.
The 4-week average of the occupancy rate is tracking behind last year and the median rate for the period 2000 through 2024 (Blue).
Note: Y-axis doesn't start at zero to better show the seasonal change.
The 4-week average will likely increase over the next several weeks.
On a year-to-date basis, the only worse years for occupancy over the last 25 years were pandemic or recession years.
NAHB: "Builder Confidence Edges Up in July"'; "Negative territory for 15 consecutive months"
by Calculated Risk on 7/17/2025 10:00:00 AM
The National Association of Home Builders (NAHB) reported the housing market index (HMI) was at 33, up from 33 last month. Any number below 50 indicates that more builders view sales conditions as poor than good.
From the NAHB: Builder Confidence Edges Up in July
Builder confidence for future sales expectations received a slight boost in July with the passage of the One Big Beautiful Bill Act but elevated interest rates and economic and policy uncertainty continue to act as headwinds for the housing sector.
Builder confidence in the market for newly built single-family homes was 33 in July, up one point from June, according to the National Association of Home Builders (NAHB)/Wells Fargo Housing Market Index (HMI) released today. Builder sentiment has now been in negative territory for 15 consecutive months.
“The passage of the One Big Beautiful Bill Act provided a number of important wins for households, home builders and small businesses,” said NAHB Chairman Buddy Hughes, a home builder and developer from Lexington, N.C. “While this new law should provide economic momentum after a disappointing spring, the housing sector has weakened in 2025 due to poor affordability conditions, particularly from elevated interest rates.”
Indeed, the latest HMI survey also revealed that 38% of builders reported cutting prices in July, the highest percentage since NAHB began tracking this figure on a monthly basis in 2022. This compares with 37% of builders who reported cutting prices in June, 34% in May and 29% in April. Meanwhile, the average price reduction was 5% in July, the same as it’s been every month since last November. The use of sales incentives was 62% in July, unchanged from June.
“Single-family housing starts will post a decline in 2025 due to ongoing housing affordability challenges,” said NAHB Chief Economist Robert Dietz. “Single-family permits are down 6% on a year-to-date basis and builder traffic in the HMI is at a more than two-year low.”
...
The HMI index gauging current sales conditions rose one point in July to a level of 36 while the component measuring sales expectations in the next six months increased three points to 43. The gauge charting traffic of prospective buyers posted a one-point decline to 20, the lowest reading since end of 2022.
Looking at the three-month moving averages for regional HMI scores, the Northeast increased two points to 45, the Midwest held steady at 41, the South dropped three points to 30 and the West declined three points to 25.
emphasis added
 Click on graph for larger image.
This graph shows the NAHB index since Jan 1985.
This was at the consensus forecast.
Retail Sales Increased 0.6% in June
by Calculated Risk on 7/17/2025 08:35:00 AM
On a monthly basis, retail sales increased 0.6% from May to June (seasonally adjusted), and sales were up 3.9 percent from June 2024.
From the Census Bureau report:
Advance estimates of U.S. retail and food services sales for June 2025, adjusted for seasonal variation and holiday and trading-day differences, but not for price changes, were $720.1 billion, up 0.6 percent from the previous month, and up 3.9 percent from June 2024. ... The April 2025 to May 2025 percent change was unrevised from down 0.9 percent (±0.2 percent).
emphasis added
 Click on graph for larger image.
This graph shows retail sales since 1992. This is monthly retail sales and food service, seasonally adjusted (total and ex-gasoline).
Retail sales ex-gasoline was up 0.7% in June.
The second graph shows the year-over-year change in retail sales and food service (ex-gasoline) since 1993.
Retail and Food service sales, ex-gasoline, increased by 4.9% on a YoY basis.
 The change in sales in June were above expectations and the previous two months were revised down slightly, combined.
Weekly Initial Unemployment Claims Decrease to 221,000
by Calculated Risk on 7/17/2025 08:30:00 AM
The DOL reported:
In the week ending July 12, the advance figure for seasonally adjusted initial claims was 221,000, a decrease of 7,000 from the previous week's revised level. The previous week's level was revised up by 1,000 from 227,000 to 228,000. The 4-week moving average was 229,500, a decrease of 6,250 from the previous week's revised average. The previous week's average was revised up by 250 from 235,500 to 235,750.The following graph shows the 4-week moving average of weekly claims since 1971.
emphasis added
 Click on graph for larger image.
The dashed line on the graph is the current 4-week average. The four-week average of weekly unemployment claims decreased to 229,500.
The previous week was revised up.
Weekly claims were lower than the consensus forecast.
Wednesday, July 16, 2025
Thursday: Retail Sales, Unemployment Claims, Philly Fed Mfg, Homebuilder Survey
by Calculated Risk on 7/16/2025 07:02:00 PM
 Note: Mortgage rates are from MortgageNewsDaily.com and are for top tier scenarios.
Thursday:
• At 8:30 AM ET, The initial weekly unemployment claims report will be released. The consensus is for initial claims to increase to 235 thousand from 233 thousand last week.
• Also at 8:30 AM, Retail sales for June is scheduled to be released. The consensus is for a 0.2% increase in retail sales.
• Also at 8:30 AM, the Philly Fed manufacturing survey for July. The consensus is for a reading of -0.5, up from -4.0.
• At 10:00 AM, The July NAHB homebuilder survey. The consensus is for a reading of 33, up from 32. Any number below 50 indicates that more builders view sales conditions as poor than good.
• At 10:00 AM, Speech, Fed Governor Adriana Kugler, A View of the Housing Market and U.S. Economic Outlook, At the Housing Partnership Network Symposium, Washington, D.C.
3rd Look at Local Housing Markets in June
by Calculated Risk on 7/16/2025 02:34:00 PM
Today, in the Calculated Risk Real Estate Newsletter: 3rd Look at Local Housing Markets in June
A brief excerpt:
This is the third look at local markets in June. I’m tracking over 40 local housing markets in the US. Some of the 40 markets are states, and some are metropolitan areas. I’ll update these tables throughout the month as additional data is released.There is much more in the article.
Closed sales in June were mostly for contracts signed in April and May, and mortgage rates, according to the Freddie Mac PMMS, averaged 6.73% in April and 6.82% in May (slightly higher than for closed sales in May).
...
In June, sales in these markets were up 4.7% YoY. Last month, in May, these same markets were down 3.8% year-over-year Not Seasonally Adjusted (NSA).
Important: There were more working days in June 2025 (20) as in June 2024 (19). So, the year-over-year change in the headline SA data will be lower than for the NSA data.
...
More local markets to come!

Fed's Beige Book: "Economic activity increased slightly"
by Calculated Risk on 7/16/2025 02:00:00 PM
Economic activity increased slightly from late May through early July. Five Districts reported slight or modest gains, five had flat activity, and the remaining two Districts noted modest declines in activity. That represented an improvement over the previous report, in which half of Districts reported at least slight declines in activity. Uncertainty remained elevated, contributing to ongoing caution by businesses. Nonauto consumer spending declined in most Districts, softening slightly overall. Auto sales receded modestly on average, after consumers had rushed to buy vehicles earlier this year to avoid tariffs. Tourism activity was mixed, manufacturing activity edged lower, and nonfinancial services activity was little changed on average but varied across Districts. Loan volume increased slightly in most Districts. Construction activity slowed somewhat, constrained by rising costs in some Districts. Home sales were flat or little changed in most Districts, and nonresidential real estate activity was also mostly steady. Activity in the agriculture sector remained weak. Energy sector activity declined slightly, and transportation activity was mixed. The outlook was neutral to slightly pessimistic, as only two Districts expected activity to increase, and others foresaw flat or slightly weaker activity.
Labor Markets
Employment increased very slightly overall, with one District noting modest increases, six reporting slight increases, three no change, and two noting slight declines. Hiring remained generally cautious, which many contacts attributed to ongoing economic and policy uncertainty. Labor availability improved for many employers, with further reductions in turnover rates and increased job applications. A growing number of Districts cited labor shortages in the skilled trades. Several Districts also mentioned reduced availability of foreign-born workers, attributed to changes in immigration policy. Employers in a few Districts ramped up investments in automation and AI aimed at reducing the need for additional hiring. Wages increased modestly overall, extending recent trends, with reports that ranged from flat wages to moderate growth. Although reports of layoffs were limited in all industries, they were somewhat more common among manufacturers. Looking ahead, many contacts expected to postpone major hiring and layoff decisions until uncertainty diminished.
Prices
Prices increased across Districts, with seven characterizing price growth as moderate and five characterizing it as modest, mostly similar to the previous report. In all twelve Districts, businesses reported experiencing modest to pronounced input cost pressures related to tariffs, especially for raw materials used in manufacturing and construction. Rising insurance costs represented another widespread source of pricing pressure. Many firms passed on at least a portion of cost increases to consumers through price hikes or surcharges, although some held off raising prices because of customers' growing price sensitivity, resulting in compressed profit margins. Contacts in a wide range of industries expected cost pressures to remain elevated in the coming months, increasing the likelihood that consumer prices will start to rise more rapidly by late summer.
emphasis added


