 RSS Feed
 by Calculated Risk on 7/07/2025 02:38:00 PM
Monday, July 07, 2025
Update: Lumber Prices Up 26% YoY
This is something to watch again. Here is another monthly update on lumber prices.
SPECIAL NOTE: The CME group discontinued the Random Length Lumber Futures contract on May 16, 2023. I switched to a physically-delivered Lumber Futures contract that was started in August 2022. Unfortunately, this impacts long term price comparisons since the new contract was priced about 24% higher than the old random length contract for the period when both contracts were available.
This graph shows CME random length framing futures through August 2022 (blue), and the new physically-delivered Lumber Futures (LBR) contract starting in August 2022 (Red).
On July 7, 2025, LBR was at $611.50 per 1,000 board feet, up 26% from a year ago.
 Click on graph for larger image.
There is somewhat of a seasonal demand for lumber, and lumber prices frequently peak in the first half of the year.
Note that last year prices bottomed in early July at $449.00 per 1,000 board feet, so the year-over-year comparison will be easier in the months ahead.
The pickup in early 2018 was due to the Trump lumber tariffs in 2017. There were huge increases during the pandemic due to a combination of supply constraints and a pickup in housing starts.
July ICE Mortgage Monitor: Home Prices Continue to Cool, Early Signs of Homeowner Risk Emerge
by Calculated Risk on 7/07/2025 10:57:00 AM
Today, in the Real Estate Newsletter: July ICE Mortgage Monitor: Home Prices Continue to Cool, Early Signs of Homeowner Risk Emerge
Brief excerpt:
House Price Growth Continues to Slow
Here is the year-over-year in house prices according to the ICE Home Price Index (HPI). The ICE HPI is a repeat sales index. ICE reports the median price change of the repeat sales. The index was up 1.6% year-over-year in May, down from 2.0% YoY in April. The early look at the June HPI shows a 1.3% YoY increase.
• Mortgage rates in the high 6% range and growing inventory across the country continue to cool home price growthThere is much more in the newsletter.
• Annual price growth eased to 1.6% in May with ICE’s enhanced Home Price Index showing growth slowing further to 1.3% in early June marking the slowest growth rate since mid-2023
• Early June data also shows home prices rose by a modest 0.02% on a seasonally adjusted basis, which is equivalent to a seasonally adjusted annualized rate (SAAR) of +0.3%, suggesting more slowing on the horizon
• Single family prices were up +1.6% from the same time last year, while condo prices were down -1.3%, marking the softest condo market since 2012
• More than half of the top 100 housing markets in the U.S. are seeing condo prices below last year’s levels, with the largest declines in Florida, led by Cape Coral (-12.7%) and North Port (-10.4%)

Housing July 7th Weekly Update: Inventory up 2.7% Week-over-week, Only Down 10% from 2019 Levels
by Calculated Risk on 7/07/2025 08:11:00 AM
Altos reports that active single-family inventory was up 2.7% week-over-week.
Inventory is now up 36.6% from the seasonal bottom in January and is still increasing. Usually, inventory is up about 20% from the seasonal low by this week in the year. So, 2025 is seeing a larger than normal pickup in inventory.
The first graph shows the seasonal pattern for active single-family inventory since 2015.
 Click on graph for larger image.
The red line is for 2025. The black line is for 2019.
Inventory was up 30.8% compared to the same week in 2024 (last week it was up 28.7%), and down 10.0% compared to the same week in 2019 (last week it was down 14.1%).
This is the highest level since November 2019.
It now appears inventory will be close to 2019 levels towards the end of 2025.
 This second inventory graph is courtesy of Altos Research.
As of July 4th, inventory was at 853 thousand (7-day average), compared to 831 thousand the prior week.
Mike Simonsen discusses this data regularly on Youtube
Sunday, July 06, 2025
Sunday Night Futures
by Calculated Risk on 7/06/2025 06:17:00 PM
Weekend:
• Schedule for Week of July 6, 2025
Monday:
• No major economic releases scheduled.
From CNBC: Pre-Market Data and Bloomberg futures S&P 500 are down 22 and DOW futures are down 112 (fair value).
Oil prices were up over the last week with WTI futures at $66.50 per barrel and Brent at $68.30 per barrel. A year ago, WTI was at $84, and Brent was at $89 - so WTI oil prices are down about 21% year-over-year.
Here is a graph from Gasbuddy.com for nationwide gasoline prices. Nationally prices are at $3.09 per gallon. A year ago, prices were at $3.46 per gallon, so gasoline prices are down $0.37 year-over-year.
Trends in Educational Attainment in the U.S. Labor Force
by Calculated Risk on 7/06/2025 09:52:00 AM
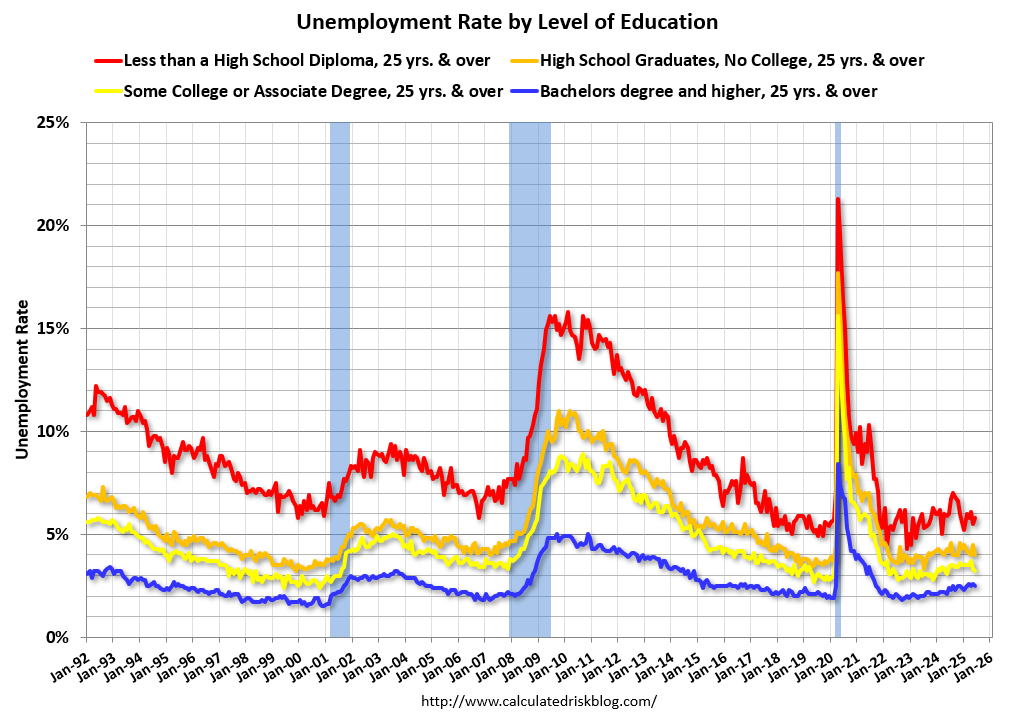
The first graph shows the unemployment rate by four levels of education (all groups are 25 years and older) through June 2025. Note: This is an update to a post from several years ago.
Unfortunately, this data only goes back to 1992 and includes only three recessions (the stock / tech bust in 2001, and the housing bust/financial crisis, and the 2020 pandemic). Clearly education matters with regards to the unemployment rate, with the lowest rate for college graduates at 2.5% in June, and highest for those without a high school degree at 5.8% in June.
All four groups are slightly above pre-pandemic levels now.
 Click on graph for larger image.
Note: This says nothing about the quality of jobs - as an example, a college graduate working at minimum wage would be considered "employed".
This brings up an interesting question: What is the composition of the labor force by educational attainment, and how has that been changing over time?
Here is some data on the U.S. labor force by educational attainment since 1992.
 Currently, almost 67 million people (25 and over) in the U.S. labor force have a bachelor's degree or higher. This is 45% of the labor force, up from 26.2% in 1992.
This is the only category trending up. "Some college", "high school" and "less than high school" have been trending down.
Based on recent trends, probably half the labor force will have at least a bachelor's degree sometime next decade (2030s).
Since workers with bachelor's degrees typically have a lower unemployment rate, rising educational attainment has pushed down, by my rough calculation, the unemployment rate by 0.3% to 0.4% over the last 30 years.
Also, I'd guess more education would mean less labor turnover, and that education is a factor in lower weekly claims over time.
A more educated labor force is a positive for the future.
Saturday, July 05, 2025
Real Estate Newsletter Articles this Week: FHFA Releases National Mortgage Database
by Calculated Risk on 7/05/2025 02:11:00 PM
At the Calculated Risk Real Estate Newsletter this week:
 Click on graph for larger image.
• FHFA’s National Mortgage Database: Outstanding Mortgage Rates, LTV and Credit Scores
• Freddie Mac House Price Index Declined in May; Up 2.2% Year-over-year
• Fannie and Freddie: Single Family Serious Delinquency Rates Decreased in May
• Asking Rents Mostly Unchanged Year-over-year
This is usually published 4 to 6 times a week and provides more in-depth analysis of the housing market.
Schedule for Week of July 6, 2025
by Calculated Risk on 7/05/2025 08:11:00 AM
This will be a very light week for economic data.
No major economic releases scheduled.
6:00 AM ET: NFIB Small Business Optimism Index for June.
7:00 AM ET: The Mortgage Bankers Association (MBA) will release the results for the mortgage purchase applications index.
2:00 PM: FOMC Minutes, Meeting of June 17-18
8:30 AM: The initial weekly unemployment claims report will be released. The consensus is for initial claims to increase to 235 thousand from 233 thousand last week.
No major economic releases scheduled.
Friday, July 04, 2025
Hotels: Occupancy Rate Decreased 0.1% Year-over-year
by Calculated Risk on 7/04/2025 08:21:00 AM
The U.S. hotel industry reported mostly negative year-over-year comparisons, according to CoStar’s latest data through 28 June. ...The following graph shows the seasonal pattern for the hotel occupancy rate using the four-week average.
22-28 June 2025 (percentage change from comparable week in 2024):
• Occupancy: 71.9% (-0.1%)
• Average daily rate (ADR): US$163.30 (0.0%)
• Revenue per available room (RevPAR): US$117.45 (-0.1%)
emphasis added
 Click on graph for larger image.
The red line is for 2025, blue is the median, and dashed light blue is for 2024. Dashed purple is for 2018, the record year for hotel occupancy.
The 4-week average of the occupancy rate is tracking slightly behind both last year and the median rate for the period 2000 through 2024 (Blue).
Note: Y-axis doesn't start at zero to better show the seasonal change.
The 4-week average will increase further during the summer travel season; however, we will likely see some hit to occupancy during the summer months due to less international tourism.
Thursday, July 03, 2025
Q2 GDP Tracking: Moving on Down
by Calculated Risk on 7/03/2025 07:49:00 PM
 Note: Mortgage rates are from MortgageNewsDaily.com and are for top tier scenarios.
There will be additional trade related distortions in Q2 boosting GDP.
From Goldman:
Following this morning’s data, we have lowered our Q2 GDP tracking estimate by 0.6pp to +3.0% (quarter-over-quarter annualized). Our Q2 domestic final sales estimate stands at +0.7%. [July 3rd estimate]And from the Atlanta Fed: GDPNow
emphasis added

The GDPNow model estimate for real GDP growth (seasonally adjusted annual rate) in the second quarter of 2025 is 2.6 percent on July 3, up from 2.5 percent on July 1. After recent releases from the US Census Bureau, the US Bureau of Economic Analysis, the US Bureau of Labor Statistics, and the Institute for Supply Management, the nowcasts of second-quarter real personal consumption expenditures growth and real gross private domestic investment growth increased from 1.5 percent and -11.9 percent, respectively, to 1.6 percent and -11.7 percent, while the nowcast of second-quarter real government expenditures growth increased from 2.0 percent to 2.3 percent. [July 3rd estimate]
AAR: Rail Traffic in June: Intermodal "Stumbles", Carload Growth Continues
by Calculated Risk on 7/03/2025 03:47:00 PM
From the Association of American Railroads (AAR) AAR Data Center. Graph and excerpts reprinted with permission.
In recent months the U.S. economy has defied easy characterization, caught between signals of underlying strength and uncertainty regarding the road ahead. Rail freight volumes have followed that lead, reflecting a mix of cautious optimism and lingering hesitation across key sectors. The uncertainty characterizing both the economy and freight markets is likely to continue because key drivers of economic momentum— including the labor market, consumer spending, inflation levels, interest rates, and economic policies across the globe—remain fluid.
emphasis added
 On intermodal:
 U.S. rail intermodal originations fell 2.9% (31,000 containers and trailers) in June 2025 from June 2024, their first year-over-year decline in 22 months. June’s decline comes amid broader uncertainties impacting global supply chains that have tempered international shipments. In June 2025, U.S. rail intermodal volume averaged 260,834 units per week, below the 2016-2005 average for June of 263,991.
Meanwhile, total U.S. rail carloads (excluding intermodal) rose 2.1% (nearly 19,000 carloads) in June 2025 over June 2024, their fourth straight year-over-year increase— the first time that’s happened since late 2021. In June, 10 of the 20 carload categories tracked by the AAR had year over-year gains. Total U.S. rail carloads averaged 226,259 per week in June 2025, the most for June since 2021. In the 66 months since January 2020, only 14 months had a higher weekly average than June 2025 did.


