 RSS Feed
 by Calculated Risk on 6/21/2025 02:11:00 PM
Saturday, June 21, 2025
Real Estate Newsletter Articles this Week: Housing Starts Decreased to 1.256 million SAAR
At the Calculated Risk Real Estate Newsletter this week:
 Click on graph for larger image.
• Housing Starts Decreased to 1.256 million Annual Rate in May
• California Home Sales "Sputter" in May; 4th Look at Local Markets
• Housing Market Index and Single Family Starts
• 3rd Look at Local Housing Markets in May
This is usually published 4 to 6 times a week and provides more in-depth analysis of the housing market.
Schedule for Week of June 22, 2025
by Calculated Risk on 6/21/2025 08:11:00 AM
The key reports this week are May New and Existing Home sales, the third estimate of Q1 GDP, Personal Income and Outlays for May and the April Case-Shiller house price index.
For manufacturing, the June Richmond and Kansas City Fed manufacturing surveys will be released.
Fed Chair Powell testifies on the Semiannual Monetary Policy Report to Congress.
 10:00 AM: Existing Home Sales for May from the National Association of Realtors (NAR). The consensus is for 3.95 million SAAR, down from 4.00 million in April.
The graph shows existing home sales from 1994 through the report last month.
Housing economist Tom Lawler expects the NAR to report sales of 4.03 million SAAR.
 9:00 AM: S&P/Case-Shiller House Price Index for April.
This graph shows the year-over-year change in the seasonally adjusted National Index, Composite 10 and Composite 20 indexes through the most recent report (the Composite 20 was started in January 2000).
The National index was up 3.4% year-over-year in March.
9:00 AM: FHFA House Price Index for April. This was originally a GSE only repeat sales, however there is also an expanded index.
10:00 AM: Richmond Fed Survey of Manufacturing Activity for June.
10:00 AM: State Employment and Unemployment (Monthly) for May 2024.
10:00 AM: Testimony, Fed Chair Jerome Powell, Semiannual Monetary Policy Report to Congress, Before the U.S. House Financial Services Committee
7:00 AM ET: The Mortgage Bankers Association (MBA) will release the results for the mortgage purchase applications index.
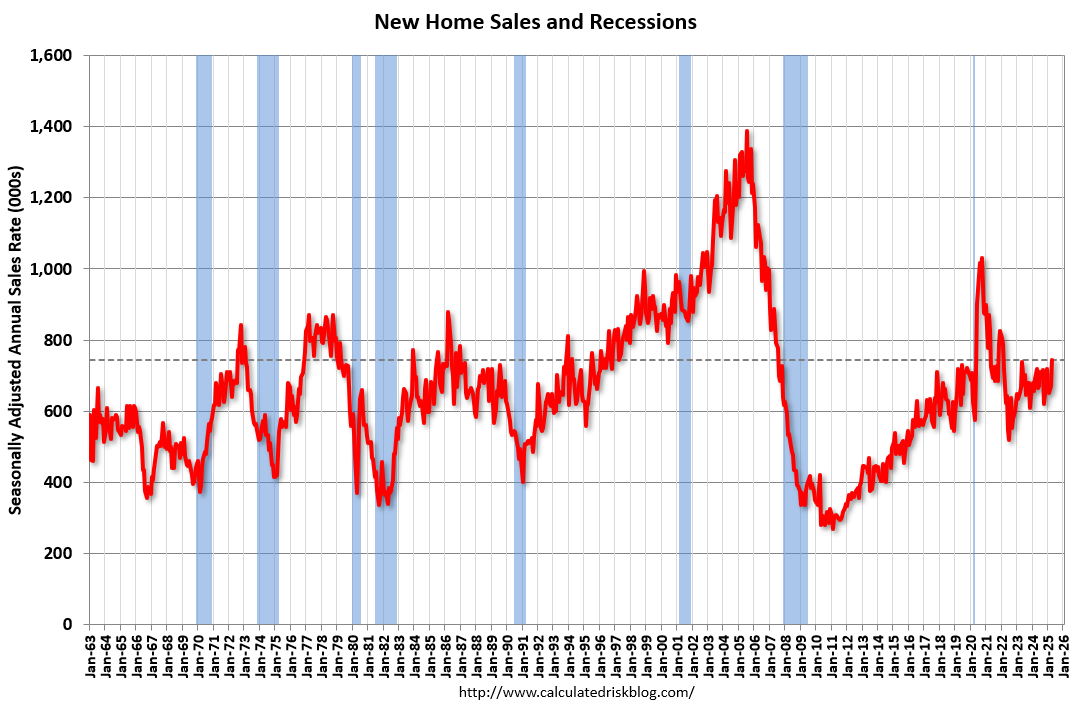 10:00 AM: New Home Sales for May from the Census Bureau.
 This graph shows New Home Sales since 1963. The dashed line is the sales rate for last month.
The consensus is for 710 thousand SAAR, down from 743 thousand in April.
10:00 AM: Testimony, Fed Chair Jerome Powell, Semiannual Monetary Policy Report to Congress, Before the U.S. Senate Committee on Banking, Housing, and Urban Affairs
8:30 AM: The initial weekly unemployment claims report will be released. The consensus is for initial claims to increase to 247 thousand from 245 thousand last week.
8:30 AM: Gross Domestic Product, 1st quarter 2024 (Third estimate). The consensus is that real GDP decreased 0.2% annualized in Q1, unchanged from the second estimate of a 0.2% decrease.
8:30 AM: Durable Goods Orders for May from the Census Bureau. The consensus is for a 4.5% increase in durable goods orders.
8:30 AM ET: Chicago Fed National Activity Index for May. This is a composite index of other data.
10:00 AM: Pending Home Sales Index for May. The consensus is for a 0.1% increase in this index.
11:00 AM: the Kansas City Fed manufacturing survey for June.
During the Day: Census Bureau releases the Vintage 2024 Population Estimates
8:30 AM ET: Personal Income and Outlays, May 2024. The consensus is for a 0.4% increase in personal income, and for a 0.3% increase in personal spending. And for the Core PCE price index to increase 0.1%. PCE prices are expected to be up 2.2% YoY, and core PCE prices up 2.5% YoY.
10:00 AM: University of Michigan's Consumer sentiment index (Final for June).
4:30 PM: Federal Reserve Board announces results from its annual bank stress test
Friday, June 20, 2025
June 20th COVID Update: Weekly COVID Deaths at New Pandemic Low
by Calculated Risk on 6/20/2025 07:11:00 PM
 Note: Mortgage rates are from MortgageNewsDaily.com and are for top tier scenarios.
This will be the last weekly COVID update for now, although I'll start posting again if COVID increases significantly.
For deaths, I'm currently using 4 weeks ago for "now", since the most recent three weeks will be revised significantly.
Note: "Effective May 1, 2024, hospitals are no longer required to report COVID-19 hospital admissions, hospital capacity, or hospital occupancy data." So, I'm no longer tracking hospitalizations.
| COVID Metrics | ||||
|---|---|---|---|---|
| Now | Week Ago | Goal | ||
| Deaths per Week | 181✅ | 211 | ≤3501 | |
| 1my goals to stop weekly posts. 🚩 Increasing number weekly for Deaths. ✅ Goal met. | ||||
 Click on graph for larger image.
This graph shows the weekly (columns) number of deaths reported since Jan 2023.
Although weekly deaths met the original goal to stop posting in June 2024 (previous pandemic low of 314 deaths), I continued to post since COVID deaths increased last summer.
 This appears to be a leading indicator for COVID hospitalizations and deaths. This is close to the lows of May 2024.
Nationally COVID in wastewater is "Low".
Q2 GDP Tracking: Wide Range
by Calculated Risk on 6/20/2025 11:45:00 AM
There will be some trade related distortions in Q2.
From BofA:
Overall, 2Q GDP tracking is down from 2.7% q/q saar to 2.6%. [June 17th estimate]From Goldman:
emphasis added
We lowered our Q2 GDP tracking estimate by 0.1pp to +4.1% (quarter-over-quarter annualized) and our Q2 domestic final sales estimate by the same amount to +0.1%. [June 18th estimate]And from the Atlanta Fed: GDPNow

The GDPNow model estimate for real GDP growth (seasonally adjusted annual rate) in the second quarter of 2025 is 3.4 percent on June 18, down from 3.5 percent on June 17. [June 18th estimate]
California Home Sales "Sputter" in May; 4th Look at Local Markets
by Calculated Risk on 6/20/2025 08:44:00 AM
Today, in the Calculated Risk Real Estate Newsletter: California Home Sales "Sputter" in May; 4th Look at Local Markets
A brief excerpt:
From the California Association of Realtors® (C.A.R.): California housing market sputters for third straight month in May as home sales and prices pull back, C.A.R. reportsThere is much more in the article.May’s sales pace fell 5.1 percent from the 267,710 homes sold in April and was down 4.0 percent from a year ago, when 264,850 homes were sold on an annualized basis. May’s sales level was the lowest in four months. The year-over-year decline was the largest since December 2023 ...In May, sales in these markets were down 3.7% YoY. Last month, in April, these same markets were down 3.4% year-over-year Not Seasonally Adjusted (NSA).
Important: There were fewer working days in May 2025 (21) as in May 2024 (22). So, the year-over-year change in the headline SA data will be higher than for the NSA data.
...
Several local markets - like Illinois, Miami, New Jersey and New York - will report after the NAR release.

Thursday, June 19, 2025
Friday: Philly Fed Mfg
by Calculated Risk on 6/19/2025 08:11:00 PM
 Note: Mortgage rates are from MortgageNewsDaily.com and are for top tier scenarios.
Friday:
• At 8:30 AM ET, the Philly Fed manufacturing survey for June. The consensus is for a reading of 0.0, up from -4.0 last month.
TSA: Airline Travel Down Slightly YoY
by Calculated Risk on 6/19/2025 04:03:00 PM
Here are the daily travel numbers from the TSA.
This data is as of June 17, 2025.
 Click on graph for larger image.
This data shows the 7-day average of daily total traveler throughput from the TSA for the last 6 years.
Air travel is essentially unchanged YoY (down about 1.1% YoY).
The red line is the seven-day average for 2025. Air travel is down slightly from last year.
The red line is the seven-day average for 2025. Air travel is down slightly from last year.
Realtor.com Reports Most Active "For Sale" Inventory since December 2019
by Calculated Risk on 6/19/2025 10:57:00 AM
What this means: On a weekly basis, Realtor.com reports the year-over-year change in active inventory and new listings. On a monthly basis, they report total inventory. For May, Realtor.com reported inventory was up 31.5% YoY, but still down 14.4% compared to the 2017 to 2019 same month levels.
Here is their weekly report: Weekly Housing Trends: Latest as of June 14
• Active inventory climbed 28.1% year over year
The number of homes actively for sale remains on a strong upward trajectory, now 28.1% higher than this time last year. This represents the 84th consecutive week of annual gains in inventory. There were more than 1 million homes for sale again last week, marking the seventh week in a row over the threshold and the highest inventory level since December 2019.
• New listings—a measure of sellers putting homes up for sale—rose 5.7% year over year
New listings rose again last week on an annual basis, up 5.7% compared with the same period last year, a slightly faster growth compared with the previous two weeks.
• The median list price was unchanged year over year
The median list price was flat (0% change) year over year this week and is down 0.4% year to date. The median list price per square foot—which adjusts for changes in home size—rose 0.7% year over year.
Update: The Art of the Soft Landing
by Calculated Risk on 6/19/2025 08:13:00 AM
A year ago I wrote: The Art of the Soft Landing
A few excerpts and an updated graph ...
The "Art of the Soft Landing" requires that the Fed reduce rates quick enough to keep economic growth positive, and slow enough not to reignite inflation. My view is a soft landing is achieved if growth stays positive, inflation returns to target, and the yield curve flattens or reverts to normal (long yields higher than short yields).
The Fed lowered rates and GDP growth was solid in 2024, and although GDP growth was slightly negative in Q1 2025, this was due to trade related distortions and all indications are GDP will be positive in Q2.
Inflation hasn't quite returned to target with PCE core inflation at 2.5% YoY in April. However, inflation appeared to be on the way to the Fed's 2% target until the trade war started.
 And here is an updated graph of 10-Year Treasury Constant Maturity Minus 2-Year Treasury Constant Maturity from FRED for the last 5 years.
The yield curve is no longer inverted.
With the significant changes to policy, the Fed didn't completely meet my definition of a "soft landing", but it was close - and I think they deserve credit.
Wednesday, June 18, 2025
Thursday: Juneteenth Holiday
by Calculated Risk on 6/18/2025 09:09:00 PM
Note: Mortgage rates are from MortgageNewsDaily.com and are for top tier scenarios.
Thursday:
• All US markets will be closed in observance of Juneteenth National Independence Day


