 RSS Feed
 by Calculated Risk on 5/24/2025 08:11:00 AM
Saturday, May 24, 2025
Schedule for Week of May 25, 2025
The key reports this week are the second estimate of Q1 GDP, March Case-Shiller house prices, and Personal Income and Outlays for April.
For manufacturing, the May Richmond and Dallas Fed manufacturing surveys will be released.
All US markets will be closed in observance of Memorial Day.
8:30 AM: Durable Goods Orders for April from the Census Bureau. The consensus is for a 7.8% decrease in durable goods orders.
 9:00 AM: S&P/Case-Shiller House Price Index for March. The consensus is for the Case-Shiller 20-City Composite Index to increase 4.5% YoY, unchanged from 4.5% YoY in February.
This graph shows the year-over-year change in the seasonally adjusted National Index, Composite 10 and Composite 20 indexes through the most recent report (the Composite 20 was started in January 2000).
9:00 AM: FHFA House Price Index for March. This was originally a GSE only repeat sales, however there is also an expanded index.
10:00 AM: Dallas Fed Survey of Manufacturing Activity for May.
7:00 AM ET: The Mortgage Bankers Association (MBA) will release the results for the mortgage purchase applications index.
10:00 AM: Richmond Fed Survey of Manufacturing Activity for May.
2:00 PM: FOMC Minutes, Minutes Meeting of May 6-7, 2025
8:30 AM: The initial weekly unemployment claims report will be released. The consensus is for initial claims of 225 thousand, down from 227 thousand last week.
8:30 AM: Gross Domestic Product, 1st quarter 2025 (Second estimate). The consensus is that real GDP decreased 0.3% annualized in Q1, unchanged from the advance estimate of -0.3%.
10:00 AM: Pending Home Sales Index for April. The consensus is for a 0.4% decrease in the index.
8:30 AM ET: Personal Income and Outlays, April 2025. The consensus is for a 0.3% increase in personal income, and for a 0.2% increase in personal spending. And for the Core PCE price index to increase 0.1%. PCE prices are expected to be up 2.2% YoY, and core PCE prices up 2.5% YoY.
9:45 AM: Chicago Purchasing Managers Index for May.
10:00 AM: University of Michigan's Consumer sentiment index (Final for May). The consensus is for a reading of 50.8.
Friday, May 23, 2025
May 23rd COVID Update: Weekly COVID Deaths at New Pandemic Low
by Calculated Risk on 5/23/2025 07:05:00 PM
 Note: Mortgage rates are from MortgageNewsDaily.com and are for top tier scenarios.
For deaths, I'm currently using 4 weeks ago for "now", since the most recent three weeks will be revised significantly.
Note: "Effective May 1, 2024, hospitals are no longer required to report COVID-19 hospital admissions, hospital capacity, or hospital occupancy data." So, I'm no longer tracking hospitalizations.
| COVID Metrics | ||||
|---|---|---|---|---|
| Now | Week Ago | Goal | ||
| Deaths per Week | 306✅ | 368 | ≤3501 | |
| 1my goals to stop weekly posts. 🚩 Increasing number weekly for Deaths. ✅ Goal met. | ||||
 Click on graph for larger image.
This graph shows the weekly (columns) number of deaths reported since Jan 2023.
Although weekly deaths met the original goal to stop posting in June 2024 (previous pandemic low of 314 deaths), I've continued to post since deaths were above the goal again - and I'll continue to post until weekly deaths are below the goal for several weeks.
 This appears to be a leading indicator for COVID hospitalizations and deaths. This is moving towards the lows last May.
Nationally COVID in wastewater is "Low".
Q2 GDP Tracking: Low 2%
by Calculated Risk on 5/23/2025 02:00:00 PM
From BofA:
Since our last weekly publication, our 2Q and 1Q GDP tracking are down two-tenths each to +2.0% q/q saar and -0.5% q/q saar, respectively. [May 23rd estimate]From Goldman:
emphasis added
We left our Q2 GDP tracking estimate unchanged at +2.1% (quarter-over-quarter annualized) and our Q2 domestic final sales forecast unchanged at 0%. We left our past-quarter tracking estimate unchanged at -0.5%. [May 23rd estimate]And from the Atlanta Fed: GDPNow

The GDPNow model estimate for real GDP growth (seasonally adjusted annual rate) in the second quarter of 2025 is 2.4 percent on May 16, down from 2.5 percent on May 15. After this morning’s housing starts report from the US Census Bureau and the release of import and export price indexes from the US Bureau of Labor Statistics, the nowcast of second-quarter real residential fixed investment growth decreased from 0.4 percent to -3.0 percent. [May 16th estimate] (Next update on May 27th)
Newsletter: New Home Sales Increase to 743,000 Annual Rate in April
by Calculated Risk on 5/23/2025 10:59:00 AM
Today, in the Calculated Risk Real Estate Newsletter: New Home Sales Increase to 743,000 Annual Rate in April
Brief excerpt:
The Census Bureau reported New Home Sales in April were at a seasonally adjusted annual rate (SAAR) of 743 thousand. The previous three months were revised down significantly, combined.There is much more in the article.
...
The next graph shows new home sales for 2024 and 2025 by month (Seasonally Adjusted Annual Rate). Sales in April 2025 were up 3.3% from April 2024.
New home sales, seasonally adjusted, have increased year-over-year in 19 of the last 25 months. This is essentially the opposite of what happened with existing home sales that had been down year-over-year for 40 of the last 44 months.

New Home Sales Increase to 743,000 Annual Rate in April
by Calculated Risk on 5/23/2025 10:00:00 AM
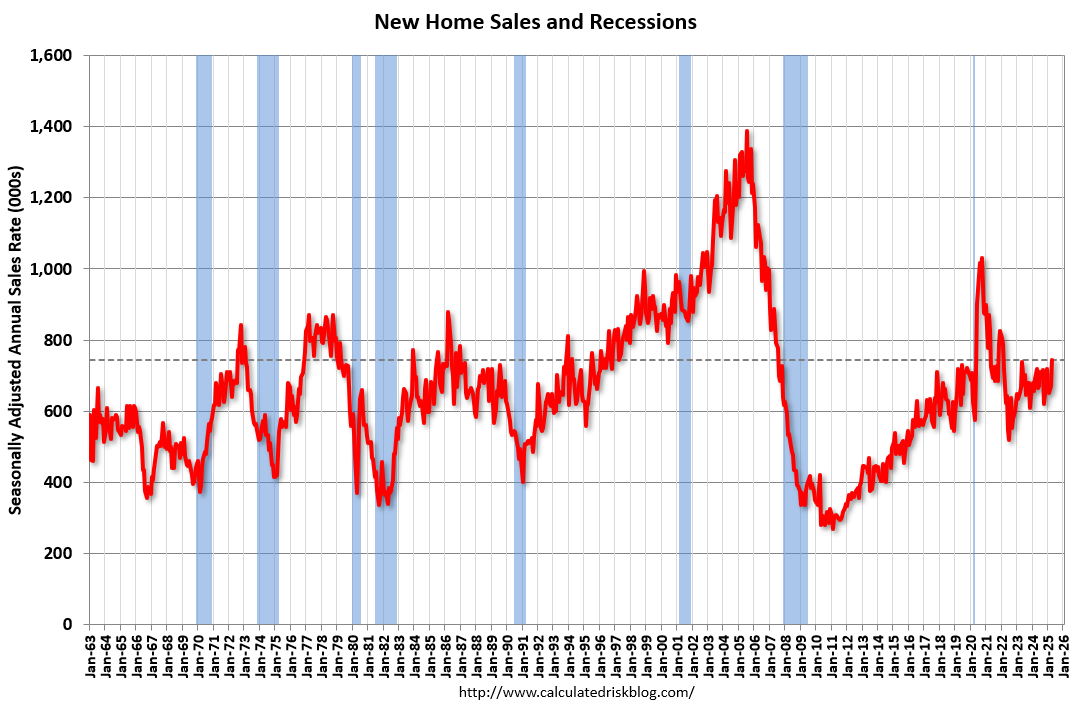
The Census Bureau reports New Home Sales in April were at a seasonally adjusted annual rate (SAAR) of 743 thousand.
The previous three months were revised down significantly, combined.
Sales of new single-family houses in April 2025 were at a seasonally-adjusted annual rate of 743,000, according to estimates released jointly today by the U.S. Census Bureau and the Department of Housing and Urban Development. This is 10.9 percent above the March 2025 rate of 670,000, and is 3.3 percent above the April 2024 rate of 719,000.
emphasis added
 Click on graph for larger image.
The first graph shows New Home Sales vs. recessions since 1963. The dashed line is the current sales rate.
New home sales were above pre-pandemic levels.
The second graph shows New Home Months of Supply.
 The months of supply decreased in April to 8.1 months from 9.1 months in March.
 The all-time record high was 12.2 months of supply in January 2009. The all-time record low was 3.3 months in August 2020.
This is well above the top of the normal range (about 4 to 6 months of supply is normal).
"The seasonally-adjusted estimate of new houses for sale at the end of April 2025 was 504,000. This is 0.6 percent below the March 2025 estimate of 507,000, and is 8.6 percent above the April 2024 estimate of 464,000.Sales were above expectations of 700 thousand SAAR, however sales for the three previous months were revised down significantly, combined. I'll have more later today.
This represents a supply of 8.1 months at the current sales rate. The months' supply is 11.0 percent below the March 2025 estimate of 9.1 months, and is 5.2 percent above the April 2024 estimate of 7.7 months."
ICE First Look at April Mortgage Performance: "Foreclosure Activity Edges Higher Following Recent Record Lows"
by Calculated Risk on 5/23/2025 08:09:00 AM
From Intercontinental Exchange: ICE First Look at Mortgage Performance: Foreclosure Activity Edges Higher Following Recent Record Lows
Intercontinental Exchange, Inc. (NYSE:ICE) ... today released its April 2025 First Look, which shows U.S. Department of Veterans Affairs (VA) mortgages progressing through the foreclosure pipeline following the recent moratorium expiration.
The ICE First Look reports on month-end delinquency, foreclosure and prepayment statistics sourced from its loan-level database, which covers a majority of the U.S. mortgage market. Key takeaways from this month’s findings include:
• The national delinquency rate ticked up 1 basis point (bp) to 3.22% in April and is up a modest 13 bps (4.1%) from the same time last year. Still, delinquencies remain below pre-pandemic levels.
• Serious delinquencies – loans 90+ days past due but not in foreclosure – improved seasonally but rose 14% from April 2024 marking the sixth consecutive month of 10%+ annual increases.
• While foreclosure activity remains muted, foreclosure starts (+13%), sales (+9%), and active inventory (+4%) all rose on an annual basis for the second consecutive month.
• April’s 6,500 foreclosure sales marked the largest single-month volume in 15 months, with VA sales, which account for the bulk of the recent rise, hitting their highest level since 2019.
• Prepayment activity, measured in single month mortality, jumped to 0.71%, the highest level since October. This rise was driven by stronger home sale and refinance-related prepayments, which grew +19.0% over the previous month and +34.9% over the previous year.
emphasis added
 Click on graph for larger image.
Here is a table from ICE.
Thursday, May 22, 2025
Friday: New Home Sales
by Calculated Risk on 5/22/2025 08:17:00 PM
 Note: Mortgage rates are from MortgageNewsDaily.com and are for top tier scenarios.
Friday:
• At 10:00 AM ET, New Home Sales for April from the Census Bureau. The consensus is for 700 thousand SAAR, down from 724 thousand SAAR in March.
Realtor.com Reports Most Actively "For Sale" Inventory since 2019
by Calculated Risk on 5/22/2025 04:59:00 PM
What this means: On a weekly basis, Realtor.com reports the year-over-year change in active inventory and new listings. On a monthly basis, they report total inventory. For May, Realtor.com reported inventory was up 30.6% YoY, but still down 16.3% compared to the 2017 to 2019 same month levels.
Now - on a weekly basis - inventory is up 29.7% YoY.
Realtor.com has monthly and weekly data on the existing home market. Here is their weekly report: Weekly Housing Trends View—Data for Week Ending May 17, 2025 Here is a graph of the year-over-year change in inventory according to realtor.com.
Inventory was up year-over-year for the 80th consecutive week.
Realtor.com has monthly and weekly data on the existing home market. Here is their weekly report: Weekly Housing Trends View—Data for Week Ending May 17, 2025
• Active inventory climbed 29.7% year-over-year
The number of homes actively for sale remains on a strong upward trajectory, now 29.7% higher than this time last year. This represents the 80th consecutive week of annual gains in inventory. There were more than 1 million homes for sale last week, the highest inventory level since December 2019.
• New listings—a measure of sellers putting homes up for sale—rising 8.2% year-over-year
New listings rose again last week, up 8.2% compared to the same period last year.
• The median list price falls more than 1%
After nine consecutive weeks of flat or rising prices, the national median listing price fell year-over-year last week. Ongoing affordability challenges, along with growing concerns about personal finances and job security, continue to pose significant hurdles for many buyers. Nearly four in five home shoppers believe it’s a bad time to buy, which is dampening demand.
 Here is a graph of the year-over-year change in inventory according to realtor.com.
 Inventory was up year-over-year for the 80th consecutive week.
New listings were solid.
Median list prices declined year-over-year.
Hotels: Occupancy Rate Decreased 0.4% Year-over-year
by Calculated Risk on 5/22/2025 02:01:00 PM
The U.S. hotel industry reported mixed year-over-year comparisons, according to CoStar’s latest data through 17 May. ...The following graph shows the seasonal pattern for the hotel occupancy rate using the four-week average.
11-17 May 2025 (percentage change from comparable week in 2024):
• Occupancy: 67.2% (-0.4%)
• Average daily rate (ADR): US$166.31 (+1.3%)
• Revenue per available room (RevPAR): US$111.80 (+0.9%)
emphasis added
 Click on graph for larger image.
The red line is for 2025, blue is the median, and dashed light blue is for 2024. Dashed purple is for 2018, the record year for hotel occupancy.
The 4-week average of the occupancy rate is tracking slightly below last year and slightly above the median rate for the period 2000 through 2024 (Blue).
Note: Y-axis doesn't start at zero to better show the seasonal change.
The 4-week average will mostly move sideways for a few more weeks until the summer travel season. We will likely see a hit to occupancy during the summer months due to less international tourism.
Newsletter: NAR: Existing-Home Sales Decreased to 4.00 million SAAR in April; Down 2.0% YoY
by Calculated Risk on 5/22/2025 10:52:00 AM
Today, in the CalculatedRisk Real Estate Newsletter: NAR: Existing-Home Sales Decreased to 4.00 million SAAR in April; Down 2.0% YoY
Excerpt:
Sales in April (4.00 million SAAR) were down 0.5% from the previous month and were 2.0% below the April 2024 sales rate. This was the 3rd consecutive month with a year-over-year decline in sales.There is much more in the article.
...
Sales Year-over-Year and Not Seasonally Adjusted (NSA)
The fourth graph shows existing home sales by month for 2024 and 2025.
Sales decreased 2.0% year-over-year compared to April 2024.
...
On an NSA basis for the month of April, this was at the low for housing bust for the month of April that happened in April 2009. Year-to-date, sales are down 2.4% NSA.


