 RSS Feed
 by Calculated Risk on 5/19/2025 07:03:00 PM
Monday, May 19, 2025
"Mortgage Rates Briefly Over 7%"
 From Matthew Graham at Mortgage News Daily: Mortgage Rates Briefly Over 7% Before Mid-Day Improvement
Mortgage rates jumped sharply over the weekend as financial markets reacted to Moody's credit rating downgrade of the U.S. News of the downgrade broke with only minutes left in Friday's market/business day, so most of the response played out when global markets opened again late last night.Tuesday:
...
Most mortgage lenders are deciding on rates for the day in the 9am-10am ET time frame. Because this was one of the weakest moments for the bond market, mortgage rates were sharply higher at first. The average lender was back over 7% for the 1st time since April 11th, and only the 2nd time in 3 months.
No sooner were these rates being published than the underlying market began moving back in the other direction. Mortgage lenders prefer to only set rates once per day, but will make mid-day updates when things change enough. Today's reversal was more than sufficient to prompt a re-price. After that, the average top tier 30yr fixed rate moved just barely back below 7.0%--still higher than Friday, but much more in line with last week's range. [30 year fixed 6.99%]
emphasis added
• No major economic releases scheduled.
LA Ports: April Inbound Traffic Up YoY, Outbound Down
by Calculated Risk on 5/19/2025 01:55:00 PM
There were still a large number of ships unloading in April. We should see a sharp drop in May traffic due to the tariffs.
The following graphs are for inbound and outbound traffic at the ports of Los Angeles and Long Beach in TEUs (TEUs: 20-foot equivalent units or 20-foot-long cargo container).
To remove the strong seasonal component for inbound traffic, the first graph shows the rolling 12-month average.
 Click on graph for larger image.
On a rolling 12-month basis, inbound traffic increased 0.7% in April compared to the rolling 12 months ending the previous month. Outbound traffic decreased 0.3% compared to the rolling 12 months ending the previous month.
The 2nd graph is the monthly data (with a strong seasonal pattern for imports).
 Usually imports peak in the July to October period as retailers import goods for the Christmas holiday and then decline sharply and bottom in the Winter depending on the timing of the Chinese New Year.
 Usually imports peak in the July to October period as retailers import goods for the Christmas holiday and then decline sharply and bottom in the Winter depending on the timing of the Chinese New Year.
 Imports were up 10% YoY in April and exports were down 4% YoY.
Recently importers rushed to beat the tariffs. And port traffic will likely slow sharply in coming months.
"How do you grade the Spring housing market?"
by Calculated Risk on 5/19/2025 10:51:00 AM
Today, in the Calculated Risk Real Estate Newsletter: "How do you grade the Spring housing market?"
A brief excerpt:
Last week, Housing Wire Editor in Chief Sarah Wheeler asked Lead Analyst Logan Mohtashami the above question: "How do you grade the Spring housing market?"There is much more in the article.
My friend Logan replied: “Generally, just for how I look at housing, this kind of gets an A ...”
I almost fell out of my chair!
Housing May 19th Weekly Update: Inventory up 1.5% Week-over-week, Up 32.7% Year-over-year
by Calculated Risk on 5/19/2025 08:11:00 AM
Altos reports that active single-family inventory was up 1.5% week-over-week.
Inventory is now up 22.9% from the seasonal bottom in January and is increasing.
Usually, inventory is up about 13% from the seasonal low by this week in the year. So, 2025 is seeing a larger than normal pickup in inventory.
The first graph shows the seasonal pattern for active single-family inventory since 2015.
 Click on graph for larger image.
The red line is for 2025. The black line is for 2019.
Inventory was up 32.7% compared to the same week in 2024 (last week it was up 32.9%), and down 15.6% compared to the same week in 2019 (last week it was down 15.7%).
This is the highest level since 2019.
It now appears inventory will be close to 2019 levels towards the end of 2025.
 This second inventory graph is courtesy of Altos Research.
As of May 16th, inventory was at 767 thousand (7-day average), compared to 756 thousand the prior week.
Mike Simonsen discusses this data regularly on Youtube
Sunday, May 18, 2025
Sunday Night Futures
by Calculated Risk on 5/18/2025 06:16:00 PM
Weekend:
• Schedule for Week of May 18, 2025
Monday:
• No major economic releases scheduled.
From CNBC: Pre-Market Data and Bloomberg futures S&P 500 are down 43 and DOW futures are down 267 (fair value).
Oil prices were up over the last week with WTI futures at $62.49 per barrel and Brent at $65.41 per barrel. A year ago, WTI was at $82, and Brent was at $82 - so WTI oil prices are down about 24% year-over-year.
Here is a graph from Gasbuddy.com for nationwide gasoline prices. Nationally prices are at $3.14 per gallon. A year ago, prices were at $3.57 per gallon, so gasoline prices are down $0.43 year-over-year.
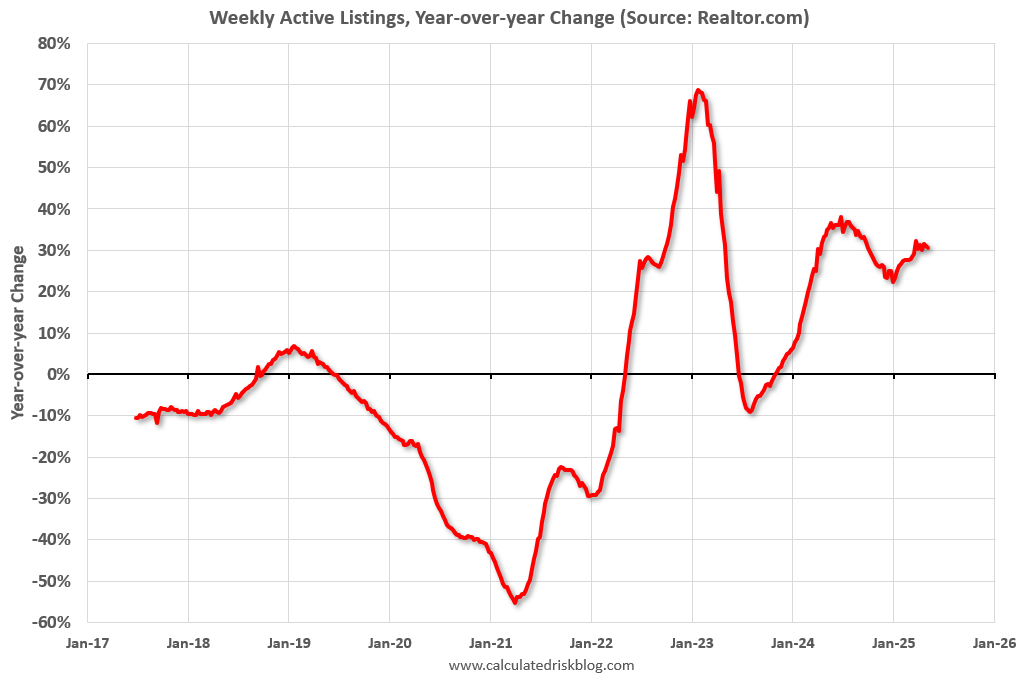
Realtor.com Reports Most Actively "For Sale" Inventory since 2019
by Calculated Risk on 5/18/2025 08:12:00 AM
What this means: On a weekly basis, Realtor.com reports the year-over-year change in active inventory and new listings. On a monthly basis, they report total inventory. For May, Realtor.com reported inventory was up 30.6% YoY, but still down 16.3% compared to the 2017 to 2019 same month levels.
Now - on a weekly basis - inventory is up 30.6% YoY.
Realtor.com has monthly and weekly data on the existing home market. Here is their weekly report: Weekly Housing Trends View—Data for Week Ending May 10, 2025 Here is a graph of the year-over-year change in inventory according to realtor.com.
Inventory was up year-over-year for the 79th consecutive week.
Realtor.com has monthly and weekly data on the existing home market. Here is their weekly report: Weekly Housing Trends View—Data for Week Ending May 10, 2025
• Active inventory climbed 30.6% year over year
The number of homes actively for sale remains on a strong upward trajectory, now 30.6% higher than this time last year. This represents the 79th consecutive week of annual gains in inventory. There were more than 1 million homes for sale last week, the highest inventory level since December 2019.
• New listings—a measure of sellers putting homes up for sale—rose 11.2% year over year
New listings rose again last week, up 11.2% compared with the same period last year. The momentum that began earlier this spring remains strong, signaling a vibrant market as we head into late spring and early summer.
• The median list price remained flat
After three consecutive weeks of gains, the national median list price remained flat year over year last week. Ongoing affordability challenges, along with growing concerns about personal finances and job security, continue to pose significant hurdles for many buyers. Nearly 4 in 5 home shoppers believe it’s a bad time to buy, which is dampening demand.
 Here is a graph of the year-over-year change in inventory according to realtor.com.
 Inventory was up year-over-year for the 79th consecutive week.
New listings were solid.
Median list prices were unchanged year-over-year.
Saturday, May 17, 2025
Real Estate Newsletter Articles this Week: Housing Starts Increased to 1.361 million Annual Rate in April
by Calculated Risk on 5/17/2025 02:11:00 PM
At the Calculated Risk Real Estate Newsletter this week:
 Click on graph for larger image.
• Housing Starts Increased to 1.361 million Annual Rate in April
• MBA: Mortgage Delinquencies Increased Slightly in Q1 2025
• Part 2: Current State of the Housing Market; Overview for mid-May 2025
• Lawler: Early Read on Existing Home Sales in April
• 3rd Look at Local Housing Markets in April
• Q1 NY Fed Report: Mortgage Originations by Credit Score, Delinquencies Increase, Foreclosures Increase
• 2nd Look at Local Housing Markets in April
This is usually published 4 to 6 times a week and provides more in-depth analysis of the housing market.
Schedule for Week of May 18, 2025
by Calculated Risk on 5/17/2025 08:11:00 AM
The key reports this week are April New and Existing Home Sales.
No major economic releases scheduled.
No major economic releases scheduled.
7:00 AM ET: The Mortgage Bankers Association (MBA) will release the results for the mortgage purchase applications index.
10:00 AM: State Employment and Unemployment (Monthly) for April 2025
During the day: The AIA's Architecture Billings Index for April (a leading indicator for commercial real estate).
8:30 AM: The initial weekly unemployment claims report will be released. The consensus is for initial claims of 232 thousand, up from 229 thousand last week.
8:30 AM ET: Chicago Fed National Activity Index for April. This is a composite index of other data.
 10:00 AM: Existing Home Sales for April from the National Association of Realtors (NAR). The consensus is for 4.15 million SAAR, up from 4.02 million.
The graph shows existing home sales from 1994 through the report last month.
Housing economist Tom Lawler expects the NAR to report sales of 3.98 million SAAR.
 10:00 AM: New Home Sales for April from the Census Bureau.
 This graph shows New Home Sales since 1963. The dashed line is the sales rate for last month.
The consensus is for 700 thousand SAAR, down from 724 thousand SAAR in March.
Friday, May 16, 2025
May 16th COVID Update: Weekly COVID Deaths Increased Slightly
by Calculated Risk on 5/16/2025 07:03:00 PM
 Note: Mortgage rates are from MortgageNewsDaily.com and are for top tier scenarios.
For deaths, I'm currently using 4 weeks ago for "now", since the most recent three weeks will be revised significantly.
Note: "Effective May 1, 2024, hospitals are no longer required to report COVID-19 hospital admissions, hospital capacity, or hospital occupancy data." So, I'm no longer tracking hospitalizations.
| COVID Metrics | ||||
|---|---|---|---|---|
| Now | Week Ago | Goal | ||
| Deaths per Week | 358🚩 | 346 | ≤3501 | |
| 1my goals to stop weekly posts. 🚩 Increasing number weekly for Deaths. ✅ Goal met. | ||||
 Click on graph for larger image.
This graph shows the weekly (columns) number of deaths reported since Jan 2023.
Although weekly deaths met the original goal to stop posting in June 2023 (low of 314 deaths), I've continued to post since deaths were above the goal again - and I'll continue to post until weekly deaths are once again below the goal for several weeks.
Weekly deaths were steadily decreasing following the winter pickup, however, weekly deaths increased this week.
 This appears to be a leading indicator for COVID hospitalizations and deaths. This is moving towards the lows last May.
Nationally COVID in wastewater is "Low".
Q2 GDP Tracking: Low-to-Mid 2%
by Calculated Risk on 5/16/2025 12:35:00 PM
From BofA:
We initiated our 2Q GDP tracking after the April retail sales print. It moved up two-tenth to 2.2% q/q saar from our official forecast of 2.0% q/q saar. Meanwhile, our 1Q GDP tracking moved up a tenth to -0.3% q/q saar since our last weekly publication [May 16th estimate]From Goldman:
emphasis added
We lowered our Q2 GDP tracking estimate by 0.1pp to +2.1% (quarter-over-quarter annualized) and our Q2 domestic final sales estimate by the same amount to +0.1%. Our past-quarter GDP tracking estimate stands at -0.5%. [May 16th estimate]And from the Atlanta Fed: GDPNow

The GDPNow model estimate for real GDP growth (seasonally adjusted annual rate) in the second quarter of 2025 is 2.4 percent on May 16, down from 2.5 percent on May 15. After this morning’s housing starts report from the US Census Bureau and the release of import and export price indexes from the US Bureau of Labor Statistics, the nowcast of second-quarter real residential fixed investment growth decreased from 0.4 percent to -3.0 percent. [May 1st estimate]


