 RSS Feed
 by Calculated Risk on 5/01/2025 05:08:00 PM
Thursday, May 01, 2025
Light Vehicles Sales "Beat the tariff" at 17.3 million SAAR in April
Wards Auto released their estimate of light vehicle sales for April: Tariff-Induced Buying Pumps U.S. Light-Vehicle Sales for Second Month in April (pay site).
Tariff-related buying lifted sales over the past two months to a seasonally adjusted annual selling rate of 17.6 million, well above the roughly 16.0 million they would have totaled otherwise. There was some indication that the surge was decelerating by the end of the month, probably due to tariff “exuberance” starting to dry up and because of a drain to inventory. There was more strength, in general, in demand for fullsize and luxury-segment trucks than for more affordable vehicles, including cars and small and midsize CUVs and SUVs.
 Click on graph for larger image.
This graph shows light vehicle sales since 2006 from the BEA (blue) and Wards' estimate for April (red).
Sales in April (17.27 million SAAR) were down 2.8% from March, and up 7.7% from April 2024.
Sales in April were above the consensus forecast.
Sales in April were above the consensus forecast.
The second graph shows light vehicle sales since the BEA started keeping data in 1967.

This "beat the tariff" induced surge in buying was the best April since 2021.
April Employment Preview
by Calculated Risk on 5/01/2025 03:05:00 PM
On Friday at 8:30 AM ET, the BLS will release the employment report for April. The consensus is for 130,000 jobs added, and for the unemployment rate to be unchanged at 4.2%. There were 228,000 jobs added in March, and the unemployment rate was at 4.2%.
From Goldman Sachs:
We forecast that payrolls rose 140k in April (vs. consensus +130k) and the unemployment rate was flat at 4.2%. ... Big data indicators suggest slower but still healthy job growth in April. We expect a 15k decline in federal government payrolls and a slower but still positive 15k increase in state and local payrolls. We think April was probably too early to see large negative trade war or policy uncertainty effects on hiring.From BofA:
emphasis added
Apr payrolls are likely to rise by a robust 165k, higher than consensus expectations of 130k. Government job growth is expected to come in at 10k due to the federal hiring freeze/DOGE. Given the muted claims data in the survey week, we do not expect DOGE driven job cuts to be a sizable drag. Immigration restrictions are likely to weigh on payrolls in the coming months but we don’t think they’ll have a substantial impact in Apr. That said, risks are to the downside. We expect the u-rate to remain at 4.2%.• ADP Report: The ADP employment report showed 62,000 private sector jobs were added in April. This was well below consensus forecasts and suggests job gains below consensus expectations, however, in general, ADP hasn't been very useful in forecasting the BLS report.
• ISM Surveys: Note that the ISM indexes are diffusion indexes based on the number of firms hiring (not the number of hires). The ISM® manufacturing employment index 46.5%, up from 44.7% the previous month. This would suggest about 40,000 jobs lost in manufacturing. The ADP report indicated 4,000 manufacturing jobs added in April.
The ISM® services employment index will be released next week.
• Unemployment Claims: The weekly claims report showed about the same initial unemployment claims during the reference week at 216,000 inApril compared to 225,000 in March. This suggests layoffs in April were about the same or a little less as in March.
• Conclusion: Over the last year, employment gains averaged 157 thousand per month - and that was probably the trend prior to policy changes. It still seems early for the government (DOGE) layoffs and tariff related layoffs to impact the employment report. However, my guess is we will start to see the impact of policy uncertainty impacting employment - a little - and I'll take the under for April.
Inflation Adjusted House Prices 0.8% Below 2022 Peak; Price-to-rent index is 7.5% below 2022 peak
by Calculated Risk on 5/01/2025 01:15:00 PM
Today, in the Calculated Risk Real Estate Newsletter: Inflation Adjusted House Prices 0.8% Below 2022 Peak
Excerpt:
It has been over 18 years since the housing bubble peak. In the February Case-Shiller house price index released this week, the seasonally adjusted National Index (SA), was reported as being 79% above the bubble peak in 2006. However, in real terms, the National index (SA) is about 12% above the bubble peak (and historically there has been an upward slope to real house prices). The composite 20, in real terms, is 3% above the bubble peak.There is much more in the article!
People usually graph nominal house prices, but it is also important to look at prices in real terms. As an example, if a house price was $300,000 in January 2010, the price would be $441,000 today adjusted for inflation (47% increase). That is why the second graph below is important - this shows "real" prices.
The third graph shows the price-to-rent ratio, and the fourth graph is the affordability index. The last graph shows the 5-year real return based on the Case-Shiller National Index.
...
The second graph shows the same two indexes in real terms (adjusted for inflation using CPI).
In real terms (using CPI), the National index is 0.8% below the recent peak, and the Composite 20 index is 1.1% below the recent peak in 2022.
Both the real National index and the Comp-20 index increased slightly in February.
It has now been 33 months since the real peak in house prices. Typically, after a sharp increase in prices, it takes a number of years for real prices to reach new highs (see House Prices: 7 Years in Purgatory)

Construction Spending Decreased 0.5% in March
by Calculated Risk on 5/01/2025 10:17:00 AM
From the Census Bureau reported that overall construction spending decreased:
Construction spending during March 2025 was estimated at a seasonally adjusted annual rate of $2,196.1 billion, 0.5 percent below the revised February estimate of $2,206.9 billion. The March figure is 2.8 percent above the March 2024 estimate of $2,135.8 billion.Both private and public spending increased:
emphasis added
Spending on private construction was at a seasonally adjusted annual rate of $1,688.0 billion, 0.6 percent below the revised February estimate of $1,697.7 billion. ...
In March, the estimated seasonally adjusted annual rate of public construction spending was $508.1 billion, 0.2 percent below the revised February estimate of $509.2 billion.
 Click on graph for larger image.
This graph shows private residential and nonresidential construction spending, and public spending, since 1993. Note: nominal dollars, not inflation adjusted.
Private residential (red) spending is 4.4% below the peak in 2022.
Private non-residential (blue) spending is 0.8% below the peak in February 2025.
Public construction spending (orange) is slightly 0.2% the peak the previous month.
 The second graph shows the year-over-year change in construction spending.
On a year-over-year basis, private residential construction spending is up 2.8%. Private non-residential spending is up 1.6% year-over-year. Public spending is up 4.7% year-over-year.
This was below consensus expectations; however, spending for the previous two months was revised up.
ISM® Manufacturing index Decreased to 48.7% in April
by Calculated Risk on 5/01/2025 10:00:00 AM
(Posted with permission). The ISM manufacturing index indicated expansion. The PMI® was at 48.7% in April, down from 49.0% in March. The employment index was at 46.5%, up from 44.7% the previous month, and the new orders index was at 47.2%, up from 45.2%.
From ISM: Manufacturing PMI® at 48.7% April 2025 Manufacturing ISM® Report On Business®
Economic activity in the manufacturing sector contracted in April for the second month in a row, following a two-month expansion preceded by 26 straight months of contraction, say the nation's supply executives in the latest Manufacturing ISM® Report On Business®.This suggests manufacturing contracted in April. This was slightly above the consensus forecast, however new export orders were weak and prices very strong.
The report was issued today by Timothy R. Fiore, CPSM, C.P.M., Chair of the Institute for Supply Management® (ISM®) Manufacturing Business Survey Committee:
“The Manufacturing PMI® registered 48.7 percent in April, 0.3 percentage point lower compared to the 49 percent recorded in March. The overall economy continued in expansion for the 60th month after one month of contraction in April 2020. (A Manufacturing PMI® above 42.3 percent, over a period of time, generally indicates an expansion of the overall economy.) The New Orders Index contracted for the third month in a row following a three-month period of expansion; the figure of 47.2 percent is 2 percentage points higher than the 45.2 percent recorded in March. The April reading of the Production Index (44 percent) is 4.3 percentage points lower than March’s figure of 48.3 percent. The index returned to contraction last month after two months of expansion preceded by eight months of contraction. The Prices Index remained in expansion (or ‘increasing’) territory, registering 69.8 percent, up 0.4 percentage point compared to the reading of 69.4 percent in March. The Backlog of Orders Index registered 43.7 percent, down 0.8 percentage point compared to the 44.5 percent recorded in March. The Employment Index registered 46.5 percent, up 1.8 percentage points from March’s figure of 44.7 percent.
“The Supplier Deliveries Index indicated a continued slowing of deliveries, registering 55.2 percent, 1.7 percentage points higher than the 53.5 percent recorded in March. (Supplier Deliveries is the only ISM® Report On Business® index that is inversed; a reading of above 50 percent indicates slower deliveries, which is typical as the economy improves and customer demand increases.) The Inventories Index registered 50.8 percent, down 2.6 percentage points compared to March’s reading of 53.4 percent. The index indicated expansion for a second consecutive month after six months of contraction.
“The New Export Orders Index reading of 43.1 percent is 6.5 percentage points lower than the reading of 49.6 percent registered in March. The Imports Index dropped into contraction in April, registering 47.1 percent, 3 percentage points lower than March’s reading of 50.1 percent.”
emphasis added
Weekly Initial Unemployment Claims Increase to 241,000
by Calculated Risk on 5/01/2025 08:30:00 AM
The DOL reported:
In the week ending April 26, the advance figure for seasonally adjusted initial claims was 241,000, an increase of 18,000 from the previous week's revised level. The previous week's level was revised up by 1,000 from 222,000 to 223,000. The 4-week moving average was 226,000, an increase of 5,500 from the previous week's revised average. The previous week's average was revised up by 250 from 220,250 to 220,500.The following graph shows the 4-week moving average of weekly claims since 1971.
emphasis added
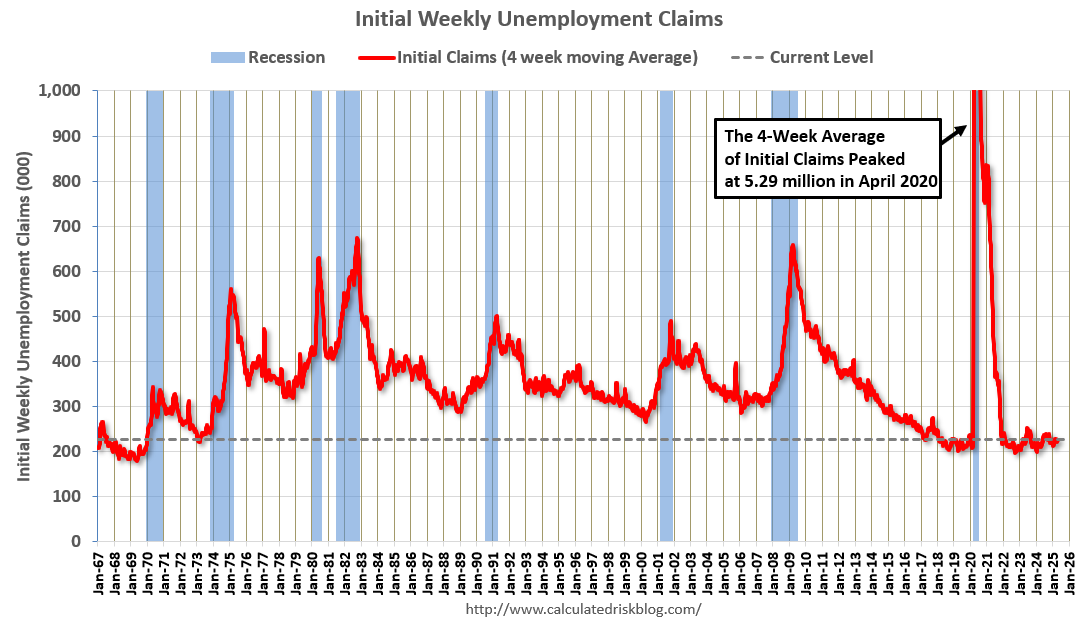 Click on graph for larger image.
The dashed line on the graph is the current 4-week average. The four-week average of weekly unemployment claims increased to 226,000.
The previous week was revised up.
Weekly claims were above the consensus forecast.
Wednesday, April 30, 2025
Thursday: Unemployment Claims, ISM Mfg, Construction Spending, Vehicle Sales
by Calculated Risk on 4/30/2025 07:54:00 PM
 Note: Mortgage rates are from MortgageNewsDaily.com and are for top tier scenarios.
Thursday:
• At 8:30 AM ET, The initial weekly unemployment claims report will be released. The consensus is for initial claims of 218 thousand, down from 222 thousand last week.
• At 10:00 AM ET, ISM Manufacturing Index for April. The consensus is for the ISM to be at 48.1, down from 49.0 in March.
• Also at 10:00 AM, Construction Spending for March. The consensus is for a 0.3% increase in construction spending.
• All day, Light vehicle sales for April. The consensus expectation is for light vehicle sales to be 16.8 million SAAR in April, down from 17.8 million in March (Seasonally Adjusted Annual Rate). The WardsAuto estimate is for sales of 17.4 million SAAR in April.
Freddie Mac House Price Index Mostly Unchanged in March; Up 3.0% Year-over-year
by Calculated Risk on 4/30/2025 12:45:00 PM
Today, in the Calculated Risk Real Estate Newsletter: Freddie Mac House Price Index Mostly Unchanged in March; Up 3.0% Year-over-year
A brief excerpt:
Freddie Mac reported that its “National” Home Price Index (FMHPI) increased 0.01% month-over-month on a seasonally adjusted (SA) basis in March. On a year-over-year basis, the National FMHPI was up 3.0% in March, down from up 3.4% YoY in February. The YoY increase peaked at 19.0% in July 2021, and for this cycle, bottomed at up 0.9% YoY in May 2023. ...There is much more in the article!
As of March, 25 states and D.C. were below their previous peaks, Seasonally Adjusted. The largest seasonally adjusted declines from the recent peaks are in D.C. (-4.9), Oregon (-1.6%), Arkansas (-1.6%), Delaware (-1.3%), Idaho (-1.2%) and Oklahoma (-1.2%).
For cities (Core-based Statistical Areas, CBSA), here are the 30 cities with the largest declines from the peak, seasonally adjusted. Austin continues to be the worst performing city. However, 10 of the 19 cities with the largest price declines are in Florida.

PCE Measure of Shelter Decreases Slightly to 4.3% YoY in March
by Calculated Risk on 4/30/2025 10:30:00 AM
Here is a graph of the year-over-year change in shelter from the CPI report and housing from the PCE report this morning, both through March 2025.
 CPI Shelter was up 4.0% year-over-year in March, down from 4.2% in February, and down from the cycle peak of 8.2% in March 2023.
Housing (PCE) was up 4.3% YoY in March, down slightly from 4.3% in February and down from the cycle peak of 8.3% in April 2023.
Since asking rents are mostly flat year-over-year, these measures will slowly continue to decline over the next year as rents for existing tenants continue to increase.
Since asking rents are mostly flat year-over-year, these measures will slowly continue to decline over the next year as rents for existing tenants continue to increase.
 The second graph shows PCE prices, Core PCE prices and Core ex-housing over the last 3 months (annualized):
Key measures are above the Fed's target on a 3-month basis.
3-month annualized change:
PCE Price Index: 3.1%
Core PCE Prices: 3.5%
Core minus Housing: 3.4%
Core PCE Prices: 3.5%
Core minus Housing: 3.4%
Note: It is likely there is still some residual seasonality distorting PCE prices in Q1.
Personal Income increased 0.5% in March; Spending increased 0.7%
by Calculated Risk on 4/30/2025 10:15:00 AM
The BEA released the Personal Income and Outlays report for March:
Personal income increased $116.8 billion (0.5 percent at a monthly rate) in March, according to estimates released today by the U.S. Bureau of Economic Analysis. Disposable personal income (DPI)—personal income less personal current taxes—increased $102.0 billion (0.5 percent) and personal consumption expenditures (PCE) increased $134.5 billion (0.7 percent).The March PCE price index increased 2.3 percent year-over-year (YoY), down from 2.7 percent YoY in February, and down from the recent peak of 7.2 percent in June 2022.
Personal outlays—the sum of PCE, personal interest payments, and personal current transfer payments—increased $136.6 billion in March. Personal saving was $872.3 billion in March and the personal saving rate—personal saving as a percentage of disposable personal income—was 3.9 percent.
From the preceding month, the PCE price index for March decreased less than 0.1 percent. Excluding food and energy, the PCE price index increased less than 0.1 percent.
From the same month one year ago, the PCE price index for March increased 2.3 percent. Excluding food and energy, the PCE price index increased 2.6 percent from one year ago.
emphasis added
The PCE price index, excluding food and energy, increased 2.6 percent YoY, down from 3.0 percent in January, and down from the recent peak of 5.6 percent in February 2022.
The following graph shows real Personal Consumption Expenditures (PCE) through March 2025 (2017 dollars). Note that the y-axis doesn't start at zero to better show the change.
 Click on graph for larger image.
The dashed red lines are the quarterly levels for real PCE.
Personal income and PCE were above expectations.
Inflation was below expectations.


