 RSS Feed
 by Calculated Risk on 5/01/2025 10:00:00 AM
Thursday, May 01, 2025
ISM® Manufacturing index Decreased to 48.7% in April
(Posted with permission). The ISM manufacturing index indicated expansion. The PMI® was at 48.7% in April, down from 49.0% in March. The employment index was at 46.5%, up from 44.7% the previous month, and the new orders index was at 47.2%, up from 45.2%.
From ISM: Manufacturing PMI® at 48.7% April 2025 Manufacturing ISM® Report On Business®
Economic activity in the manufacturing sector contracted in April for the second month in a row, following a two-month expansion preceded by 26 straight months of contraction, say the nation's supply executives in the latest Manufacturing ISM® Report On Business®.This suggests manufacturing contracted in April. This was slightly above the consensus forecast, however new export orders were weak and prices very strong.
The report was issued today by Timothy R. Fiore, CPSM, C.P.M., Chair of the Institute for Supply Management® (ISM®) Manufacturing Business Survey Committee:
“The Manufacturing PMI® registered 48.7 percent in April, 0.3 percentage point lower compared to the 49 percent recorded in March. The overall economy continued in expansion for the 60th month after one month of contraction in April 2020. (A Manufacturing PMI® above 42.3 percent, over a period of time, generally indicates an expansion of the overall economy.) The New Orders Index contracted for the third month in a row following a three-month period of expansion; the figure of 47.2 percent is 2 percentage points higher than the 45.2 percent recorded in March. The April reading of the Production Index (44 percent) is 4.3 percentage points lower than March’s figure of 48.3 percent. The index returned to contraction last month after two months of expansion preceded by eight months of contraction. The Prices Index remained in expansion (or ‘increasing’) territory, registering 69.8 percent, up 0.4 percentage point compared to the reading of 69.4 percent in March. The Backlog of Orders Index registered 43.7 percent, down 0.8 percentage point compared to the 44.5 percent recorded in March. The Employment Index registered 46.5 percent, up 1.8 percentage points from March’s figure of 44.7 percent.
“The Supplier Deliveries Index indicated a continued slowing of deliveries, registering 55.2 percent, 1.7 percentage points higher than the 53.5 percent recorded in March. (Supplier Deliveries is the only ISM® Report On Business® index that is inversed; a reading of above 50 percent indicates slower deliveries, which is typical as the economy improves and customer demand increases.) The Inventories Index registered 50.8 percent, down 2.6 percentage points compared to March’s reading of 53.4 percent. The index indicated expansion for a second consecutive month after six months of contraction.
“The New Export Orders Index reading of 43.1 percent is 6.5 percentage points lower than the reading of 49.6 percent registered in March. The Imports Index dropped into contraction in April, registering 47.1 percent, 3 percentage points lower than March’s reading of 50.1 percent.”
emphasis added
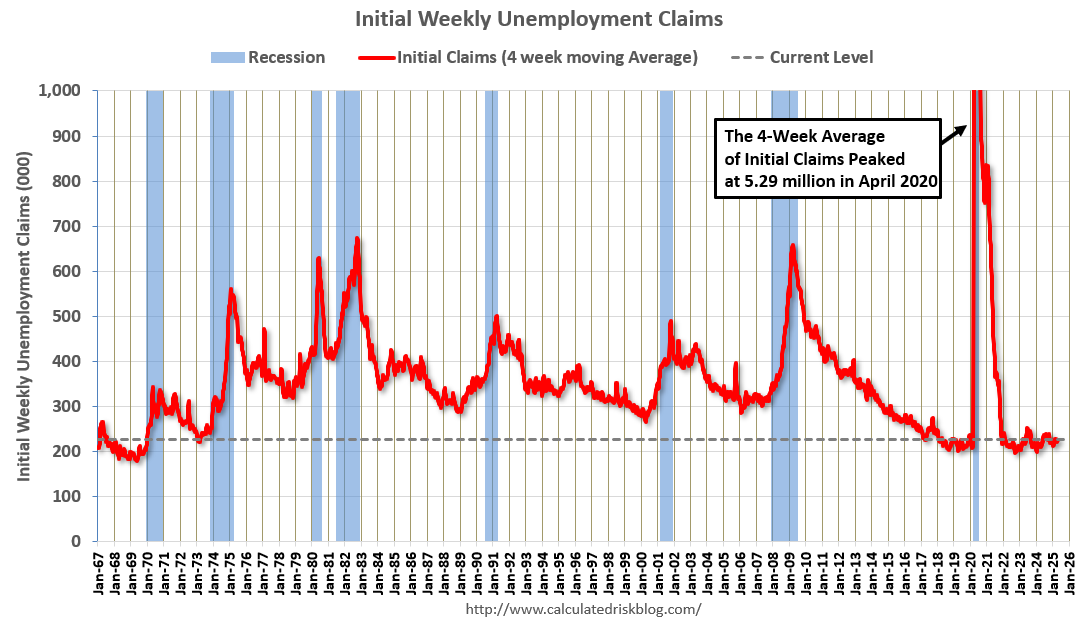
Weekly Initial Unemployment Claims Increase to 241,000
by Calculated Risk on 5/01/2025 08:30:00 AM
The DOL reported:
In the week ending April 26, the advance figure for seasonally adjusted initial claims was 241,000, an increase of 18,000 from the previous week's revised level. The previous week's level was revised up by 1,000 from 222,000 to 223,000. The 4-week moving average was 226,000, an increase of 5,500 from the previous week's revised average. The previous week's average was revised up by 250 from 220,250 to 220,500.The following graph shows the 4-week moving average of weekly claims since 1971.
emphasis added
 Click on graph for larger image.
The dashed line on the graph is the current 4-week average. The four-week average of weekly unemployment claims increased to 226,000.
The previous week was revised up.
Weekly claims were above the consensus forecast.
Wednesday, April 30, 2025
Thursday: Unemployment Claims, ISM Mfg, Construction Spending, Vehicle Sales
by Calculated Risk on 4/30/2025 07:54:00 PM
 Note: Mortgage rates are from MortgageNewsDaily.com and are for top tier scenarios.
Thursday:
• At 8:30 AM ET, The initial weekly unemployment claims report will be released. The consensus is for initial claims of 218 thousand, down from 222 thousand last week.
• At 10:00 AM ET, ISM Manufacturing Index for April. The consensus is for the ISM to be at 48.1, down from 49.0 in March.
• Also at 10:00 AM, Construction Spending for March. The consensus is for a 0.3% increase in construction spending.
• All day, Light vehicle sales for April. The consensus expectation is for light vehicle sales to be 16.8 million SAAR in April, down from 17.8 million in March (Seasonally Adjusted Annual Rate). The WardsAuto estimate is for sales of 17.4 million SAAR in April.
Freddie Mac House Price Index Mostly Unchanged in March; Up 3.0% Year-over-year
by Calculated Risk on 4/30/2025 12:45:00 PM
Today, in the Calculated Risk Real Estate Newsletter: Freddie Mac House Price Index Mostly Unchanged in March; Up 3.0% Year-over-year
A brief excerpt:
Freddie Mac reported that its “National” Home Price Index (FMHPI) increased 0.01% month-over-month on a seasonally adjusted (SA) basis in March. On a year-over-year basis, the National FMHPI was up 3.0% in March, down from up 3.4% YoY in February. The YoY increase peaked at 19.0% in July 2021, and for this cycle, bottomed at up 0.9% YoY in May 2023. ...There is much more in the article!
As of March, 25 states and D.C. were below their previous peaks, Seasonally Adjusted. The largest seasonally adjusted declines from the recent peaks are in D.C. (-4.9), Oregon (-1.6%), Arkansas (-1.6%), Delaware (-1.3%), Idaho (-1.2%) and Oklahoma (-1.2%).
For cities (Core-based Statistical Areas, CBSA), here are the 30 cities with the largest declines from the peak, seasonally adjusted. Austin continues to be the worst performing city. However, 10 of the 19 cities with the largest price declines are in Florida.

PCE Measure of Shelter Decreases Slightly to 4.3% YoY in March
by Calculated Risk on 4/30/2025 10:30:00 AM
Here is a graph of the year-over-year change in shelter from the CPI report and housing from the PCE report this morning, both through March 2025.
 CPI Shelter was up 4.0% year-over-year in March, down from 4.2% in February, and down from the cycle peak of 8.2% in March 2023.
Housing (PCE) was up 4.3% YoY in March, down slightly from 4.3% in February and down from the cycle peak of 8.3% in April 2023.
Since asking rents are mostly flat year-over-year, these measures will slowly continue to decline over the next year as rents for existing tenants continue to increase.
Since asking rents are mostly flat year-over-year, these measures will slowly continue to decline over the next year as rents for existing tenants continue to increase.
 The second graph shows PCE prices, Core PCE prices and Core ex-housing over the last 3 months (annualized):
Key measures are above the Fed's target on a 3-month basis.
3-month annualized change:
PCE Price Index: 3.1%
Core PCE Prices: 3.5%
Core minus Housing: 3.4%
Core PCE Prices: 3.5%
Core minus Housing: 3.4%
Note: It is likely there is still some residual seasonality distorting PCE prices in Q1.
Personal Income increased 0.5% in March; Spending increased 0.7%
by Calculated Risk on 4/30/2025 10:15:00 AM
The BEA released the Personal Income and Outlays report for March:
Personal income increased $116.8 billion (0.5 percent at a monthly rate) in March, according to estimates released today by the U.S. Bureau of Economic Analysis. Disposable personal income (DPI)—personal income less personal current taxes—increased $102.0 billion (0.5 percent) and personal consumption expenditures (PCE) increased $134.5 billion (0.7 percent).The March PCE price index increased 2.3 percent year-over-year (YoY), down from 2.7 percent YoY in February, and down from the recent peak of 7.2 percent in June 2022.
Personal outlays—the sum of PCE, personal interest payments, and personal current transfer payments—increased $136.6 billion in March. Personal saving was $872.3 billion in March and the personal saving rate—personal saving as a percentage of disposable personal income—was 3.9 percent.
From the preceding month, the PCE price index for March decreased less than 0.1 percent. Excluding food and energy, the PCE price index increased less than 0.1 percent.
From the same month one year ago, the PCE price index for March increased 2.3 percent. Excluding food and energy, the PCE price index increased 2.6 percent from one year ago.
emphasis added
The PCE price index, excluding food and energy, increased 2.6 percent YoY, down from 3.0 percent in January, and down from the recent peak of 5.6 percent in February 2022.
The following graph shows real Personal Consumption Expenditures (PCE) through March 2025 (2017 dollars). Note that the y-axis doesn't start at zero to better show the change.
 Click on graph for larger image.
The dashed red lines are the quarterly levels for real PCE.
Personal income and PCE were above expectations.
Inflation was below expectations.
NAR: Pending Home Sales Increase 6.1% in March; Down 0.6% YoY
by Calculated Risk on 4/30/2025 10:00:00 AM
From the NAR: Pending Home Sales Jumped 6.1% in March
Pending home sales increased 6.1% in March – the greatest month-to-month increase since December 2023 (+7.0%) – according to the National Association of REALTORS®. The Northeast experienced month-over-month losses in transactions, while the Midwest, South and West saw gains, which were most substantial in the South. Year-over-year, contract signings grew in the Midwest but fell in the Northeast, South and West – with the Northeast undergoing the greatest decrease.Note: Contract signings usually lead sales by about 45 to 60 days, so this would usually be for closed sales in April and May.
The Pending Home Sales Index (PHSI)* – a forward-looking indicator of home sales based on contract signings – augmented 6.1% to 76.5 in March. Year-over-year, pending transactions lessened by 0.6%. An index of 100 is equal to the level of contract activity in 2001.
"Home buyers are acutely sensitive to even minor fluctuations in mortgage rates," said NAR Chief Economist Lawrence Yun. "While contract signings are not a guarantee of eventual closings, the solid rise in pending home sales implies a sizable build-up of potential home buyers, fueled by ongoing job growth."
...
The Northeast PHSI dropped 0.5% from last month to 62.5, down 3.0% from March 2024. The Midwest index expanded 4.9% to 77.7 in March, up 1.4% from the previous year.
The South PHSI soared 9.8% to 94.1 in March, down 0.4% from a year ago. The West index climbed 4.8% from the prior month to 58.6, down 2.0% from March 2024.
emphasis added
BEA: Real GDP decreased at 0.3% Annualized Rate in Q1
by Calculated Risk on 4/30/2025 08:30:00 AM
From the BEA: Gross Domestic Product, 1st Quarter 2025 (Advance Estimate)
Real gross domestic product (GDP) decreased at an annual rate of 0.3 percent in the first quarter of 2025 (January, February, and March), according to the advance estimate released by the U.S. Bureau of Economic Analysis. In the fourth quarter of 2024, real GDP increased 2.4 percent.PCE increased at a 1.8% annual rate, and residential investment increased at a 1.3% rate. The advance Q1 GDP report, with 0.3% annualized decrease, was below expectations.
The decrease in real GDP in the first quarter primarily reflected an increase in imports, which are a subtraction in the calculation of GDP, and a decrease in government spending. These movements were partly offset by increases in investment, consumer spending, and exports. ...
Compared to the fourth quarter, the downturn in real GDP in the first quarter reflected an upturn in imports, a deceleration in consumer spending, and a downturn in government spending that were partly offset by upturns in investment and exports.
Real final sales to private domestic purchasers, the sum of consumer spending and gross private fixed investment, increased 3.0 percent in the first quarter, compared with an increase of 2.9 percent in the fourth quarter.
The price index for gross domestic purchases increased 3.4 percent in the first quarter, compared with an increase of 2.2 percent in the fourth quarter. The personal consumption expenditures (PCE) price index increased 3.6 percent, compared with an increase of 2.4 percent. Excluding food and energy prices, the PCE price index increased 3.5 percent, compared with an increase of 2.6 percent.
emphasis added
I'll have more later ...
ADP: Private Employment Increased 62,000 in April
by Calculated Risk on 4/30/2025 08:15:00 AM
“Unease is the word of the day. Employers are trying to reconcile policy and consumer uncertainty with a run of mostly positive economic data,” said Dr. Nela Richardson, chief economist, ADP. “It can be difficult to make hiring decisions in such an environment.”This was well below the consensus forecast of 130,000. The BLS report will be released Friday, and the consensus is for 130,000 non-farm payroll jobs added in April.
emphasis added
MBA: Mortgage Applications Decrease in Latest MBA Weekly Survey
by Calculated Risk on 4/30/2025 07:00:00 AM
From the MBA: Mortgage Applications Decrease in Latest MBA Weekly Survey
Mortgage applications decreased 4.2 percent from one week earlier, according to data from the Mortgage Bankers Association’s (MBA) Weekly Mortgage Applications Survey for the week ending April 25, 2025.
The Market Composite Index, a measure of mortgage loan application volume, decreased 4.2 percent on a seasonally adjusted basis from one week earlier. On an unadjusted basis, the Index decreased 4 percent compared with the previous week. The Refinance Index decreased 4 percent from the previous week and was 42 percent higher than the same week one year ago. The seasonally adjusted Purchase Index decreased 4 percent from one week earlier. The unadjusted Purchase Index decreased 3 percent compared with the previous week and was 3 percent higher than the same week one year ago.
“Mortgage rates were little changed last week with the 30-year fixed rate at 6.89 percent. Mortgage application activity, particularly for home purchases, continues to be subdued by broader economic uncertainty and signs of labor market weakness, dropping to the slowest pace since February,” said Joel Kan, MBA’s Vice President and Deputy Chief Economist. “Even with the spring homebuying season underway, purchase applications decreased, as conventional and VA applications saw declines of 6 percent and 4 percent, respectively. With slowly-increasing housing inventory in many markets and first time homebuyers still in the mix, FHA purchase applications fared better with only a slight decline. Overall purchase applications continued to run ahead of last year’s pace.
Added Kan, “Refinance activity dipped again, as mortgage rates remained close to 7 percent, and borrowers hold out for a bigger decline in rates. Given the pullback in refinancing, the average loan size for refinances declined to just under $290,000, the lowest level in three months.”
...
The average contract interest rate for 30-year fixed-rate mortgages with conforming loan balances ($806,500 or less) decreased to 6.89 percent from 6.90 percent, with points increasing to 0.67 from 0.66 (including the origination fee) for 80 percent loan-to-value ratio (LTV) loans.
emphasis added
 Click on graph for larger image.
The first graph shows the MBA mortgage purchase index.
According to the MBA, purchase activity is up 3% year-over-year unadjusted.
Red is a four-week average (blue is weekly).
Purchase application activity is up from the lows in late October 2023 but is 3% below the lowest levels during the housing bust.

The second graph shows the refinance index since 1990.
The refinance index decreased and remained very low.


