 RSS Feed
 by Calculated Risk on 3/18/2025 08:30:00 AM
Tuesday, March 18, 2025
Housing Starts Increased to 1.501 million Annual Rate in February
From the Census Bureau: Permits, Starts and Completions
Housing Starts:
Privately-owned housing starts in February were at a seasonally adjusted annual rate of 1,501,000. This is 11.2 percent above the revised January estimate of 1,350,000, but is 2.9 percent below the February 2024 rate of 1,546,000. Single-family housing starts in February were at a rate of 1,108,000; this is 11.4 percent above the revised January figure of 995,000. The February rate for units in buildings with five units or more was 370,000.
Building Permits:
Privately-owned housing units authorized by building permits in February were at a seasonally adjusted annual rate of 1,456,000. This is 1.2 percent below the revised January rate of 1,473,000 and is 6.8 percent below the February 2024 rate of 1,563,000. Single-family authorizations in February were at a rate of 992,000; this is 0.2 percent below the revised January figure of 994,000. Authorizations of units in buildings with five units or more were at a rate of 404,000 in February.
emphasis added
 Click on graph for larger image.
The first graph shows single and multi-family housing starts since 2000.
Multi-family starts (blue, 2+ units) increased month-over-month in February. Multi-family starts were down 4.6% year-over-year.
Single-family starts (red) increased in February and were down 2.3% year-over-year.
 The second graph shows single and multi-family housing starts since 1968.
 This shows the huge collapse following the housing bubble, and then the eventual recovery - and the recent collapse and recovery in single-family starts.
Total housing starts in February were above expectations; however, starts in December and January were revised down slightly, combined.
I'll have more later …
Monday, March 17, 2025
Tuesday: Housing Starts, Industrial Production
by Calculated Risk on 3/17/2025 08:55:00 PM
 Note: Mortgage rates are from MortgageNewsDaily.com and are for top tier scenarios.
Tuesday:
• At 8:30 AM ET, Housing Starts for February. The consensus is for 1.383 million SAAR, up from 1.366 million SAAR.
• At 9:15 AM, The Fed will release Industrial Production and Capacity Utilization for February. The consensus is a 0.3% increase in Industrial Production, and for Capacity Utilization to be unchanged at 77.8%.
MBA Survey: Share of Mortgage Loans in Forbearance Decreases to 0.38% in February
by Calculated Risk on 3/17/2025 07:01:00 PM
From the MBA:
Share of Mortgage Loans in Forbearance Decreases Slightly to 0.38% in February
The Mortgage Bankers Association’s (MBA) monthly Loan Monitoring Survey revealed that the total number of loans now in forbearance decreased by 2 basis points from 0.40% of servicers’ portfolio volume in the prior month to 0.38% as of February 28, 2025. According to MBA’s estimate, 190,000 homeowners are in forbearance plans. Mortgage servicers have provided approximately 8.6 million forbearances since March 2020.At the end of February, there were about 190,000 homeowners in forbearance plans.
The share of Fannie Mae and Freddie Mac loans in forbearance decreased 2 basis points to 0.15% in February 2025. Ginnie Mae loans in forbearance decreased by 4 basis points to 0.84%, and the forbearance share for portfolio loans and private-label securities (PLS) decreased 3 basis points to 0.37%.
“Despite February’s monthly decline of loans in forbearance, the estimated number of forbearances and loan workouts increased compared to one year ago,” said Marina Walsh, CMB, MBA’s Vice President of Industry Analysis. “The year-over-year gain may be attributed to increasing escrow payments for taxes and insurance, inflationary pressures, natural disasters, aging servicing portfolios, and a softening in the labor market. At the same time, the performance of loan workouts and overall servicing portfolios weakened compared to one year ago."
...
By reason, 73.0% of borrowers are in forbearance for reasons such as a temporary hardship caused by job loss, death, divorce, or disability. Another 24.2% are in forbearance because of a natural disaster. The remaining 2.8% of borrowers are still in forbearance because of COVID-19.
emphasis added
Lawler: Early Read on Existing Home Sales in February
by Calculated Risk on 3/17/2025 03:30:00 PM
Today, in the Calculated Risk Real Estate Newsletter: Lawler: Early Read on Existing Home Sales in February; Recent Rent Trends at Two Large Publicly Traded Companies in the Single-Family Rental Business
A brief excerpt:
From housing economist Tom Lawler:There is much more in the article.
Based on publicly-available local realtor/MLS reports released across the country through today, I project that existing home sales as estimated by the National Association of Realtors ran at a seasonally adjusted annual rate of 4.21 million in February, up 2.9% from January’s preliminary pace but down 2.6% from last February’s seasonally adjusted pace. Unadjusted sales should show a larger YOY % decline, reflecting this February’s lower business day count relative to last February’s.
3rd Look at Local Housing Markets in February
by Calculated Risk on 3/17/2025 12:41:00 PM
Today, in the Calculated Risk Real Estate Newsletter: 3rd Look at Local Housing Markets in February
A brief excerpt:
The NAR is scheduled to release February Existing Home sales on Thursday, March 20th at 10:00 AM. The consensus is for 3.92 million SAAR, down from 4.08 million in January. Last year, the NAR reported sales in February 2024 at 4.31 million SAAR.There is much more in the article.
NOTE: The tables for active listings, new listings and closed sales all include a comparison to February 2019 for each local market (some 2019 data is not available).
This is the third look at local markets in February. I’m tracking over 40 local housing markets in the US. Some of the 40 markets are states, and some are metropolitan areas. I’ll update these tables throughout the month as additional data is released.
Closed sales in February were mostly for contracts signed in December and January when 30-year mortgage rates averaged 6.72% and 6.96%, respectively (Freddie Mac PMMS). This was an increase from the average rate for homes that closed in January, and up slightly from the average rate of 6.7% in December 2023 and January 2024.
...
Here is a look at months-of-supply using NSA sales. Since this is NSA data, it is likely months-of-supply will increase into the Summer.
Months in red will likely see 6+ months of supply this summer and might see price pressures.
...
More local markets to come!

NAHB: "Builder Confidence Falls on Cost Uncertainty" in March
by Calculated Risk on 3/17/2025 10:00:00 AM
The National Association of Home Builders (NAHB) reported the housing market index (HMI) was at 39, down from 42 last month. Any number below 50 indicates that more builders view sales conditions as poor than good.
From the NAHB: Builder Confidence Falls on Cost Uncertainty
Economic uncertainty, the threat of tariffs and elevated construction costs pushed builder sentiment down in March even as builders express hope that a better regulatory environment will lead to an improving business climate.
Builder confidence in the market for newly built single-family homes was 39 in March, down three points from February and the lowest level in seven months, according to the National Association of Home Builders (NAHB)/Wells Fargo Housing Market Index (HMI) released today.
“Builders continue to face elevated building material costs that are exacerbated by tariff issues, as well as other supply-side challenges that include labor and lot shortages,” said NAHB Chairman Buddy Hughes, a home builder and developer from Lexington, N.C. “At the same time, builders are starting to see relief on the regulatory front to bend the rising cost curve, as demonstrated by the Trump administration's pause of the 2021 IECC building code requirement and move to implement the regulatory definition of ‘waters of the United States’ under the Clean Water Act consistent with the U.S. Supreme Court’s Sackett decision.”
“Construction firms are facing added cost pressures from tariffs,” said NAHB Chief Economist Robert Dietz. “Data from the HMI March survey reveals that builders estimate a typical cost effect from recent tariff actions at $9,200 per home. Uncertainty on policy is also having a negative impact on home buyers and development decisions.”
The latest HMI survey also revealed that 29% of builders cut home prices in March, up from 26% in February. Meanwhile, the average price reduction was 5% in March, the same rate as the previous month. The use of sales incentives was 59% in March, unchanged from February.
...
The HMI index gauging current sales conditions fell three points to 43 in March, its lowest point since December 2023. The gauge charting traffic of prospective buyers dropped five points to 24 while the component measuring sales expectations in the next six months held steady at 47.
Looking at the three-month moving averages for regional HMI scores, the Northeast fell three points in March to 54, the Midwest moved three points lower to 42, the South dropped four points to 42 and the West posted a two-point decline to 37.
emphasis added
 Click on graph for larger image.
This graph shows the NAHB index since Jan 1985.
This was below the consensus forecast.
Retail Sales Increased 0.2% in February
by Calculated Risk on 3/17/2025 08:30:00 AM
On a monthly basis, retail sales increased 0.2% from January to February (seasonally adjusted), and sales were up 3.1 percent from February 2024.
From the Census Bureau report:
Advance estimates of U.S. retail and food services sales for February 2025, adjusted for seasonal variation and holiday and trading-day differences, but not for price changes, were $722.7 billion, up 0.2 percent from the previous month, and up 3.1 percent from February 2024. ... The December 2024 to January 2025 percent change was revised from down 0.9 percent to down 1.2 percent.
emphasis added
 Click on graph for larger image.
This graph shows retail sales since 1992. This is monthly retail sales and food service, seasonally adjusted (total and ex-gasoline).
Retail sales ex-gasoline was up 0.3% in February.
The second graph shows the year-over-year change in retail sales and food service (ex-gasoline) since 1993.
Retail and Food service sales, ex-gasoline, increased by 3.4% on a YoY basis.
 The change in sales in February were well below expectations, and sales in December and January were revised down, combined.
Housing March 17th Weekly Update: Inventory up 2.1% Week-over-week, Up 29.3% Year-over-year
by Calculated Risk on 3/17/2025 08:01:00 AM
Altos reports that active single-family inventory was up 2.1% week-over-week.
Inventory is now up 5.0% from the seasonal bottom nine weeks ago in January and us starting to increase seasonally.
The first graph shows the seasonal pattern for active single-family inventory since 2015.
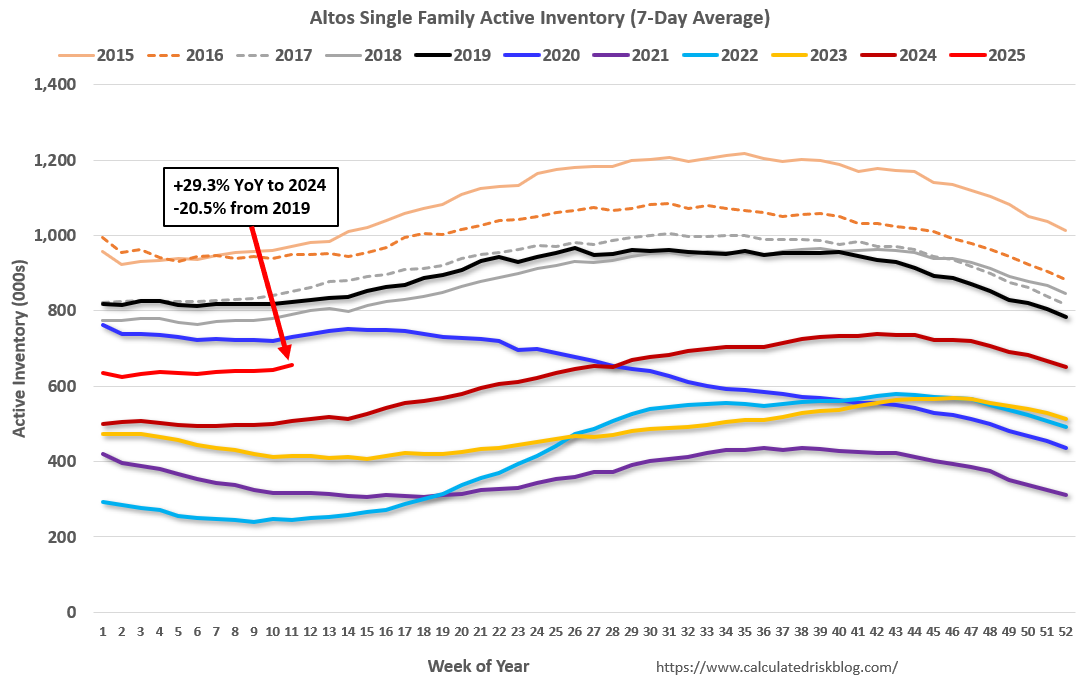 Click on graph for larger image.
The red line is for 2025. The black line is for 2019.
Inventory was up 29.3% compared to the same week in 2024 (last week it was up 28.3%), and down 20.5% compared to the same week in 2019 (last week it was down 21.4%).
The gap to more normal inventory levels has closed significantly!
 This second inventory graph is courtesy of Altos Research.
As of March 14th, inventory was at 656 thousand (7-day average), compared to 642 thousand the prior week.
Mike Simonsen discusses this data regularly on Youtube
Sunday, March 16, 2025
Monday: Retail Sales, NY Fed Mfg, Homebuilder Survey
by Calculated Risk on 3/16/2025 06:29:00 PM
Weekend:
• Schedule for Week of March 16, 2025
• FOMC Preview
Monday:
• At 8:30 AM ET, Retail sales for February is scheduled to be released. The consensus is for a 0.7% increase in retail sales.
• Also at 8:30 AM, The New York Fed Empire State manufacturing survey for March. The consensus is for a reading of -2.0, down from 5.7.
• At 10:00 AM, The March NAHB homebuilder survey. The consensus is for a reading of 43, up from 42. Any number below 50 indicates that more builders view sales conditions as poor than good.
• Also at 10:00 AM, State Employment and Unemployment (Monthly) for January 2025
From CNBC: Pre-Market Data and Bloomberg futures S&P 500 are down 20 and DOW futures are down 123 (fair value).
Oil prices were unchanged over the last week with WTI futures at $67.18 per barrel and Brent at $70.58 per barrel. A year ago, WTI was at $82, and Brent was at $85 - so WTI oil prices are down about 18% year-over-year.
Here is a graph from Gasbuddy.com for nationwide gasoline prices. Nationally prices are at $3.02 per gallon. A year ago, prices were at $3.45 per gallon, so gasoline prices are down $0.43 year-over-year.
FOMC Preview: No Change to Fed Funds Rate
by Calculated Risk on 3/16/2025 09:56:00 AM
Most analysts expect no change to FOMC policy at the meeting this week, keeping the target range at 4 1/4 to 4 1/2 percent. Market participants currently expect the FOMC to be on hold at the March and May meetings, with the next rate cut in June, and another cut later in the year.
From BofA:
The March FOMC meeting will likely be all about policy uncertainty. The Fed will almost certainly stay on hold, emphasizing patience over panic. QT will likely be paused. Markets could interpret the Fed’s message as hawkish because they are focused on downside risks to activity. But in our view, the “Powell put” is not forthcoming. The SEP forecasts and distribution of risks are both likely to reflect stagflation: weaker growth and higher inflation. The dot plot should still show two cuts in ’25 and ’26.
emphasis added
Projections will be released at this meeting. For review, here are the December projections.
The BEA's second estimate for Q4 GDP showed real growth at 2.3% annualized. That put real growth in 2024, Q4 over Q4, at 2.5% - at the top end of the December FOMC projections. It appears growth will slow in Q1 2025, and it seems likely 2025 GDP will be revised down.
| GDP projections of Federal Reserve Governors and Reserve Bank presidents, Change in Real GDP1 | ||||
|---|---|---|---|---|
| Projection Date | 2024 | 2025 | 2026 | 2027 |
| Dec 2024 | 2.4 to 2.5 | 1.8 to 2.2 | 1.9 to 2.1 | 1.8 to 2.0 |
| Sept 2024 | 1.9 to 2.1 | 1.8 to 2.2 | 1.9 to 2.3 | 1.8 to 2.1 |
The unemployment rate was at 4.1% in February.
| Unemployment projections of Federal Reserve Governors and Reserve Bank presidents, Unemployment Rate2 | ||||
|---|---|---|---|---|
| Projection Date | 2024 | 2025 | 2026 | 2027 |
| Dec 2024 | 4.2 | 4.2 to 4.5 | 4.1 to 4.4 | 4.0 to 4.4 |
| Sept 2024 | 4.3 to 4.4 | 4.2 to 4.5 | 4.0 to 4.4 | 4.0 to 4.4 |
As of January 2025, PCE inflation increased 2.5 percent year-over-year (YoY). The projections for Q4 2025 PCE inflation might be revised up.
| Inflation projections of Federal Reserve Governors and Reserve Bank presidents, PCE Inflation1 | ||||
|---|---|---|---|---|
| Projection Date | 2024 | 2025 | 2026 | 2027 |
| Dec 2024 | 2.4 to 2.5 | 2.3 to 2.6 | 2.0-2.2 | 2.0 |
| Sept 2024 | 2.2 to 2.4 | 2.1 to 2.2 | 2.0 | 2.0 |
PCE core inflation increased 2.6 percent YoY in January and is expected to be up 2.7 percent YoY in February. The projections for core PCE inflation Q4 2025 might be revised up.
| Core Inflation projections of Federal Reserve Governors and Reserve Bank presidents, Core Inflation1 | ||||
|---|---|---|---|---|
| Projection Date | 2024 | 2025 | 2026 | 2027 |
| Dec 2024 | 2.8 to 2.9 | 2.5 to 2.7 | 2.0-2.3 | 2.0 |
| Sept 2024 | 2.6 to 2.7 | 2.1 to 2.3 | 2.0 | 2.0 |


