 RSS Feed
 by Calculated Risk on 2/26/2025 10:40:00 AM
Wednesday, February 26, 2025
Newsletter: New Home Sales Decrease to 657,000 Annual Rate in January
Today, in the Calculated Risk Real Estate Newsletter: New Home Sales Decrease to 657,000 Annual Rate in January
Brief excerpt:
The Census Bureau reported New Home Sales in January were at a seasonally adjusted annual rate (SAAR) of 657 thousand. The previous three months were revised up.There is much more in the article.
...
The next graph shows new home sales for 2024 and 2025 by month (Seasonally Adjusted Annual Rate). Sales in January 2025 were down 1.1% from January 2024.
New home sales, seasonally adjusted, have increased year-over-year in 19 of the last 22 months. This is essentially the opposite of what happened with existing home sales that had been down year-over-year every month for 3+ years (existing home sales have been up year-over-year for the last 4 months).

New Home Sales Decrease to 657,000 Annual Rate in January
by Calculated Risk on 2/26/2025 10:00:00 AM
The Census Bureau reports New Home Sales in January were at a seasonally adjusted annual rate (SAAR) of 657 thousand.
The previous three months were revised up.
Sales of new single-family houses in January 2025 were at a seasonally adjusted annual rate of 657,000, according to estimates released jointly today by the U.S. Census Bureau and the Department of Housing and Urban Development. This is 10.5 percent below the revised December rate of 734,000 and is 1.1 percent below the January 2024 estimate of 664,000.
emphasis added
 Click on graph for larger image.
The first graph shows New Home Sales vs. recessions since 1963. The dashed line is the current sales rate.
New home sales were slightly below pre-pandemic levels.
The second graph shows New Home Months of Supply.
 The months of supply increased in January to 9.0 months from 8.0 months in December.
 The all-time record high was 12.2 months of supply in January 2009. The all-time record low was 3.3 months in August 2020.
This is well above the top of the normal range (about 4 to 6 months of supply is normal).
"The seasonally-adjusted estimate of new houses for sale at the end of January was 495,000. This represents a supply of 9.0 months at the current sales rate."Sales were below expectations of 678 thousand SAAR, however sales for the three previous months were revised up. I'll have more later today.
MBA: Mortgage Applications Decrease in Latest MBA Weekly Survey
by Calculated Risk on 2/26/2025 07:00:00 AM
From the MBA: Mortgage Applications Decrease in Latest MBA Weekly Survey
Mortgage applications decreased 1.2 percent from one week earlier, according to data from the Mortgage Bankers Association’s (MBA) Weekly Mortgage Applications Survey for the week ending February 21, 2025.
The Market Composite Index, a measure of mortgage loan application volume, decreased 1.2 percent on a seasonally adjusted basis from one week earlier. On an unadjusted basis, the Index decreased 4 percent compared with the previous week. The Refinance Index decreased 4 percent from the previous week and was 45 percent higher than the same week one year ago. The seasonally adjusted Purchase Index increased 0 percent from one week earlier. The unadjusted Purchase Index decreased 5 percent compared with the previous week and was 3 percent higher than the same week one year ago.
“Treasury yields moved lower on softer consumer spending data as consumers are feeling somewhat less upbeat about the economy and job market. This pushed mortgage rates lower, with the 30-year fixed rate decreasing to 6.88 percent, the lowest rate since mid-December,” said Joel Kan, MBA’s Vice President and Deputy Chief Economist. “Applications were about one percent lower for the week, which included the President’s Day holiday, as purchase applications stayed flat from a week ago while refinance applications saw a small decline. Purchase applications were up 3 percent from the same week last year. Increasing for-sale inventory in some markets has provided prospective buyers more options as we approach the spring homebuying season.”
Added Kan, “Although overall refinance application activity remained fairly weak, FHA refinance applications saw an 8 percent increase over the week. Compared to last year, overall refinance applications were up 45 percent.
...
The average contract interest rate for 30-year fixed-rate mortgages with conforming loan balances ($766,550 or less) decreased to 6.88 percent from 6.93 percent, with points decreasing to 0.61 from 0.66 (including the origination fee) for 80 percent loan-to-value ratio (LTV) loans.
emphasis added
 Click on graph for larger image.
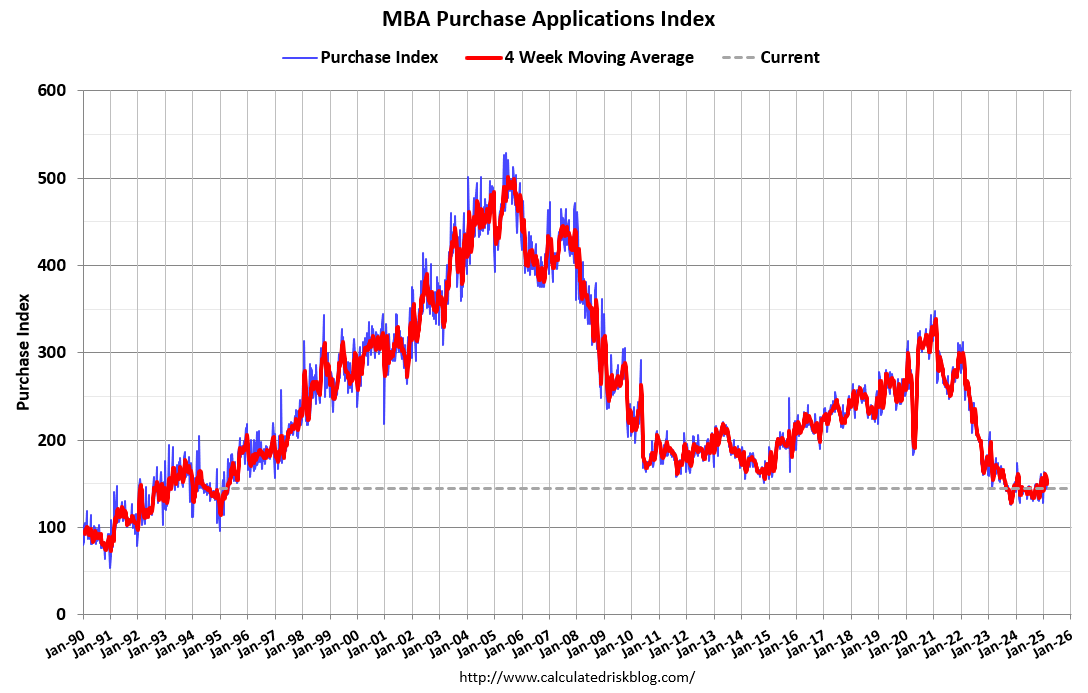
The first graph shows the MBA mortgage purchase index.
According to the MBA, purchase activity is up 3% year-over-year unadjusted.
Red is a four-week average (blue is weekly).
Purchase application activity is up about 15% from the lows in late October 2023 and is now 4% below the lowest levels during the housing bust.

The second graph shows the refinance index since 1990.
The refinance index remains very low.
Tuesday, February 25, 2025
Wednesday: New Home Sales
by Calculated Risk on 2/25/2025 07:41:00 PM
 Note: Mortgage rates are from MortgageNewsDaily.com and are for top tier scenarios.
Wednesday:
• At 7:00 AM ET, The Mortgage Bankers Association (MBA) will release the mortgage purchase applications index.
• At 10:00 AM, New Home Sales for January from the Census Bureau. The consensus is that new home sales decreased to 678 thousand SAAR, down from 698 thousand in December.
A few comments on the Seasonal Pattern for House Prices
by Calculated Risk on 2/25/2025 04:16:00 PM
A few key points:
1) There is a clear seasonal pattern for house prices.
2) The surge in distressed sales during the housing bust distorted the seasonal pattern. This was because distressed sales (at lower price points) happened at a steady rate all year, while regular sales followed the normal seasonal pattern. This made for larger swings in the seasonal factor during the housing bust.
3) The seasonal swings have increased recently without a surge in distressed sales.
 Click on graph for larger image.
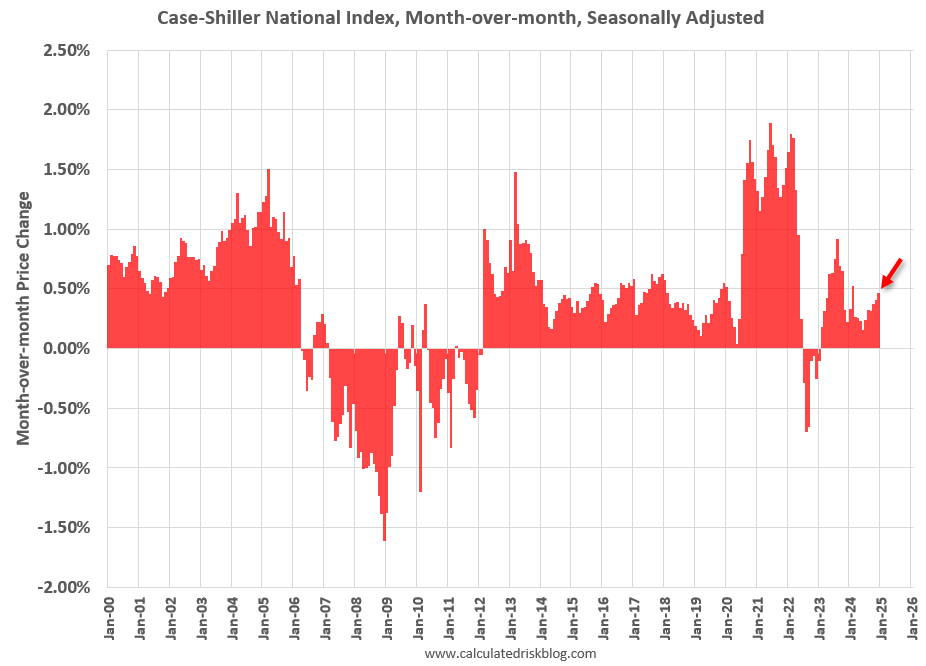
This graph shows the month-to-month change in the NSA Case-Shiller National index since 1987 (through December 2024). The seasonal pattern was smaller back in the '90s and early '00s and increased once the bubble burst.
The seasonal swings declined following the bust, however the pandemic price surge changed the month-over-month pattern.
 The second graph shows the seasonal factors for the Case-Shiller National index since 1987. The factors started to change near the peak of the bubble, and really increased during the bust since normal sales followed the regular seasonal pattern - and distressed sales happened all year.
The swings in the seasonal factors were decreasing following the bust but have increased again recently - this time without a surge in distressed sales.
 Click on graph for larger image.
This graph shows the month-to-month change in the NSA Case-Shiller National index since 1987 (through December 2024). The seasonal pattern was smaller back in the '90s and early '00s and increased once the bubble burst.
The seasonal swings declined following the bust, however the pandemic price surge changed the month-over-month pattern.
 The second graph shows the seasonal factors for the Case-Shiller National index since 1987. The factors started to change near the peak of the bubble, and really increased during the bust since normal sales followed the regular seasonal pattern - and distressed sales happened all year.
 The swings in the seasonal factors were decreasing following the bust but have increased again recently - this time without a surge in distressed sales.
FDIC: Number of Problem Banks Decreased in Q4 2024
by Calculated Risk on 2/25/2025 01:11:00 PM
The FDIC released the Quarterly Banking Profile for Q4 2024:
Full-Year ROA and Net Income Increased in 2024
The banking industry reported full-year net income of $268.2 billion, up $14.1 billion (5.6 percent) from 2023. The aggregate return-on-assets ratio (ROA) increased 3 basis points to 1.12 percent. The increase primarily occurred due to one-time events in 2023 and 2024 that led to lower noninterest expense (down $8.5 billion, or 1.4 percent), higher noninterest income (up $6.0 billion, or 2.0 percent), and lower realized securities losses (down $5.3 billion, or 46.3 percent) in 2024. The full-year net interest margin decreased to 3.22 percent, down 8 basis points from 2023.
...
Asset Quality Metrics Remained Generally Favorable, Though Weakness in Certain Portfolios Persisted
Past-due and nonaccrual (PDNA) loans, or loans 30 or more days past due or in nonaccrual status, increased 7 basis points from the prior quarter to 1.60 percent of total loans. The industry’s PDNA ratio remained below the pre-pandemic average of 1.94 percent. The PDNA ratio for non-owner occupied commercial real estate (CRE) loans declined 5 basis points to 2.02 percent but remained 129 basis points above the pre-pandemic average. Despite declining slightly in the fourth quarter, the PDNA rate for the non-owner occupied CRE portfolio remained elevated, largely driven by office loans at banks with more than $250 billion in assets. However, these banks tend to have lower concentrations of such loans in relation to total assets and capital than smaller institutions, mitigating the overall risk.
The industry’s net charge-off ratio increased 4 basis points from the prior quarter to 0.70 percent, 5 basis points higher than the year-earlier quarter and 22 basis points above the pre-pandemic average. The credit card net charge-off ratio was 4.57 percent in the fourth quarter, up 9 basis points quarter over quarter and 109 basis points above the pre-pandemic average.
emphasis added
 Click on graph for larger image.
From the FDIC:
The Number of Problem Banks Decreased in the Fourth QuarterThis graph from the FDIC shows the number of problem banks.
The number of banks on the FDIC’s “Problem Bank List” decreased from 68 to 66 in the fourth quarter. Problem banks represented 1.5 percent of total banks at year-end, which is within the normal range of 1 to 2 percent of all banks during non-crisis periods.
Newsletter: Case-Shiller: National House Price Index Up 3.9% year-over-year in December
by Calculated Risk on 2/25/2025 09:54:00 AM
Today, in the Calculated Risk Real Estate Newsletter: Case-Shiller: National House Price Index Up 3.9% year-over-year in December
Excerpt:
S&P/Case-Shiller released the monthly Home Price Indices for December ("December" is a 3-month average of October, November and December closing prices). December closing prices include some contracts signed in August, so there is a significant lag to this data. Here is a graph of the month-over-month (MoM) change in the Case-Shiller National Index Seasonally Adjusted (SA).There is much more in the article.
The MoM increase in the seasonally adjusted (SA) Case-Shiller National Index was at 0.46% (a 5.7% annual rate), This was the 23rd consecutive MoM increase in the seasonally adjusted index.
On a seasonally adjusted basis, prices increased month-to-month in 18 of the 20 Case-Shiller cities (prices declined in Washington, D.C. and Tampa seasonally adjusted). San Francisco has fallen 5.7% from the recent peak, Phoenix is down 1.2% from the peak, and Tampa down 1.2%.
Case-Shiller: National House Price Index Up 3.9% year-over-year in December
by Calculated Risk on 2/25/2025 09:00:00 AM
S&P/Case-Shiller released the monthly Home Price Indices for December ("December" is a 3-month average of October, November and December closing prices).
This release includes prices for 20 individual cities, two composite indices (for 10 cities and 20 cities) and the monthly National index.
From S&P S&P CoreLogic Case-Shiller Index Records 3.9% Annual Gain in December 2024
The S&P CoreLogic Case-Shiller U.S. National Home Price NSA Index, covering all nine U.S. census divisions, reported a 3.9% annual return for December, up from a 3.7% annual gain in the previous month. The 10-City Composite saw an annual increase of 5.1%, up from a 5% annual increase in the previous month. The 20-City Composite posted a year-over-year increase of 4.5%, up from a 4.3% increase in the previous month. New York again reported the highest annual gain among the 20 cities with a 7.2% increase in December, followed by Chicago and Boston with annual increases of 6.6% and 6.3%, respectively. Tampa posted the lowest return, falling 1.1%.
...
The pre-seasonally adjusted U.S. National and 20-City Composite Indices’ upward trends continued to reverse in December, with both posting a -0.1% drop. The 10-City Composite’s monthly return dropped 0.04%.
After seasonal adjustment, the U.S. National, 20-City, and 10-City Composite Indices all posted a month-over-month increase of 0.5%.
“It has been five years since the Covid-19 outbreak took hold of the global economy, sparking unprecedented volatility, massive fiscal and monetary stimulus, and a housing market that responded to national migratory changes in how we work and where we live,” says Brian D. Luke, CFA, Head of Commodities, Real & Digital Assets at S&P Dow Jones Indices. “National home prices have risen by 8.8% annually since 2020, led by markets in Florida, North Carolina, Southern California, and Arizona. While our National Index continues to trend above inflation, we are a few years removed from peak home price appreciation of 18.9% observed in 2021 and are seeing below-trend growth over the history of the index.
“Home prices stalled during the second half of the year with markets in the West dropping the fastest. San Francisco, the worst performing market since 2020, dropped 4.5% during the last six months of the year, followed by Seattle with a 3.0% decline. San Francisco is now 11.0% lower than its post-pandemic peak reached in May 2022. Previous strongholds like San Diego and Tampa experienced declines of 2.9% and 2.7%, respectively, during the second half of the year. After accounting for seasonal adjustments, our National Index pushed forward to achieve a 19th consecutive all-time high,” Luke continued. “The longest such streak occurred for over 12-years, notching 153 consecutive all-time highs from July 1993 to March 2006.
“The Northeast continues to lead all regions with above-trend growth, led by New York for the eighth consecutive time. Boston reached an all-time high, the only market to do so for the period ended December 2024."
emphasis added
 Click on graph for larger image.
 The first graph shows the nominal seasonally adjusted Composite 10, Composite 20 and National indices (the Composite 20 was started in January 2000).
The Composite 10 index was up 0.5% in December (SA). The Composite 20 index was up 0.5% (SA) in December.
The National index was up 0.5% (SA) in December.
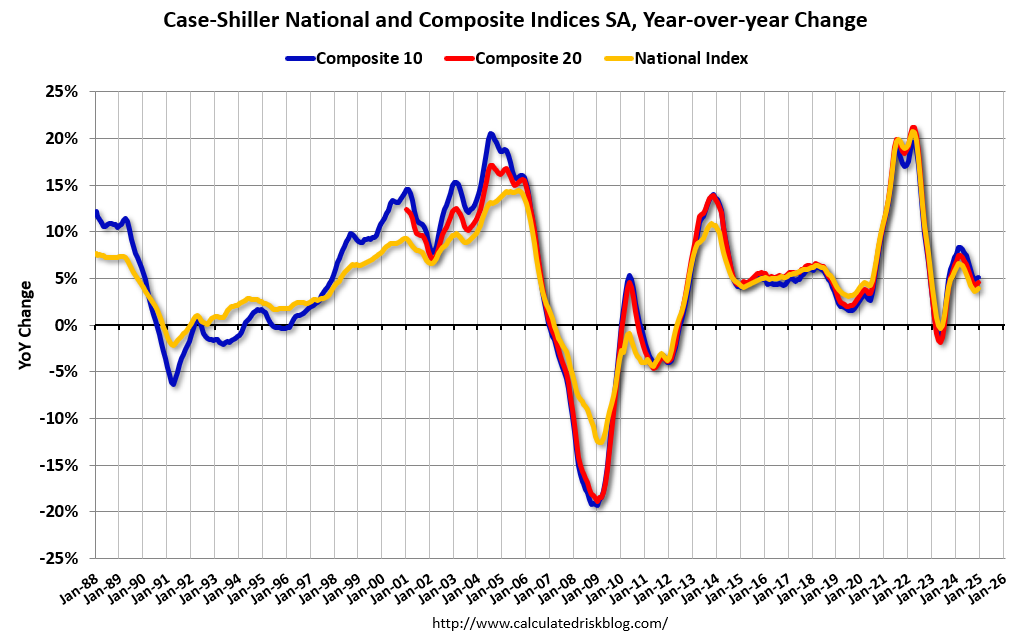 The second graph shows the year-over-year change in all three indices.
The Composite 10 NSA was up 5.1% year-over-year. The Composite 20 NSA was up 4.5% year-over-year.
The National index NSA was up 3.9% year-over-year.
Annual price changes were close to expectations. I'll have more later.
Monday, February 24, 2025
Tuesday: Case-Shiller House Prices, Richmond Fed Mfg
by Calculated Risk on 2/24/2025 07:06:00 PM
 From Matthew Graham at Mortgage News Daily: Mortgage Rates Start New Week at 2 Month Lows
Mortgage rates were already in line with the lowest levels since December 18th by last Thursday. They dropped to the best levels since December 12th a day later. end of last week.Tuesday:
...
The bond market (which underlies and dictates interest rate movement) was very calm today after early gains. Investors are waiting to see Friday's PCE inflation data before making any big moves in either direction ... [30 year fixed 6.87%]
emphasis added
• At 9:00 AM ET, FHFA House Price Index for December 2024. This was originally a GSE only repeat sales, however there is also an expanded index.
• At 9:00 AM, S&P/Case-Shiller House Price Index for December. The consensus is for a 4.5% year-over-year increase in the Comp 20 index for December, up from 4.3% in November.
• At 10:00 AM, Richmond Fed Survey of Manufacturing Activity for February.
February Vehicle Forecast: Sales Increase to 15.9 million SAAR, Up 1.5% YoY
by Calculated Risk on 2/24/2025 12:56:00 PM
From WardsAuto: February U.S. Light-Vehicle Sales Maintain Growth; Inventory Resumes Gains (pay content). Brief excerpt:
Sales are recording solid gains, but production slowdowns capping dealer stock in a growth market – a market that ostensibly still is climbing out of the trough caused by the pandemic and supply-chain issues - suggest the industry overall wants to maintain profit margins but also has a high level of uncertainty about 2025 and does not want to be in a position of having to make sudden, bigger cuts if the market weakens at some point this year.
emphasis added
 Click on graph for larger image.
This graph shows actual sales from the BEA (Blue), and Wards forecast for February (Red).
On a seasonally adjusted annual rate basis, the Wards forecast of 15.9 million SAAR, would be up 1.9% from last month, and up 1.5% from a year ago.


