 RSS Feed
 by Calculated Risk on 1/21/2025 09:24:00 AM
Tuesday, January 21, 2025
3rd Look at Local Housing Markets in December
Today, in the Calculated Risk Real Estate Newsletter: 3rd Look at Local Housing Markets in December
A brief excerpt:
The NAR is scheduled to release December Existing Home sales on Friday, January 24th at 10:00 AM. The consensus is for 4.20 million SAAR, up from 4.15 million in November. Last year, the NAR reported sales in December 2023 at 3.88 million SAAR. This will be the third consecutive month with a year-over-year increase following YoY declines every month since July 2021.There is much more in the article.
Housing economist Tom Lawler expects the NAR to report sales of 4.15 million SAAR for December.
...
Here is a look at months-of-supply using NSA sales. Since this is NSA data, it is likely this will be the seasonal low for months-of-supply.
Note the regional differences with more months-of-supply in the South, especially in Florida and Texas.
...
More local markets to come!

Monday, January 20, 2025
Monday Night Futures
by Calculated Risk on 1/20/2025 06:29:00 PM
Tuesday:
• No major economic releases scheduled.
From CNBC: Pre-Market Data and Bloomberg futures S&P 500 are up 32 and DOW futures are up 225 (fair value).
1.73 million Total Housing Completions in 2024 including Manufactured Homes; Most Since 2006
by Calculated Risk on 1/20/2025 02:04:00 PM
Today, in the Calculated Risk Real Estate Newsletter: 1.73 million Total Housing Completions in 2024 including Manufactured Homes; Most Since 2006
A brief excerpt:
Although total housing starts decreased 3.9% in 2024 compared to 2023, completions increased sharply year-over-year. There were 1.731 million total completions and placements in 2024, up 12.5% compared to 2023, and the most since 2006.There is much more in the article.
Not counting Manufactured homes, there are 1.628 million completions in 2024, up 12.4% from 1.449 million in 2023, and also the most since 2006.
...
The housing start report last week indicated 1,020.4 thousand single family completions in 2024 (red), up 2.2% from 998.8 thousand in 2023. There were 16.8 thousand completions of 2-to-4 units, and 590.6 thousand completions of 5+ units (blue), up 35% from 2023, and the most since 1974!

AAR: Rail Carloads Down YoY in 2024, Intermodal Up
by Calculated Risk on 1/20/2025 11:17:00 AM
From the Association of American Railroads (AAR) Rail Time Indicators. Graphs and excerpts reprinted with permission.
For the full year 2024, total U.S. carloads were 11.34 million, down 2.9% (343,156 carloads) from 2023 and down 2.3% (265,491 carloads) from 2022. ... Carloads excluding coal, on the other hand, rose in 2024 — up 1.4%, or 117,264 carloads, over 2023 and their third year-over-year gain in the past four years.
U.S. railroads originated 13.84 million containers and trailers in 2024, the most since 2021; the third most ever (behind 2018 and 2021); and up 9.3% (1.17 million units) over 2023.
emphasis added
 Click on graph for larger image.
This graph from the Rail Time Indicators report shows the six-week average for carloads for the last 3 years. Total carloads were down 2.0% in Q4 YoY.
Total originated carloads on U.S. railroads in the fourth quarter of 2024 fell 2.0%, or 57,285 carloads, from the fourth quarter of 2023. Total carloads fell year-over-year each quarter in 2024 after rising (albeit modestly) in three of the four quarters of 2023. Total carloads averaged 220,336 per week in Q4 2024. In our records that begin in 1988, only 2020 had a lower fourth-quarter weekly average.
 And on Intermodal:
In Q4 2024, intermodal averaged 279,275 units per week, up 8.8% over Q4 2023 and the most ever for a fourth quarter in our records. (Q3 2018 and Q2 2021 were higher among all quarters.) Container volume averaged 269,460 per week in Q4 2024, up 10.0% over Q4 2023 and the most ever for any quarter.Note: rail traffic was weak even before the pandemic. As AAR noted: "Trade tensions and declining mfrg. output lead to lower rail volumes" in 2019. These factors might impact rail traffic again in 2025.
Housing Jan 20th Weekly Update: Inventory Up 1.2% Week-over-week, Up 24.8% Year-over-year
by Calculated Risk on 1/20/2025 08:11:00 AM
Altos reports that active single-family inventory was up 1.2% week-over-week.
Inventory always declines seasonally in the Winter and usually bottoms in late January or February. If the previous week was the seasonal bottom, that would be very early in the year, but that has happened before.
The first graph shows the seasonal pattern for active single-family inventory since 2015.
 Click on graph for larger image.
The red line is for 2024. The black line is for 2019.
Inventory was up 24.8% compared to the same week in 2024 (last week it was up 23.6%), and down 23.4% compared to the same week in 2019 (last week it was down 23.3%).
Back in June 2023, inventory was down almost 54% compared to 2019, so the gap to more normal inventory levels has closed significantly!
 This second inventory graph is courtesy of Altos Research.
As of Jan 17th, inventory was at 632 thousand (7-day average), compared to 624 thousand the prior week.
Mike Simonsen discusses this data regularly on Youtube
Sunday, January 19, 2025
Sunday Night: Markets Closed in observance of Martin Luther King Jr. Day
by Calculated Risk on 1/19/2025 07:16:00 PM
Weekend:
• Schedule for Week of January 19, 2025
Monday:
• All US markets will be closed in observance of Martin Luther King Jr. Day
Oil prices were up over the last week with WTI futures at $77.88 per barrel and Brent at $80.79 per barrel. A year ago, WTI was at $74, and Brent was at $81 - so WTI oil prices are up about 5% year-over-year.
Here is a graph from Gasbuddy.com for nationwide gasoline prices. Nationally prices are at $3.11 per gallon. A year ago, prices were at $3.10 per gallon, so gasoline prices are mostly unchanged year-over-year.
Hotels: Occupancy Rate Decreased 7.7% Year-over-year
by Calculated Risk on 1/19/2025 08:14:00 AM
The U.S. hotel industry reported negative year-over-year comparisons, according to CoStar’s latest data through 11 January. ...The following graph shows the seasonal pattern for the hotel occupancy rate using the four-week average.
5-11 January 2025 (percentage change from comparable week in 2024):
• Occupancy: 49.2% (-7.7%)
• Average daily rate (ADR): US$144.03 (-5.9%)
• Revenue per available room (RevPAR): US$70.92 (-13.2%)
emphasis added
 Click on graph for larger image.
The red line is for 2025, blue is the median, and dashed light blue is for 2024. Dashed purple is for 2018, the record year for hotel occupancy.
The 4-week average of the occupancy rate is close to both last year and the median rate for the period 2000 through 2024 (Blue).
Note: Y-axis doesn't start at zero to better show the seasonal change.
This is the weakest period of the year for hotel occupancy and the 4-week average will increase seasonally for the next several months.
Saturday, January 18, 2025
Real Estate Newsletter Articles this Week: Housing Starts Down 3.9% in 2024 compared to 2023
by Calculated Risk on 1/18/2025 02:11:00 PM
At the Calculated Risk Real Estate Newsletter this week:
 Click on graph for larger image.
• Housing Starts Increased to 1.499 million Annual Rate in December
• Housing Discussion with Altos Research's Mike Simonsen
• Lawler: Early Read on Existing Home Sales in December
• Part 1: Current State of the Housing Market; Overview for mid-January 2025
• Part 2: Current State of the Housing Market; Overview for mid-January 2025
• 2nd Look at Local Housing Markets in December
This is usually published 4 to 6 times a week and provides more in-depth analysis of the housing market.
Schedule for Week of January 19, 2025
by Calculated Risk on 1/18/2025 08:11:00 AM
The key report this week is December Existing Home Sales.
All US markets will be closed in observance of Martin Luther King Jr. Day
"Our lives begin to end the day we become silent about things that matter." Martin Luther King Jr.
No major economic releases scheduled.
7:00 AM ET: The Mortgage Bankers Association (MBA) will release the mortgage purchase applications index.
During the day: The AIA's Architecture Billings Index for December (a leading indicator for commercial real estate).
8:30 AM: The initial weekly unemployment claims report will be released. The consensus is for a increase to 227 thousand from 217 thousand last week.
11:00 AM: the Kansas City Fed manufacturing survey for January.
 10:00 AM: Existing Home Sales for December from the National Association of Realtors (NAR). The consensus is for 4.20 million SAAR, up from 4.15 million.
The graph shows existing home sales from 1994 through the report last month.
10:00 AM: University of Michigan's Consumer sentiment index (Preliminary for January).
Friday, January 17, 2025
January 19th COVID Update: COVID in Wastewater Decreasing
by Calculated Risk on 1/17/2025 07:48:00 PM
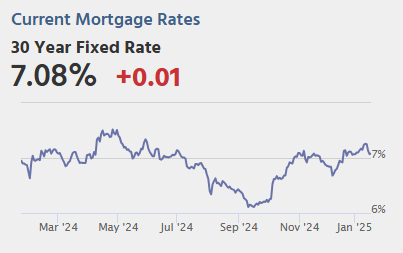 Note: Mortgage rates are from MortgageNewsDaily.com and are for top tier scenarios.
For deaths, I'm currently using 4 weeks ago for "now", since the most recent three weeks will be revised significantly.
Note: "Effective May 1, 2024, hospitals are no longer required to report COVID-19 hospital admissions, hospital capacity, or hospital occupancy data." So I'm no longer tracking hospitalizations.
| COVID Metrics | ||||
|---|---|---|---|---|
| Now | Week Ago | Goal | ||
| Deaths per Week | 518 | 524 | ≤3501 | |
| 1my goals to stop weekly posts. 🚩 Increasing number weekly for Deaths. ✅ Goal met. | ||||
 Click on graph for larger image.
This graph shows the weekly (columns) number of deaths reported since Jan 2020.
Although weekly deaths met the original goal to stop posting, I'm continuing to post now that deaths are above the goal again - and at a minimum, I'll continue to post through the Winter.
Weekly deaths have mostly been declining, however weekly deaths are still above the low of 313 in early June 2024.
 This appears to be a leading indicator for COVID hospitalizations and deaths.
Nationally COVID in wastewater is "HIGH" according to the CDC but is now declining.


