 RSS Feed
 by Calculated Risk on 1/16/2025 10:02:00 AM
Thursday, January 16, 2025
Weekly Initial Unemployment Claims Increase to 217,000
The DOL reported:
In the week ending January 11, the advance figure for seasonally adjusted initial claims was 217,000, an increase of 14,000 from the previous week's revised level. The previous week's level was revised up by 2,000 from 201,000 to 203,000. The 4-week moving average was 212,750, a decrease of 750 from the previous week's revised average. The previous week's average was revised up by 500 from 213,000 to 213,500.The following graph shows the 4-week moving average of weekly claims since 1971.
emphasis added
 Click on graph for larger image.
The dashed line on the graph is the current 4-week average. The four-week average of weekly unemployment claims decreased to 213,000.
The previous week was revised up.
Weekly claims were close to the consensus forecast.
Wednesday, January 15, 2025
Thursday: Retail Sales, Unemployment Claims, Philly Fed Mfg, Homebuider Survey
by Calculated Risk on 1/15/2025 08:13:00 PM
 Note: Mortgage rates are from MortgageNewsDaily.com and are for top tier scenarios.
Thursday:
• At 8:30 AM ET, The initial weekly unemployment claims report will be released. The consensus is for a increase to 215 thousand from 201 thousand last week.
• At 8:30 AM, Retail sales for December is scheduled to be released. The consensus is for a 0.5% increase in retail sales.
• At 8:30 AM, the Philly Fed manufacturing survey for January.
• At 10:00 AM, The January NAHB homebuilder survey. The consensus is for a reading of 45, down from 46 the previous month. Any number below 50 indicates that more builders view sales conditions as poor than good.
Fed's Beige Book: "Economic activity increased slightly to moderately"
by Calculated Risk on 1/15/2025 02:38:00 PM
Economic activity increased slightly to moderately across the twelve Federal Reserve Districts in late November and December. Consumer spending moved up moderately, with most Districts reporting strong holiday sales that exceeded expectations. Vehicle sales grew modestly. Construction activity decreased overall, with several Districts indicating that high costs for materials and financing were weighing on growth. Manufacturing decreased slightly on net, and a number of Districts said manufacturers were stockpiling inventories in anticipation of higher tariffs. Residential real estate activity was unchanged on balance, as high mortgage rates continued to hold back demand. Commercial real estate sales edged up. The nonfinancial services sector grew slightly overall, with Districts highlighting growth in leisure and hospitality and transportation, notably air travel. Truck freight volumes, however, were down. Financial service providers reported modest growth in lending and little change in asset quality overall, though lenders and community organizations voiced concerns about delinquencies among small businesses and lower-income households. Nonprofit social service agencies faced high demand amidst uncertainty about future funding levels. Agricultural conditions remained weak overall, with generally lower farm incomes and weather-related struggles in some areas. The spread of avian flu reduced egg supplies and pushed up prices. Energy activity was mixed. More contacts were optimistic about the outlook for 2025 than were pessimistic about it, though contacts in several Districts expressed concerns that changes in immigration and tariff policy could negatively affect the economy.
Labor Markets
Employment ticked up on balance, with six Districts reporting a slight increase and six reporting no change. Contacts in several service industries, notably healthcare, continued to see job growth. Construction employment increased slightly, while manufacturing employment was flat. Contacts across multiple sectors noted difficulty finding skilled workers, and reports of layoffs remained rare. However, contacts in some Districts expressed greater uncertainty about their future staffing needs. Wage growth picked up to a moderate pace in most Districts, though there were some reports that wage pressures had eased.
Prices
Prices increased modestly overall, with growth rates ranging from flat to moderate. Contacts in most Districts reported modest increases in selling prices, though there were instances of flat or decreasing prices as well, particularly in the retail and manufacturing sectors. Input costs also rose, with contacts highlighting higher insurance prices, particularly for health insurance. However, as with selling prices, there were several mentions of flat or lower input costs, particularly for fuel. Contacts expected prices to continue to rise in 2025, with some noting the potential for higher tariffs to contribute to price increases.
emphasis added
Part 2: Current State of the Housing Market; Overview for mid-January 2025
by Calculated Risk on 1/15/2025 12:42:00 PM
Today, in the Calculated Risk Real Estate Newsletter: Part 2: Current State of the Housing Market; Overview for mid-January 2025
A brief excerpt:
Yesterday, in Part 1: Current State of the Housing Market; Overview for mid-January 2025 I reviewed home inventory, housing starts and sales.There is much more in the article.
In Part 2, I will look at house prices, mortgage rates, rents and more.
...
The Case-Shiller National Index increased 3.6% year-over-year (YoY) in October and will be about the same YoY - or slightly higher - in the November report (based on other data).
...
Other measures of house prices suggest prices will be up about the same - or maybe a little higher - YoY in the November Case-Shiller index as in the October report.

Cleveland Fed: Median CPI increased 0.3% and Trimmed-mean CPI increased 0.3% in December
by Calculated Risk on 1/15/2025 11:11:00 AM
The Cleveland Fed released the median CPI and the trimmed-mean CPI.
According to the Federal Reserve Bank of Cleveland, the median Consumer Price Index rose 0.3% in December. The 16% trimmed-mean Consumer Price Index increased 0.3%. "The median CPI and 16% trimmed-mean CPI are measures of core inflation calculated by the Federal Reserve Bank of Cleveland based on data released in the Bureau of Labor Statistics’ (BLS) monthly CPI report".
 Click on graph for larger image.
This graph shows the year-over-year change for these four key measures of inflation.
On a year-over-year basis, the median CPI rose 3.8% (down from 3.9% YoY in November), the trimmed-mean CPI rose 3.2% (down slightly from 3.2%), and the CPI less food and energy rose 3.2% (down from 3.3%).
Core PCE is for November was up 2.8% YoY, up slightly from 2.8% in October.
YoY Measures of Inflation: Services, Goods and Shelter
by Calculated Risk on 1/15/2025 08:48:00 AM
Here are a few measures of inflation:
The first graph is the one Fed Chair Powell had mentioned when services less rent of shelter was up around 8% year-over-year. This declined, but is still elevated, and is now up 4.0% YoY.
 Click on graph for larger image.
This graph shows the YoY price change for Services and Services less rent of shelter through December 2024.
Services were up 4.4% YoY as of December 2024, down from 4.5% YoY in November.
Services less rent of shelter was up 4.0% YoY in December, down from 4.1% YoY in November
Services less rent of shelter was up 4.0% YoY in December, down from 4.1% YoY in November
 The second graph shows that goods prices started to increase year-over-year (YoY) in 2020 and accelerated in 2021 due to both strong demand and supply chain disruptions.
Durables were at -1.9% YoY as of December 2024, up from -2.0% YoY in November.
Commodities less food and energy commodities were at -0.5% YoY in December, up from -0.7% YoY in November.
Commodities less food and energy commodities were at -0.5% YoY in December, up from -0.7% YoY in November.
 Here is a graph of the year-over-year change in shelter from the CPI report (through December) and housing from the PCE report (through November)
Shelter was up 4.6% year-over-year in December, down from 4.8% in November. Housing (PCE) was up 4.8% YoY in November, down from 5.0% in October.
This is still catching up with private new lease data.
Core CPI ex-shelter was up 2.1% YoY in December.
BLS: CPI Increased 0.4% in December; Core CPI increased 0.2%
by Calculated Risk on 1/15/2025 08:30:00 AM
The Consumer Price Index for All Urban Consumers (CPI-U) increased 0.4 percent on a seasonally adjusted basis in December, after rising 0.3 percent in November, the U.S. Bureau of Labor Statistics reported today. Over the last 12 months, the all items index increased 2.9 percent before seasonal adjustment.The change in CPI was close to expectations. I'll post a graph later today after the Cleveland Fed releases the median and trimmed-mean CPI.
The index for energy rose 2.6 percent in December, accounting for over forty percent of the monthly all items increase. The gasoline index increased 4.4 percent over the month. The index for food also increased in December, rising 0.3 percent as both the index for food at home and the index for food away from home increased 0.3 percent each.
The index for all items less food and energy rose 0.2 percent in December, after increasing 0.3 percent in each of the previous 4 months. Indexes that increased in December include shelter, airline fares, used cars and trucks, new vehicles, motor vehicle insurance, and medical care. The indexes for personal care, communication, and alcoholic beverages were among the few major indexes that decreased over the month.
The all items index rose 2.9 percent for the 12 months ending December, after rising 2.7 percent over the 12 months ending November. The all items less food and energy index rose 3.2 percent over the last 12 months. The energy index decreased 0.5 percent for the 12 months ending December. The food index increased 2.5 percent over the last year.
emphasis added
MBA: Mortgage Applications Increased in Weekly Survey
by Calculated Risk on 1/15/2025 07:00:00 AM
From the MBA: Mortgage Applications Increase in Latest MBA Weekly Survey
Mortgage applications increased 33.3 percent from one week earlier, according to data from the Mortgage Bankers Association’s (MBA) Weekly Mortgage Applications Survey for the week ending January 10, 2025. Last week’s results included an adjustment for the New Year’s holiday.
The Market Composite Index, a measure of mortgage loan application volume, increased 33.3 percent on a seasonally adjusted basis from one week earlier. On an unadjusted basis, the Index increased 52 percent compared with the previous week. The Refinance Index increased 44 percent from the previous week and was 22 percent higher than the same week one year ago. The seasonally adjusted Purchase Index increased 27 percent from one week earlier. The unadjusted Purchase Index increased 48 percent compared with the previous week and was 2 percent lower than the same week one year ago.
“Bond yields in the U.S. and abroad continued to move higher in response to concerns over a sticky inflation outlook and still too-high budget deficits, which pushed mortgage rates higher for the fifth consecutive week. The 30-year fixed rate is now at 7.09 percent – its highest level since May 2024,” said Joel Kan, MBA’s Vice President and Deputy Chief Economist. “This time of the year is a particularly volatile time for application volumes, so it can be more helpful to focus on the level rather than the percent change. Purchase applications were 2 percent lower, and refinances were 22 percent higher compared to a year ago. Total applications were up by 33.3 percent, the highest level in a month, as both purchase and refinance applications saw large percentage increases over the week.”
...
The average contract interest rate for 30-year fixed-rate mortgages with conforming loan balances ($766,550 or less) increased to 7.09 percent from 6.99 percent, with points decreasing to 0.65 from 0.68 (including the origination fee) for 80 percent loan-to-value ratio (LTV) loans. The effective rate increased from last week.
emphasis added
 Click on graph for larger image.
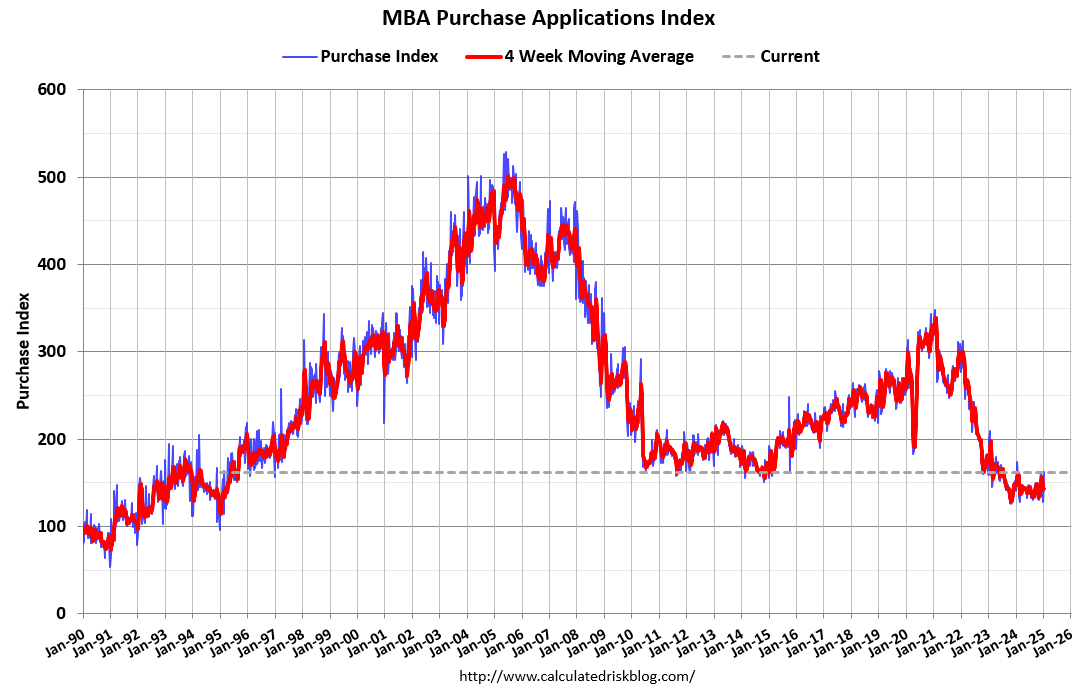
The first graph shows the MBA mortgage purchase index.
According to the MBA, purchase activity is down 2% year-over-year unadjusted.
Red is a four-week average (blue is weekly).
Purchase application activity is up about 29% from the lows in late October 2023 and is now 7% above the lowest levels during the housing bust.

The second graph shows the refinance index since 1990.
The refinance index is very low.
Tuesday, January 14, 2025
Wednesday: CPI, NY Fed Mfg, Beige Book
by Calculated Risk on 1/14/2025 07:49:00 PM
 Note: Mortgage rates are from MortgageNewsDaily.com and are for top tier scenarios.
Wednesday:
• At 7:00 AM ET, The Mortgage Bankers Association (MBA) will release the results for the mortgage purchase applications index.
• At 8:30 AM, The Consumer Price Index for December from the BLS. The consensus is for 0.3% increase in CPI, and a 0.2% increase in core CPI. The consensus is for CPI to be up 2.9% year-over-year and core CPI to be up 3.3% YoY.
• At 8:30 AM, The New York Fed Empire State manufacturing survey for January. The consensus is for a reading of -2.0, down from 0.2.
• At 2:00 PM, the Federal Reserve Beige Book, an informal review by the Federal Reserve Banks of current economic conditions in their Districts.
Two Bank Failures in 2024
by Calculated Risk on 1/14/2025 01:31:00 PM
There were four bank failures in 2024. The median number of failures since the FDIC was established in 1933 was 7 - so 2 failures in 2024 was below the median.
There were five bank failures in 2023, however 3 of the failures were larger banks: First Republic Bank, San Francisco, CA, Signature Bank, New York, NY, Silicon Valley Bank, Santa Clara, CA.
The first graph shows the number of bank failures per year since the FDIC was founded in 1933.
 Click on graph for larger image.
Typically about 7 banks fail per year.
Note: There were a large number of failures in the '80s and early '90s. Many of these failures were related to loose lending, especially for commercial real estate. Also, a large number of the failures in the '80s and '90s were in Texas with loose regulation.
Even though there were more failures in the '80s and early '90s than during the financial crisis, the financial crisis was much worse (larger banks failed and were bailed out).
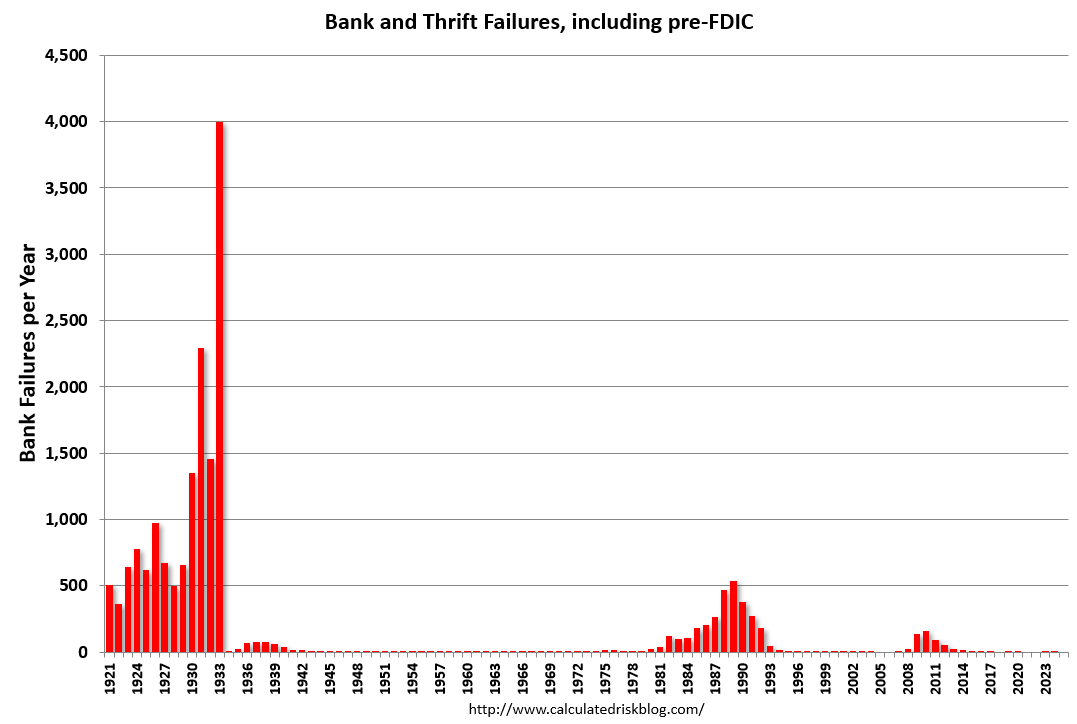 The second graph includes pre-FDIC failures. In a typical year - before the Depression - 500 banks would fail and the depositors would lose a large portion of their savings.
Then, during the Depression, thousands of banks failed. Note that the S&L crisis and recent financial crisis look small on this graph.


