 RSS Feed
 by Calculated Risk on 12/02/2024 10:45:00 AM
Monday, December 02, 2024
Construction Spending Increased 0.4% in October
From the Census Bureau reported that overall construction spending increased:
Construction spending during October 2024 was estimated at a seasonally adjusted annual rate of $2,174.0 billion, 0.4 percent above the revised September estimate of $2,164.7 billion. The October figure is 5.0 percent above the October 2023 estimate of $2,071.1 billion.Private spending increased and public spending decreased:
emphasis added
Spending on private construction was at a seasonally adjusted annual rate of $1,676.4 billion, 0.7 percent above the revised September estimate of $1,664.7 billion. ...
In October, the estimated seasonally adjusted annual rate of public construction spending was $497.6 billion, 0.5 percent below the revised September estimate of $500.0 billion.
 Click on graph for larger image.
This graph shows private residential and nonresidential construction spending, and public spending, since 1993. Note: nominal dollars, not inflation adjusted.
Residential (red) spending is 4.7% below the peak in 2022.
Non-residential (blue) spending is 0.5% below the peak in June 2024.
Public construction spending is 0.5% below the peak in September 2024.
 The second graph shows the year-over-year change in construction spending.
On a year-over-year basis, private residential construction spending is up 6.4%. Non-residential spending is up 3.5% year-over-year. Public spending is up 4.5% year-over-year.
This was above consensus expectations and spending for the previous two months was revised up.
ISM® Manufacturing index Increased to 48.4% in November
by Calculated Risk on 12/02/2024 10:00:00 AM
(Posted with permission). The ISM manufacturing index indicated expansion. The PMI® was at 48.4% in November, up from 46.5% in October. The employment index was at 48.1%, up from 44.4% the previous month, and the new orders index was at 50.4%, up from 47.1%.
From ISM: Manufacturing PMI® at 48.4% November 2024 Manufacturing ISM® Report On Business®
Economic activity in the manufacturing sector contracted in November for the eighth consecutive month and the 24th time in the last 25 months, say the nation's supply executives in the latest Manufacturing ISM® Report On Business®.This suggests manufacturing contracted in November. This was above the consensus forecast.
The report was issued today by Timothy R. Fiore, CPSM, C.P.M., Chair of the Institute for Supply Management® (ISM®) Manufacturing Business Survey Committee:
“The Manufacturing PMI® registered 48.4 percent in November, 1.9 percentage points higher compared to the 46.5 percent recorded in October. The overall economy continued in expansion for the 55th month after one month of contraction in April 2020. (A Manufacturing PMI® above 42.5 percent, over a period of time, generally indicates an expansion of the overall economy.) The New Orders Index returned to expansion, albeit weakly, after seven months of contraction, registering 50.4 percent, 3.3 percentage points higher than the 47.1 percent recorded in October. The November reading of the Production Index (46.8 percent) is 0.6 percentage point higher than October’s figure of 46.2 percent. The Prices Index continued in expansion (or ‘increasing’) territory, registering 50.3 percent, down 4.5 percentage points compared to the reading of 54.8 percent in October. The Backlog of Orders Index registered 41.8 percent, down 0.5 percentage point compared to the 42.3 percent recorded in October. The Employment Index registered 48.1 percent, up 3.7 percentage points from October’s figure of 44.4 percent.
emphasis added
Housing Dec 2nd Weekly Update: Inventory down 1.7% Week-over-week, Up 27.1% Year-over-year
by Calculated Risk on 12/02/2024 08:11:00 AM
Altos reports that active single-family inventory was down 1.7% week-over-week. Inventory is now 4.4% below the peak for the year (6 weeks ago).
Inventory will now decline seasonally until early next year.
The first graph shows the seasonal pattern for active single-family inventory since 2015.
 Click on graph for larger image.
The red line is for 2024. The black line is for 2019.
Inventory was up 27.1% compared to the same week in 2023 (last week it was up 27.1%), and down 17.2% compared to the same week in 2019 (last week it was down 17.5%).
Back in June 2023, inventory was down almost 54% compared to 2019, so the gap to more normal inventory levels is closing!
 This second inventory graph is courtesy of Altos Research.
As of Nov 29th, inventory was at 707 thousand (7-day average), compared to 719 thousand the prior week.
Mike Simonsen discusses this data regularly on Youtube.
Sunday Night Futures
by Calculated Risk on 12/02/2024 01:18:00 AM
Weekend:
• Schedule for Week of December 1, 2024
Monday:
• At 10:00 AM ET, ISM Manufacturing Index for November. The consensus is for 47.5%, up from 46.5%.
• Also at 10:00 AM, Construction Spending for October. The consensus is for 0.2% increase in spending.
• All day, Light vehicle sales for November.
From CNBC: Pre-Market Data and Bloomberg futures S&P 500 are down 9 and DOW futures are down 45 (fair value).
Oil prices were down over the last week with WTI futures at $68.43 per barrel and Brent at $72.31 per barrel. A year ago, WTI was at $74, and Brent was at $79 - so WTI oil prices are down about 10% year-over-year.
Here is a graph from Gasbuddy.com for nationwide gasoline prices. Nationally prices are at $3.00 per gallon. A year ago, prices were at $3.25 per gallon, so gasoline prices are down $0.25 year-over-year.
Saturday, November 30, 2024
Real Estate Newsletter Articles this Week: National House Price Index Up 3.9% year-over-year in September
by Calculated Risk on 11/30/2024 02:11:00 PM
At the Calculated Risk Real Estate Newsletter this week:
 Click on graph for larger image.
• Case-Shiller: National House Price Index Up 3.9% year-over-year in September
• New Home Sales Decrease Sharply to 610,000 Annual Rate in October
• Fannie and Freddie: Single Family and Multi-Family Serious Delinquency Rates Increased in October
• Final Look at Local Housing Markets in October and a Look Ahead to November Sales
This is usually published 4 to 6 times a week and provides more in-depth analysis of the housing market.
Schedule for Week of December 1, 2024
by Calculated Risk on 11/30/2024 08:11:00 AM
The key report this week is the November employment report on Friday.
Other key indicators include the October Trade Deficit, the November ISM manufacturing index and November vehicle sales.
10:00 AM: ISM Manufacturing Index for November. The consensus is for 47.5%, up from 46.5%.
10:00 AM: Construction Spending for October. The consensus is for 0.2% increase in spending.
 All day: Light vehicle sales for November.
The consensus is for 16.0 million SAAR in November, unchanged from the BEA estimate of 16.04 million SAAR in October (Seasonally Adjusted Annual Rate).
This graph shows light vehicle sales since the BEA started keeping data in 1967.
The dashed line is the current sales rate.
----- Tuesday, December 3rd -----
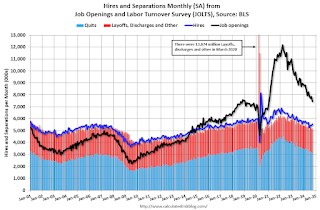 10:00 AM: Job Openings and Labor Turnover Survey for October from the BLS.
This graph shows job openings (black line), hires (purple), Layoff, Discharges and other (red column), and Quits (light blue column) from the JOLTS.
Jobs openings decreased in September to 7.44 million from 7.86 million in August.
The number of job openings (black) were down 20% year-over-year. Quits were down 15% year-over-year.
----- Wednesday, December 4th -----
7:00 AM ET: The Mortgage Bankers Association (MBA) will release the results for the mortgage purchase applications index.
8:15 AM: The ADP Employment Report for November. This report is for private payrolls only (no government). The consensus is for 166,000 jobs added, down from 233,000 in October.
10:00 AM: the ISM Services Index for November. The consensus is for 55.5, down from 56.0.
1:45 PM: Discussion, Fed Chair Jerome Powell, Moderated Discussion, At the New York Times DealBook Summit, New York, N.Y.
2:00 PM: the Federal Reserve Beige Book, an informal review by the Federal Reserve Banks of current economic conditions in their Districts.
----- Thursday, December 5th -----
8:30 AM: The initial weekly unemployment claims report will be released. The consensus is for 220 thousand initial claims, up from 213 thousand last week.
 8:30 AM: Trade Balance report for October from the Census Bureau.
This graph shows the U.S. trade deficit, with and without petroleum, through the most recent report. The blue line is the total deficit, and the black line is the petroleum deficit, and the red line is the trade deficit ex-petroleum products.
The consensus is the trade deficit to be $78.8 billion. The U.S. trade deficit was at $84.4 billion in September.
----- Friday, December 6th -----
 8:30 AM: Employment Report for November. The consensus is for 183,000 jobs added, and for the unemployment rate to be unchanged at 4.1%.
There were 12,000 jobs added in October, and the unemployment rate was at 4.1%.
This graph shows the jobs added per month since January 2021.
10:00 AM: University of Michigan's Consumer sentiment index (Preliminary for December).
 10:00 AM: Job Openings and Labor Turnover Survey for October from the BLS.
 This graph shows job openings (black line), hires (purple), Layoff, Discharges and other (red column), and Quits (light blue column) from the JOLTS.
Jobs openings decreased in September to 7.44 million from 7.86 million in August.
The number of job openings (black) were down 20% year-over-year. Quits were down 15% year-over-year.
7:00 AM ET: The Mortgage Bankers Association (MBA) will release the results for the mortgage purchase applications index.
8:15 AM: The ADP Employment Report for November. This report is for private payrolls only (no government). The consensus is for 166,000 jobs added, down from 233,000 in October.
10:00 AM: the ISM Services Index for November. The consensus is for 55.5, down from 56.0.
1:45 PM: Discussion, Fed Chair Jerome Powell, Moderated Discussion, At the New York Times DealBook Summit, New York, N.Y.
2:00 PM: the Federal Reserve Beige Book, an informal review by the Federal Reserve Banks of current economic conditions in their Districts.
8:30 AM: The initial weekly unemployment claims report will be released. The consensus is for 220 thousand initial claims, up from 213 thousand last week.
 8:30 AM: Trade Balance report for October from the Census Bureau.
 This graph shows the U.S. trade deficit, with and without petroleum, through the most recent report. The blue line is the total deficit, and the black line is the petroleum deficit, and the red line is the trade deficit ex-petroleum products.
The consensus is the trade deficit to be $78.8 billion. The U.S. trade deficit was at $84.4 billion in September.
 8:30 AM: Employment Report for November. The consensus is for 183,000 jobs added, and for the unemployment rate to be unchanged at 4.1%.
There were 12,000 jobs added in October, and the unemployment rate was at 4.1%.
This graph shows the jobs added per month since January 2021.
10:00 AM: University of Michigan's Consumer sentiment index (Preliminary for December).
Friday, November 29, 2024
Hotels: Occupancy Rate Increased 21.7% Year-over-year due to Timing of Thanksgiving
by Calculated Risk on 11/29/2024 12:21:00 PM
Due to the Thanksgiving calendar shift, the U.S. hotel industry reported higher year-over-year performance comparisons, according to CoStar’s latest data through 23 November. ...The following graph shows the seasonal pattern for the hotel occupancy rate using the four-week average.
17-23 November 2024 (percentage change from comparable week in 2023):
• Occupancy: 59.7% (+20.7%)
• Average daily rate (ADR): US$150.49 (+8.6%)
• Revenue per available room (RevPAR): US$89.80 (+31.1%)
emphasis added
 Click on graph for larger image.
The red line is for 2024, blue is the median, and dashed light blue is for 2023. Dashed purple is for 2018, the record year for hotel occupancy.
The 4-week average of the occupancy rate is above both last year and the median rate for the period 2000 through 2023 (Blue) - and will likely finish mostly unchanged year-over-year.
Note: Y-axis doesn't start at zero to better show the seasonal change.
The 4-week average of the occupancy rate has peaked for the fall business travel season and will decline seasonally through the holidays. Note: Occupancy will be down sharply next week due to the timing of Thanksgiving (the reverse of this week).
Q4 GDP Tracking: Mid 2% Range
by Calculated Risk on 11/29/2024 09:11:00 AM
From Goldman:
Following [Wednesday]’s data, we have left our Q4 GDP tracking estimate unchanged at +2.4% (quarter-over-quarter annualized) and our Q4 domestic final sales forecast unchanged at +2.0%. [Nov 27th estimate]And from the Atlanta Fed: GDPNow
The GDPNow model estimate for real GDP growth (seasonally adjusted annual rate) in the fourth quarter of 2024 is 2.7 percent on November 27, up from 2.6 percent on November 19. After this morning's personal income and outlays release from the US Bureau of Economic Analysis, the nowcast of fourth-quarter real personal consumption expenditures growth increased from 2.8 percent to 3.0 percent. [Nov 27th estimate]
Thursday, November 28, 2024
Five Economic Reasons to be Thankful
by Calculated Risk on 11/28/2024 08:47:00 AM
Here are five economic reasons to be thankful this Thanksgiving. (Hat Tip to Neil Irwin who started doing this years ago)
1) The Unemployment Rate is at 4.1%
 The unemployment rate was at 4.1% in October.
The unemployment rate is down from 14.7% in April 2020 (the highest rate since the Great Depression).
The unemployment rate is up from 3.4% in April 2023 - and that matched the lowest unemployment rate since 1969!
The unemployment rate is up from 3.4% in April 2023 - and that matched the lowest unemployment rate since 1969!
This is a historically low unemployment rate.
2) Low unemployment claims.
 This graph shows the 4-week moving average of weekly claims since 1971.
The percent of loans in the foreclosure process are close to the record low.
5) Household Debt burdens at Low Levels (ex-pandemic)
 This graph, based on data from the Federal Reserve, shows the Household Debt Service Ratio (DSR), and the DSR for mortgages (blue) and consumer debt (yellow).
2) Low unemployment claims.
 This graph shows the 4-week moving average of weekly claims since 1971.
Weekly claims were at 213,000 last week.
The dashed line on the graph is the current 4-week average.
The dashed line on the graph is the current 4-week average.
Even though weekly claims have bounced around a little recently, the 4-week average is close to the lowest level in 50 years.
3) Mortgage Debt as a Percent of GDP has Fallen Significantly
 This graph shows household mortgage debt as a percent of GDP.
3) Mortgage Debt as a Percent of GDP has Fallen Significantly
 This graph shows household mortgage debt as a percent of GDP.
 Note this graph is through Q2 2024 was impacted by the sharp decline in Q2 2020 GDP.
Mortgage debt is up $2.34 trillion from the peak during the housing bubble, but, as a percent of GDP is at 45.9% - down from Q1 - and down from a peak of 73.3% of GDP during the housing bust.
4) Mortgage Delinquency Rate Near the Lowest Level since at least 1979

Mortgage debt is up $2.34 trillion from the peak during the housing bubble, but, as a percent of GDP is at 45.9% - down from Q1 - and down from a peak of 73.3% of GDP during the housing bust.
4) Mortgage Delinquency Rate Near the Lowest Level since at least 1979

This graph, based on data from the MBA through Q3 2024, shows the percent of loans delinquent by days past due.
Although mortgage delinquencies are up a little from Q2 2023 - the lowest level since the MBA survey started in 1979 - delinquencies are still historically very low.
Note: The sharp increase in 2020 in the 90-day bucket was due to loans in forbearance (included as delinquent but not reported to the credit bureaus).
The percent of loans in the foreclosure process are close to the record low.
5) Household Debt burdens at Low Levels (ex-pandemic)
 This graph, based on data from the Federal Reserve, shows the Household Debt Service Ratio (DSR), and the DSR for mortgages (blue) and consumer debt (yellow).
The Household debt service ratio was at 11.5% in Q2 2024, slightly below the pre-pandemic level of 11.6%.
The DSR for mortgages (blue) has increased recently but is close to the pre-pandemic level.
This data suggests aggregate household cash flow is in a solid position.
This data suggests aggregate household cash flow is in a solid position.
Happy Thanksgiving to All!
Wednesday, November 27, 2024
Realtor.com Reports Active Inventory Up 26.5% YoY
by Calculated Risk on 11/27/2024 05:16:00 PM
What this means: On a weekly basis, Realtor.com reports the year-over-year change in active inventory and new listings. On a monthly basis, they report total inventory. For October, Realtor.com reported inventory was up 29.2% YoY, but still down 21.1% compared to the 2017 to 2019 same month levels.
Now - on a weekly basis - inventory is up 26.5% YoY.
Realtor.com has monthly and weekly data on the existing home market. Here is their weekly report: Weekly Housing Trends View—Data for Week Ending Nov. 23, 2024 Here is a graph of the year-over-year change in inventory according to realtor.com.
Inventory was up year-over-year for the 55th consecutive week.
Realtor.com has monthly and weekly data on the existing home market. Here is their weekly report: Weekly Housing Trends View—Data for Week Ending Nov. 23, 2024
• Active inventory increased, with for-sale homes 26.5% above year-ago levels
For the 55th consecutive week, the number of homes for sale has increased compared to the same time last year. The nationwide market is slowly rebounding to pre-pandemic levels of inventory. Buyers currently have far more options than they did a few years ago, but with prices and mortgage rates remaining high, not as many of them are within their budget. New listings showed a much more modest increase, so most of this inventory growth is the result of homes sitting on the market for longer.
• New listings—a measure of sellers putting homes up for sale—climbed 2.8% this week compared with one year ago
The number of newly listed homes for sale continued to grow this week, the fourth in a row with year-over-year new listing growth over 1.5%. This is an encouraging sign that even amid a high mortgage rate environment, some sellers are willing to list their homes and make a move. We’ve talked extensively about the lock-in effect, where homeowners who secured a low-rate mortgage in recent years are reluctant to move out and give that favorable financing up, and there are only two cures for this issue. The first, lower mortgage rates, doesn’t appear to be coming any time soon. The second, time, is finally starting to take effect, as the simple reality that people eventually have to move will force new homes onto the market even if their sellers don’t love the mortgage rate they’ll get on their next purchase.
 Here is a graph of the year-over-year change in inventory according to realtor.com.
 Inventory was up year-over-year for the 55th consecutive week.
However, inventory is still historically low.
New listings remain below typical pre-pandemic levels.

In Memoriam: Doris "Tanta" Dungey


| Privacy Policy |
| Copyright © 2007 - 2025 CR4RE LLC |
| Excerpts NOT allowed on x.com |