 RSS Feed
 by Calculated Risk on 11/05/2024 08:30:00 AM
Tuesday, November 05, 2024
Trade Deficit Increased to $84.4 Billion in September
The Census Bureau and the Bureau of Economic Analysis reported:
The U.S. Census Bureau and the U.S. Bureau of Economic Analysis announced today that the goods and services deficit was $84.4 billion in September, up $13.6 billion from $70.8 billion in August, revised.
September exports were $267.9 billion, $3.2 billion less than August exports. September imports were $352.3 billion, $10.3 billion more than August imports
emphasis added
 Click on graph for larger image.
Exports decreased and imports increased in September.
Exports are up 2.4% year-over-year; imports are up 8.8% year-over-year.
Both imports and exports decreased sharply due to COVID-19 and then bounced back - imports and exports have generally increased recently.
The second graph shows the U.S. trade deficit, with and without petroleum.
 The blue line is the total deficit, and the black line is the petroleum deficit, and the red line is the trade deficit ex-petroleum products.
Note that net, exports of petroleum products are positive and have been increasing.
The trade deficit with China increased to $31.8 billion from $28.4 billion a year ago.
It is possible some importers are trying to beat potential tariffs.
Monday, November 04, 2024
Tuesday: U.S. Election, Trade Deficit, ISM Services
by Calculated Risk on 11/04/2024 06:38:00 PM
 From Matthew Graham at Mortgage News Daily: Mortgage Rates Start Week Slightly Lower as Election Volatility Works Both Ways
Love it or hate it, election-related volatility has been having a big impact on the bond market and, thus, mortgage rates.Tuesday:
...
Mortgage rates didn't react in an extreme fashion, but the average lender moved back down toward 7% for a top tier conventional 30yr fixed scenario. The same scenario was closer to 7.125% late last week. [30 year fixed 7.05%]
emphasis added
• U.S. Election
• At 8:30 AM ET, Trade Balance report for September from the Census Bureau. The consensus is for the deficit to be $73.5 billion in September, from $70.4 billion in August.
• At 10:00 AM, the ISM Services Index for October. The consensus is for a decrease to 53.3 from 54.9.
Construction Spending Increased 0.1% in September
by Calculated Risk on 11/04/2024 02:06:00 PM
This was released on Friday. From the Census Bureau reported that overall construction spending decreased:
Construction spending during September 2024 was estimated at a seasonally adjusted annual rate of $2,148.8 billion, 0.1 percent above the revised August estimate of $2,146.0 billion. The September figure is 4.6 percent above the September 2023 estimate of $2,055.2 billion.Private spending was unchanged and public spending increased:
emphasis added
Spending on private construction was at a seasonally adjusted annual rate of $1,653.6 billion, virtually unchanged from the revised August estimate of $1,653.2 billion. ...
In September, the estimated seasonally adjusted annual rate of public construction spending was $495.2 billion, 0.5 percent above the revised August estimate of $492.9 billion.
 Click on graph for larger image.
This graph shows private residential and nonresidential construction spending, and public spending, since 1993. Note: nominal dollars, not inflation adjusted.
Residential (red) spending is 6.8% below the peak in 2022.
Non-residential (blue) spending is 0.8% below the peak in June 2024.
Public construction spending is at the peak.
 The second graph shows the year-over-year change in construction spending.
On a year-over-year basis, private residential construction spending is up 4.1%. Non-residential spending is up 3.5% year-over-year. Public spending is up 7.0% year-over-year.
This was close to consensus expectations of no change in spending.
ICE Mortgage Monitor: "Annual home price growth cooled for the seventh consecutive month"
by Calculated Risk on 11/04/2024 10:51:00 AM
Today, in the Real Estate Newsletter: ICE Mortgage Monitor: "Annual home price growth cooled for the seventh consecutive month"
Brief excerpt:
One of the key metrics to watch for mortgage stress is early-stage delinquencies. These are borrowers that are delinquent within 6 months of origination. This was one of the obvious warning signs during the housing bubble.There is much more in the newsletter.
There has been a steady increase in early-stage delinquencies for VA loans.
• Early-stage delinquencies – borrowers already past due six months after origination – have been gradually rising as well, most notably among VA originationsNote that national mortgage performance is being impacted by the hurricanes.
• Overall, 1.7% of 2024 vintage originations have been delinquent six months after origination, the highest share for any vintage since 2008 – outside of pandemic-era payment shocks

Housing Nov 4th Weekly Update: Inventory Unchanged Week-over-week, Up 29.8% Year-over-year
by Calculated Risk on 11/04/2024 08:11:00 AM
Altos reports that active single-family inventory was unchanged week-over-week.
The first graph shows the seasonal pattern for active single-family inventory since 2015.
 Click on graph for larger image.
The red line is for 2024. The black line is for 2019.
Inventory was up 29.8% compared to the same week in 2023 (last week it was up 30.8%), and down 19.4% compared to the same week in 2019 (last week it was down 20.7%).
Back in June 2023, inventory was down almost 54% compared to 2019, so the gap to more normal inventory levels is more than half closed.
 This second inventory graph is courtesy of Altos Research.
As of Nov 1st, inventory was at 736 thousand (7-day average), compared to 736 thousand the prior week.
Mike Simonsen discusses this data regularly on Youtube.
Sunday, November 03, 2024
Sunday Night Futures
by Calculated Risk on 11/03/2024 08:19:00 PM
Weekend:
• Schedule for Week of November 3, 2024
Monday:
• No major economic releases scheduled.
From CNBC: Pre-Market Data and Bloomberg futures S&P 500 are down 8 and DOW futures are down 168 (fair value).
Oil prices were down over the last week with WTI futures at $69.49 per barrel and Brent at $71.10 per barrel. A year ago, WTI was at $81, and Brent was at $88 - so WTI oil prices are down about 14% year-over-year.
Here is a graph from Gasbuddy.com for nationwide gasoline prices. Nationally prices are at $3.06 per gallon. A year ago, prices were at $3.40 per gallon, so gasoline prices are down $0.34 year-over-year.
FOMC Preview: Fed to Cut Rates 25bp
by Calculated Risk on 11/03/2024 09:59:00 AM
Most analysts expect the FOMC will cut the federal funds rate at the meeting this week by 25bp lowering the target range to 4 1/2 to 4 3/4 percent.
Currently almost all market participants are expecting a 25bp cut this week. Market participants are also pricing in another 25bp cut in December.
From BofA:
We expect the Fed to cut rates by 25bp in November. ... Chair Powell’s message in the press conference should remain optimistic, particularly given the recent robust data flow. Powell is likely to emphasize data dependence once again, and provide little forward guidance about the policy path.From Goldman:
emphasis added
We continue to expect the FOMC to lower the fed funds rate by 25bp at the November and December meetings.
Projections will NOT be released at this meeting. For review, here are the September projections.
The FOMC will look through the employment report released Friday because of the impact of hurricanes and the Boeing strike on job gains in October.
The BEA's second estimate for Q3 GDP showed real growth at 2.8% annualized, following 3.0% annualized real growth in Q2, and 1.6% in Q1. Current estimates for Q4 GDP are around 2.6%. That would put real growth in 2024, Q4 over Q4, at 2.5% - well above the top end of the September FOMC projections.
| GDP projections of Federal Reserve Governors and Reserve Bank presidents, Change in Real GDP1 | ||||
|---|---|---|---|---|
| Projection Date | 2024 | 2025 | 2026 | 2027 |
| Sept 2024 | 1.9 to 2.1 | 1.8 to 2.2 | 1.9 to 2.3 | 1.8 to 2.1 |
| June 2024 | 1.9 to 2.3 | 1.8 to 2.2 | 1.8 to 2.1 | --- |
The unemployment rate was at 4.1% in October. This is below the low end of the September projections.
| Unemployment projections of Federal Reserve Governors and Reserve Bank presidents, Unemployment Rate2 | ||||
|---|---|---|---|---|
| Projection Date | 2024 | 2025 | 2026 | 2027 |
| Sept 2024 | 4.3 to 4.4 | 4.2 to 4.5 | 4.0 to 4.4 | 4.0 to 4.4 |
| June 2024 | 3.9 to 4.2 | 3.9 to 4.3 | 3.9 to 4.3 | --- |
As of September 2024, PCE inflation increased 2.1 percent year-over-year (YoY). This is below the low end of the September projections.
| Inflation projections of Federal Reserve Governors and Reserve Bank presidents, PCE Inflation1 | ||||
|---|---|---|---|---|
| Projection Date | 2024 | 2025 | 2026 | 2027 |
| Sept 2024 | 2.2 to 2.4 | 2.1 to 2.2 | 2.0 | 2.0 |
| June 2024 | 2.5 to 2.9 | 2.2 to 2.4 | 2.0 to 2.1 | --- |
PCE core inflation increased 2.7 percent YoY in September. This is in the range of FOMC projections for Q4.
| Core Inflation projections of Federal Reserve Governors and Reserve Bank presidents, Core Inflation1 | ||||
|---|---|---|---|---|
| Projection Date | 2024 | 2025 | 2026 | 2027 |
| Sept 2024 | 2.6 to 2.7 | 2.1 to 2.3 | 2.0 | 2.0 |
| June 2024 | 2.8 to 3.0 | 2.3 to 2.4 | 2.0 to 2.1 | --- |
November 1st COVID Update: Wastewater Measure Continues to Decline
by Calculated Risk on 11/03/2024 07:11:00 AM
 Note: Mortgage rates are from MortgageNewsDaily.com and are for top tier scenarios.
For deaths, I'm currently using 4 weeks ago for "now", since the most recent three weeks will be revised significantly.
Note: "Effective May 1, 2024, hospitals are no longer required to report COVID-19 hospital admissions, hospital capacity, or hospital occupancy data." So I'm no longer tracking hospitalizations.
| COVID Metrics | ||||
|---|---|---|---|---|
| Now | Week Ago | Goal | ||
| Deaths per Week | 905 | 985 | ≤3501 | |
| 1my goals to stop weekly posts, 🚩 Increasing number weekly for Deaths ✅ Goal met. | ||||
 Click on graph for larger image.
This graph shows the weekly (columns) number of deaths reported.
Although weekly deaths met the original goal to stop posting, I'm continuing to post now that deaths are above the goal again.
Weekly deaths are triple the low of 302 in early June but are now declining and will likely continue to decline based on wastewater sampling.
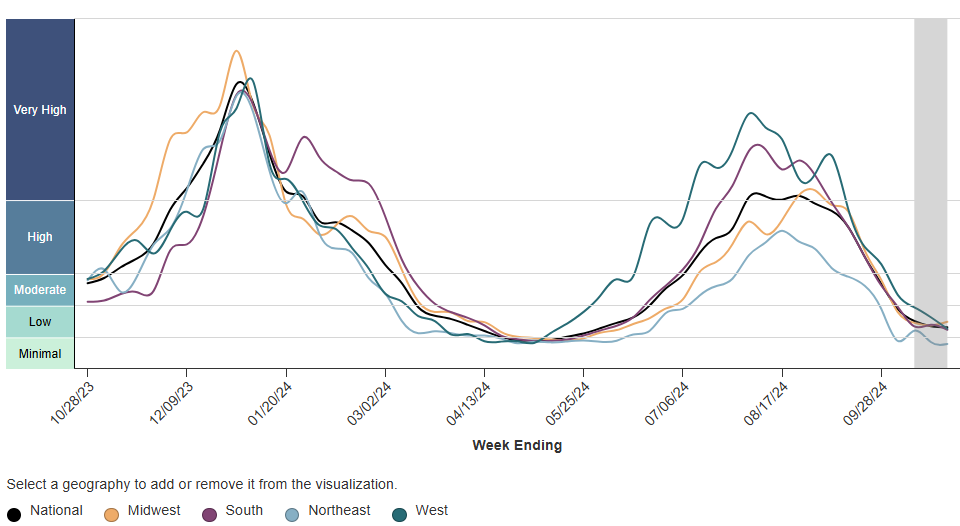 This appears to be a leading indicator for COVID hospitalizations and deaths.
COVID in wastewater is declining - only about 50% higher than the lows of last May - suggesting weekly deaths will continue to decline.
Saturday, November 02, 2024
Real Estate Newsletter Articles this Week: Case-Shiller: National House Price Index Up 4.2% year-over-year in August
by Calculated Risk on 11/02/2024 02:11:00 PM
At the Calculated Risk Real Estate Newsletter this week:
 Click on graph for larger image.
• Case-Shiller: National House Price Index Up 4.2% year-over-year in August
• Fannie and Freddie: Single Family and Multi-Family Serious Delinquency Rates Increased in September
• Inflation Adjusted House Prices 1.5% Below 2022 Peak
• Freddie Mac House Price Index Increased in September; Up 3.6% Year-over-year
• Lawler: Mortgage Rates Have Surged Since the Federal Reserve Cut Interest Rates Last Month
• A Proposal to Address the Housing Crisis
This is usually published 4 to 6 times a week and provides more in-depth analysis of the housing market.
Schedule for Week of November 3, 2024
by Calculated Risk on 11/02/2024 08:11:00 AM
The FOMC meets this week and is expected to cut rates.
No major economic releases scheduled.
All day: U.S. Election
 8:30 AM: Trade Balance report for September from the Census Bureau. The consensus is for the deficit to be $73.5 billion in September, from $70.4 billion in August.
This graph shows the U.S. trade deficit, with and without petroleum, through the most recent report.
The blue line is the total deficit, and the black line is the petroleum deficit, and the red line is the trade deficit ex-petroleum products.
10:00 AM: the ISM Services Index for October. The consensus is for a decrease to 53.3 from 54.9.
7:00 AM ET: The Mortgage Bankers Association (MBA) will release the results for the mortgage purchase applications index.
8:30 AM: The initial weekly unemployment claims report will be released. The consensus is for 224 thousand initial claims, up from 216 thousand last week.
2:00 PM: FOMC Meeting Announcement. The Fed is expected to cut rates 25bp at this meeting.
2:30 PM: Fed Chair Jerome Powell holds a press briefing following the FOMC announcement.
10:00 AM: University of Michigan's Consumer sentiment index (Preliminary for November).


