 RSS Feed
 by Calculated Risk on 5/24/2024 11:16:00 AM
Friday, May 24, 2024
Watch Months-of-Supply!
Today, in the Calculated Risk Real Estate Newsletter: Watch Months-of-Supply!
A brief excerpt:
Although inventory is well below normal levels, so are sales. I think we need to keep an eye on months-of-supply. Historically nominal prices declined when months-of-supply approached 6 months - and that is unlikely this year - but we could see months-of-supply back to 2019 levels later this year.There is much more in the article.
What would it take to get months-of-supply back to 2019 levels by mid-year? The following table is a simple exercise. If sales stay depressed at 2023 levels, how much would inventory have to increase to put months-of-supply at 2019 levels?
Hotels: Occupancy Rate Increased 0.2% Year-over-year
by Calculated Risk on 5/24/2024 11:01:00 AM
The U.S. hotel industry reported higher performance from the previous week and positive comparisons year over year, according to CoStar’s latest data through 18 May. ...The following graph shows the seasonal pattern for the hotel occupancy rate using the four-week average.
12-18 May 2024 (percentage change from comparable week in 2023):
• Occupancy: 67.4% (+0.2%)
• Average daily rate (ADR): US$163.11 (+2.6%)
• Revenue per available room (RevPAR): US$109.93 (+2.8%)
emphasis added
 Click on graph for larger image.
The red line is for 2024, black is 2020, blue is the median, and dashed light blue is for 2023. Dashed purple is for 2018, the record year for hotel occupancy.
The 4-week average of the occupancy rate is tracking last year, and slightly above the median rate for the period 2000 through 2023 (Blue).
Note: Y-axis doesn't start at zero to better show the seasonal change.
The 4-week average of the occupancy rate will increase seasonally when the summer travel season begins.
May Vehicle Sales Forecast: 15.8 million SAAR, Up 2% YoY
by Calculated Risk on 5/24/2024 08:12:00 AM
From WardsAuto: May U.S. Light-Vehicle Sales Tracking to Annualized Rate Flat with April (pay content). Brief excerpt:
There is a good possibility sales end May above expectations, depending on much holiday marketing pulls in additional buyers. Second-quarter sales are pegged at a 15.9 million-unit SAAR, with volume rising 1% from the year-ago period.
emphasis added
 Click on graph for larger image.
This graph shows actual sales from the BEA (Blue), and Wards forecast for May (Red).
On a seasonally adjusted annual rate basis, the Wards forecast of 15.8 million SAAR, would be up 0.4% from last month, and up 1.8% from a year ago.
Thursday, May 23, 2024
Friday: Durable Goods
by Calculated Risk on 5/23/2024 07:09:00 PM
 Note: Mortgage rates are from MortgageNewsDaily.com and are for top tier scenarios.
Friday:
• At 8:30 AM ET, Durable Goods Orders for April from the Census Bureau. The consensus is for a 0.6% decrease in durable goods orders.
• At 10:00 AM, University of Michigan's Consumer sentiment index (Final for May). The consensus is for a reading of 67.4.
Realtor.com Reports Active Inventory Up 35.5% YoY; Most Homes For Sale Since July 2020
by Calculated Risk on 5/23/2024 04:15:00 PM
What this means: On a weekly basis, Realtor.com reports the year-over-year change in active inventory and new listings. On a monthly basis, they report total inventory. For April, Realtor.com reported inventory was up 30.4% YoY, but still down almost 36% compared to April 2017 to 2019 levels.
Now - on a weekly basis - inventory is up 35.5% YoY.
Realtor.com has monthly and weekly data on the existing home market. Here is their weekly report: Weekly Housing Trends View—Data for Week Ending May 18, 2024 Here is a graph of the year-over-year change in inventory according to realtor.com.
Inventory was up year-over-year for the 28th consecutive week.
Realtor.com has monthly and weekly data on the existing home market. Here is their weekly report: Weekly Housing Trends View—Data for Week Ending May 18, 2024
• Active inventory increased, with for-sale homes 35.5% above year-ago levels
For the 28th straight week, there were more homes listed for sale versus the prior year, giving homebuyers more options.
This past week, the inventory of homes for sale grew by 35.5% compared with last year, and it was the highest since July 2020 in the early days of the COVID-19 Pandemic. This growth in inventory is primarily driven by housing markets in the South, which saw a 43.0% year-over-year increase in inventory in April.
• New listings–a measure of sellers putting homes up for sale–were up this week, by 8.1% from one year ago.
Seller activity continued to climb annually last week and accelerated relative to the previous week’s growth. Newly listed homes grew by 8.1% compared with a year ago, an acceleration from the 6.6% growth rate in the previous week.
 Here is a graph of the year-over-year change in inventory according to realtor.com.
 Inventory was up year-over-year for the 28th consecutive week.
However, inventory is still historically very low.
New listings remain below typical pre-pandemic levels although up year-over-year.
New Home Sales Decrease to 634,000 Annual Rate in April
by Calculated Risk on 5/23/2024 01:55:00 PM
Today, in the Calculated Risk Real Estate Newsletter: New Home Sales Decrease to 634,000 Annual Rate in April
Brief excerpt:
Note: there were some seasonal revisions back to 2019, and significant changes to house prices and price distribution in this release.There is much more in the article.
The Census Bureau reports New Home Sales in April were at a seasonally adjusted annual rate (SAAR) of 634 thousand. The previous three months were revised down.
...
The next graph shows new home sales for 2023 and 2024 by month (Seasonally Adjusted Annual Rate). Sales in April 2024 were down 6.6% from April 2023.

New Home Sales Decrease to 634,000 Annual Rate in April
by Calculated Risk on 5/23/2024 10:00:00 AM
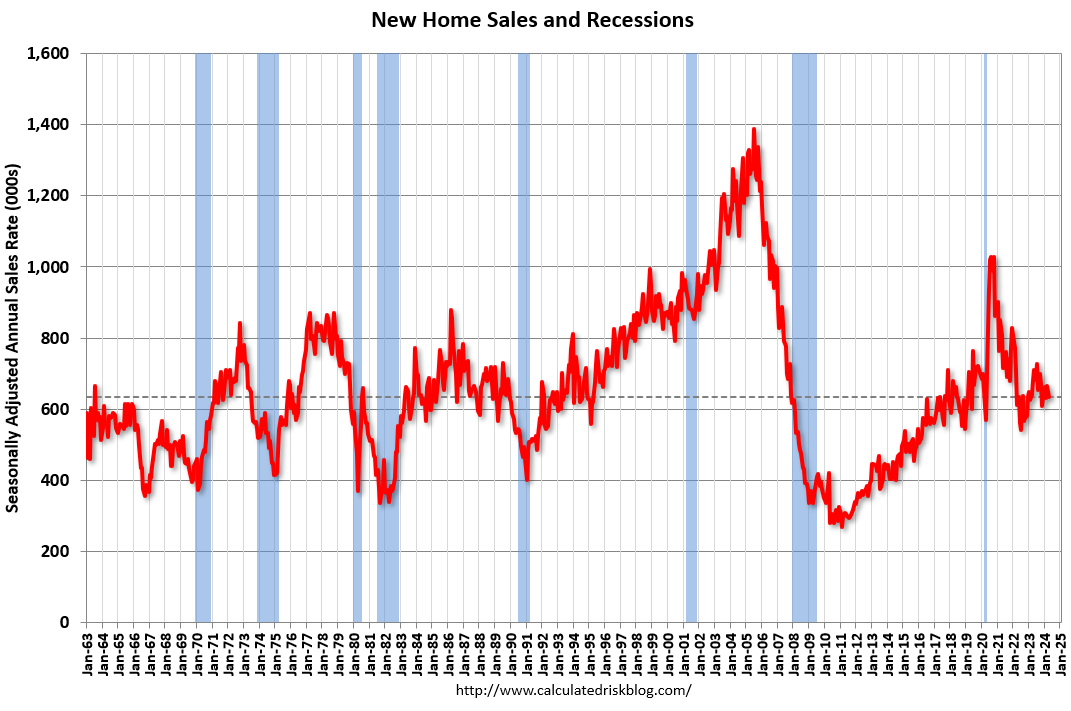
The Census Bureau reports New Home Sales in April were at a seasonally adjusted annual rate (SAAR) of 634 thousand.
The previous three months were revised down.
Sales of new single‐family houses in April 2024 were at a seasonally adjusted annual rate of 634,000, according to estimates released jointly today by the U.S. Census Bureau and the Department of Housing and Urban Development. This is 4.7 percent below the revised March rate of 665,000 and is 7.7 percent below the April 2023 estimate of 687,000.
emphasis added
 Click on graph for larger image.
The first graph shows New Home Sales vs. recessions since 1963. The dashed line is the current sales rate.
New home sales were close to pre-pandemic levels.
The second graph shows New Home Months of Supply.
 The months of supply increased in April to 9.1 months from 8.5 months in March.
 The all-time record high was 12.2 months of supply in January 2009. The all-time record low was 3.3 months in August 2020.
This is well above the top of the normal range (about 4 to 6 months of supply is normal).
"The seasonally‐adjusted estimate of new houses for sale at the end of April was 480,000. This represents a supply of 9.1 months at the current sales rate."Sales were well below expectations of 680 thousand SAAR, and sales for the three previous months were revised down. I'll have more later today.
Weekly Initial Unemployment Claims Decrease to 215,000
by Calculated Risk on 5/23/2024 08:30:00 AM
The DOL reported:
In the week ending May 18, the advance figure for seasonally adjusted initial claims was 215,000, a decrease of 8,000 from the previous week's revised level. The previous week's level was revised up by 1,000 from 222,000 to 223,000. The 4-week moving average was 219,750, an increase of 1,750 from the previous week's revised average. The previous week's average was revised up by 250 from 217,750 to 218,000.The following graph shows the 4-week moving average of weekly claims since 1971.
emphasis added
 Click on graph for larger image.
The dashed line on the graph is the current 4-week average. The four-week average of weekly unemployment claims increased to 219,750.
The previous week was revised up.
Weekly claims were lower than the consensus forecast.
Wednesday, May 22, 2024
Thursday: New Home Sales, Unemployment Claims
by Calculated Risk on 5/22/2024 07:51:00 PM
 Note: Mortgage rates are from MortgageNewsDaily.com and are for top tier scenarios.
Thursday:
• At 8:30 AM ET, The initial weekly unemployment claims report will be released. The consensus is for 220 thousand initial claims, down from 222 thousand last week.
• Also at 8:30 AM, Chicago Fed National Activity Index for April. This is a composite index of other data.
• At 10:00 AM, New Home Sales for April from the Census Bureau. The consensus is for 680 thousand SAAR, down from 693 thousand SAAR in March.
• At 11:00 AM, the Kansas City Fed manufacturing survey for May.
AIA: Architecture Billings Decline in April; Multi-family Billings Decline for 21st Consecutive Month
by Calculated Risk on 5/22/2024 03:48:00 PM
Note: This index is a leading indicator primarily for new Commercial Real Estate (CRE) investment.
From the AIA: ABI April 2024: Pace of billings decline at architecture firms slows slightly
While the AIA/Deltek Architecture Billings Index (ABI) score for the month rose from 43.6 in March to 48.3 in April, it indicates that billings continued to decline at the majority of firms (a score below 50 indicates declining billings). Inquiries into new projects continued to increase, as there remains interest in starting new projects. However, the value of newly signed design contracts dipped slightly in April, as clients remain hesitant to commit to new work. Firms had hoped that the Federal Reserve would start lowering interest rates this spring and that would open new work, but with that decrease now likely on hold until late summer or early fall, firms may have some more slow months ahead of them.• Northeast (56.9); Midwest (44.2); South (44.6); West (47.8)
Architecture firm billings continued to decline at firms in all regions of the country in April as well, with firms located in the Midwest and South reporting the largest declines. The current longest duration of decline is found at firms located in the West, where billings have now declined for the last 19 consecutive months. Business conditions also remain soft at firms of all specializations, with the weakest conditions continuing at firms with a multifamily residential specialization, followed by those with an institutional specialization, and then those with a commercial/industrial specialization.
...
The ABI score is a leading economic indicator of construction activity, providing an approximately nine-to-twelve-month glimpse into the future of nonresidential construction spending activity. The score is derived from a monthly survey of architecture firms that measures the change in the number of services provided to clients.
emphasis added
• Sector index breakdown: commercial/industrial (47.4); institutional (46.1); multifamily residential (45.6)
 Click on graph for larger image.
This graph shows the Architecture Billings Index since 1996. The index was at 48.3 in April, up from 43.6 in March. Anything below 50 indicates a decrease in demand for architects' services.
Note: This includes commercial and industrial facilities like hotels and office buildings, multi-family residential, as well as schools, hospitals and other institutions.
This index usually leads CRE investment by 9 to 12 months, so this index suggests a slowdown in CRE investment in 2024.
Note that multi-family billing turned down in August 2022 and has been negative for twenty one consecutive months (with revisions). This suggests we will see a further weakness in multi-family starts.


