 RSS Feed
 by Calculated Risk on 5/17/2024 08:23:00 AM
Friday, May 17, 2024
Early Q2 GDP Tracking: 1.9% to 3.6%
From BofA:
2Q US GDP tracking is down a tenth from our official forecast of 2.0% q/q saar to 1.9% q/q saar [May 17th estimate]From Goldman:
emphasis added
We raised our Q2 GDP tracking estimate by 0.2pp to +3.2% (qoq ar) and our domestic final sales estimate by 0.1pp to +2.5%, but we lowered our past-quarter GDP tracking estimate for Q1 by 0.1pp to +1.2% (vs. +1.6% originally reported). [May 16th estimate]And from the Altanta Fed: GDPNow
The GDPNow model estimate for real GDP growth (seasonally adjusted annual rate) in the second quarter of 2024 is 3.6 percent on May 16, down from 3.8 percent on May 15. [May 16th estimate]
Thursday, May 16, 2024
Realtor.com Reports Active Inventory Up 35.0% YoY; Most Home For Sale Since August 2020
by Calculated Risk on 5/16/2024 05:07:00 PM
What this means: On a weekly basis, Realtor.com reports the year-over-year change in active inventory and new listings. On a monthly basis, they report total inventory. For April, Realtor.com reported inventory was up 30.4% YoY, but still down almost 36% compared to April 2017 to 2019 levels.
Now - on a weekly basis - inventory is up 35.0% YoY.
Realtor.com has monthly and weekly data on the existing home market. Here is their weekly report: Weekly Housing Trends View—Data for Week Ending May 11, 2024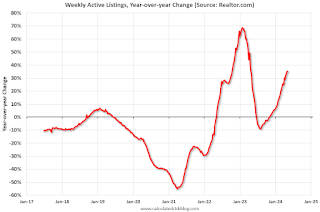 Here is a graph of the year-over-year change in inventory according to realtor.com.
Inventory was up year-over-year for the 27th consecutive week.
Realtor.com has monthly and weekly data on the existing home market. Here is their weekly report: Weekly Housing Trends View—Data for Week Ending May 11, 2024
• Active inventory increased, with for-sale homes 35.0% above year-ago levels.
For the 27th straight week, there were more homes listed for sale versus the prior year, giving homebuyers more options. In fact, last week saw the highest number of homes for sale since August 2020, a significant milestone. Though new listing activity has softened, the recent strength in listing activity means buyers are seeing more homes for sale than they have in almost 4 years. Though buyers are seeing more options at a national level, inventory abundance varies geographically. The South leads the way in inventory growth, with a 43.0% increase in inventory annually in April, while the Northeast saw inventory increase just 4.0%.
• New listings–a measure of sellers putting homes up for sale–were up this week, by 6.6% from one year ago.
Seller activity continued to climb annually last week and accelerated relative to the previous week’s growth. However, the annual increase in new listings was lower than almost every week back to early February, signifying a slowdown in new listings growth. .
 Here is a graph of the year-over-year change in inventory according to realtor.com.
 Inventory was up year-over-year for the 27th consecutive week.
However, inventory is still historically very low.
New listings remain below typical pre-pandemic levels although up year-over-year.
MBA: Mortgage Delinquencies Increased Slightly in Q1 2024
by Calculated Risk on 5/16/2024 12:01:00 PM
Today, in the Calculated Risk Real Estate Newsletter: MBA: Mortgage Delinquencies Increased Slightly in Q1 2024
A brief excerpt:
From the MBA: Mortgage Delinquencies Increase Slightly in the First Quarter of 2024There is much more in the article.The delinquency rate for mortgage loans on one-to-four-unit residential properties increased to a seasonally adjusted rate of 3.94 percent of all loans outstanding at the end of the first quarter of 2024, according to the Mortgage Bankers Association’s (MBA) National Delinquency Survey.The following graph shows the percent of loans delinquent by days past due. Overall delinquencies increased slightly in Q1. The sharp increase in 2020 in the 90-day bucket was due to loans in forbearance (included as delinquent, but not reported to the credit bureaus).
The percent of loans in the foreclosure process decreased year-over-year from 0.57 percent in Q1 2023 to 0.46 percent in Q1 2024 (red), even with the end of the foreclosure moratoriums, and remains historically low.
...
The primary concern is the increase in 30- and 60-day delinquency rates, and even though the rate is historically low, it has increased from 2.32% in Q1 2023 to 2.92% in Q1 2024. I don’t think this increase is much of a worry, but it is something to watch.

Single Family Starts Up 18% Year-over-year in May; Multi-Family Starts Down Sharply YoY
by Calculated Risk on 5/16/2024 09:35:00 AM
Today, in the Calculated Risk Real Estate Newsletter: Single Family Starts Up 18% Year-over-year in March; Multi-Family Starts Down Sharply YoY
A brief excerpt:
Total housing starts in April were above expectations, however, starts in February and March were revised down.
The third graph shows the month-to-month comparison for total starts between 2023 (blue) and 2024 (red).
Total starts were down 0.6% in April compared to April 2023.
The YoY decline was due to the sharp YoY decrease in multi-family starts.

Industrial Production Unchanged in April
by Calculated Risk on 5/16/2024 09:15:00 AM
From the Fed: Industrial Production and Capacity Utilization
Industrial production was little changed in April. Manufacturing output decreased 0.3 percent; excluding motor vehicles and parts, manufacturing output edged down 0.1 percent. The index for mining fell 0.6 percent, and the index for utilities rose 2.8 percent. At 102.8 percent of its 2017 average, total industrial production in April was 0.4 percentage point lower than its year-earlier level. Capacity utilization moved down to 78.4 percent in April, a rate that is 1.2 percentage points below its long-run (1972–2023) average.
emphasis added
 Click on graph for larger image.
This graph shows Capacity Utilization. This series is up from the record low set in April 2020, and above the level in February 2020 (pre-pandemic).
Capacity utilization at 78.4% is 1.2% below the average from 1972 to 2022. This was at consensus expectations.
Note: y-axis doesn't start at zero to better show the change.
 The second graph shows industrial production since 1967.
Industrial production was unchanged at 102.8. This is above the pre-pandemic level.
Industrial production was below consensus expectations.
Housing Starts Increased to 1.360 million Annual Rate in April
by Calculated Risk on 5/16/2024 08:32:00 AM
From the Census Bureau: Permits, Starts and Completions
Housing Starts:
Privately‐owned housing starts in April were at a seasonally adjusted annual rate of 1,360,000. This is 5.7 percent above the revised March estimate of 1,287,000, but is 0.6 percent below the April 2023 rate of 1,368,000. Single‐family housing starts in April were at a rate of 1,031,000; this is 0.4 percent below the revised March figure of 1,035,000. The April rate for units in buildings with five units or more was 322,000.
Building Permits:
Privately‐owned housing units authorized by building permits in April were at a seasonally adjusted annual rate of 1,440,000. This is 3.0 percent below the revised March rate of 1,485,000 and is 2.0 percent below the April 2023 rate of 1,470,000. Single‐family authorizations in April were at a rate of 976,000; this is 0.8 percent below the revised March figure of 984,000. Authorizations of units in buildings with five units or more were at a rate of 408,000 in April.
emphasis added
 Click on graph for larger image.
The first graph shows single and multi-family housing starts since 2000.
Multi-family starts (blue, 2+ units) increased in April compared to March. Multi-family starts were down 33.1% year-over-year.
Single-family starts (red) decreased slightly in April and were up 17.7% year-over-year.
 The second graph shows single and multi-family housing starts since 1968.
 This shows the huge collapse following the housing bubble, and then the eventual recovery - and the recent collapse and recovery in single-family starts.
Total housing starts in April were above expectations, however, starts in February and March were revised down.
I'll have more later …
Weekly Initial Unemployment Claims Decrease to 222,000
by Calculated Risk on 5/16/2024 08:30:00 AM
The DOL reported:
In the week ending May 11, the advance figure for seasonally adjusted initial claims was 222,000, a decrease of 10,000 from the previous week's revised level. The previous week's level was revised up by 1,000 from 231,000 to 232,000. The 4-week moving average was 217,750, an increase of 2,500 from the previous week's revised average. The previous week's average was revised up by 250 from 215,000 to 215,250.The following graph shows the 4-week moving average of weekly claims since 1971.
emphasis added
 Click on graph for larger image.
The dashed line on the graph is the current 4-week average. The four-week average of weekly unemployment claims increased to 217,750.
The previous week was revised up.
Weekly claims were at the consensus forecast.
Wednesday, May 15, 2024
Thursday: Housing Starts, Unemployment Claims, Industrial Production, Philly Fed Mfg
by Calculated Risk on 5/15/2024 07:01:00 PM
 Note: Mortgage rates are from MortgageNewsDaily.com and are for top tier scenarios.
Thursday:
• At 8:30 AM ET, Housing Starts for April. The consensus is for 1.410 million SAAR, up from 1.321 million SAAR in March.
• Also at 8:30 AM, The initial weekly unemployment claims report will be released. The consensus is for 222 thousand initial claims, down from 231 thousand last week.
• Also at 8:30 AM, the Philly Fed manufacturing survey for May. The consensus is for a reading of 8.0, down from 15.5.
• At 9:15 AM, The Fed will release Industrial Production and Capacity Utilization for April. The consensus is for a 0.2% increase in Industrial Production, and for Capacity Utilization to be unchanged at 78.4%.
Cleveland Fed: Median CPI increased 0.3% and Trimmed-mean CPI increased 0.3% in April
by Calculated Risk on 5/15/2024 11:58:00 AM
The Cleveland Fed released the median CPI and the trimmed-mean CPI.
According to the Federal Reserve Bank of Cleveland, the median Consumer Price Index rose 0.3% in April. The 16% trimmed-mean Consumer Price Index increased 0.3%. "The median CPI and 16% trimmed-mean CPI are measures of core inflation calculated by the Federal Reserve Bank of Cleveland based on data released in the Bureau of Labor Statistics’ (BLS) monthly CPI report".
 Click on graph for larger image.
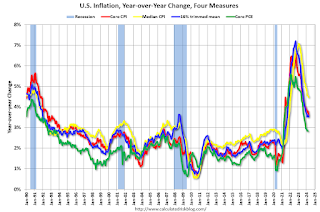
This graph shows the year-over-year change for these four key measures of inflation.
Note: The Cleveland Fed released the median CPI details. Rent and Owner's equivalent rent are still very high, and if we exclude rent, median CPI would be around 2% year-over-year.
According to the Federal Reserve Bank of Cleveland, the median Consumer Price Index rose 0.3% in April. The 16% trimmed-mean Consumer Price Index increased 0.3%. "The median CPI and 16% trimmed-mean CPI are measures of core inflation calculated by the Federal Reserve Bank of Cleveland based on data released in the Bureau of Labor Statistics’ (BLS) monthly CPI report".
 Click on graph for larger image.
This graph shows the year-over-year change for these four key measures of inflation.
On a year-over-year basis, the median CPI rose 4.5% (down from 4.6% in March), the trimmed-mean CPI rose 3.5% (down from 3.6%), and the CPI less food and energy rose 3.6% (down from 3.8%).
Core PCE is for March was up 2.8% YoY, down slightly from 2.8% in February.
Note: The Cleveland Fed released the median CPI details. Rent and Owner's equivalent rent are still very high, and if we exclude rent, median CPI would be around 2% year-over-year.
NAHB: Builder Confidence Declined in May
by Calculated Risk on 5/15/2024 10:00:00 AM
The National Association of Home Builders (NAHB) reported the housing market index (HMI) was at 45, down from 51 last month. Any number below 50 indicates that more builders view sales conditions as poor than good.
From the NAHB: Higher Mortgage Rates Hammer Builder Confidence in May
With mortgage rates averaging above 7% for the past four weeks per data from Freddie Mac, builder sentiment posted its first decline since November 2023.
Builder confidence in the market for newly built single-family homes was 45 in May, down six points from April, according to the National Association of Home Builders (NAHB)/Wells Fargo Housing Market Index (HMI) released today.
“The market has slowed down since mortgage rates increased and this has pushed many potential buyers back to the sidelines,” said NAHB Chairman Carl Harris, a custom home builder from Wichita, Kan. “We are also concerned about the recent codes rules that require HUD and USDA to insure mortgages for new single-family homes only if they are built to the 2021 International Energy Conservation Code. This will further increase the cost of construction in a market that sorely needs more inventory for first-time and first-generation buyers.”
“A lack of progress on reducing inflation pushed long-term interest rates higher in the first quarter and this is acting as a drag on builder sentiment,” said NAHB Chief Economist Robert Dietz. “The last leg in the inflation fight is to reduce shelter inflation, and this can only occur if builders are able to construct more attainable, affordable housing.”
The May HMI survey also revealed that 25% of builders cut home prices to bolster sales in May, ending four months of consecutive declines in this metric. However, the average price reduction in May held steady at 6% for the 11th straight month. Meanwhile, the use of sales incentives ticked up to 59% in May from a reading of 57% in April.
...
All three HMI component indices posted declines in May. The HMI index charting current sales conditions in May fell six points to 51, the component measuring sales expectations in the next six months fell nine points to 51 and the gauge charting traffic of prospective buyers declined four points to 30.
Looking at the three-month moving averages for regional HMI scores, the Midwest increased three points to 49, the Northeast fell two points to 61, the South dropped two points to 49 and the West posted a four-point decline to 43.
emphasis added
 Click on graph for larger image.
This graph shows the NAHB index since Jan 1985.
This was below the consensus forecast.


