 RSS Feed
 by Calculated Risk on 7/07/2023 01:31:00 PM
Friday, July 07, 2023
Heavy Truck Sales Up 15% Year-over-year in June
The BEA released their estimate of vehicle sales for June yesterday.
This graph shows heavy truck sales since 1967 using data from the BEA. The dashed line is the June 2023 seasonally adjusted annual sales rate (SAAR).
Heavy truck sales really collapsed during the great recession, falling to a low of 180 thousand SAAR in May 2009. Then heavy truck sales increased to a new all-time high of 570 thousand SAAR in April 2019.
 Click on graph for larger image.
Note: "Heavy trucks - trucks more than 14,000 pounds gross vehicle weight."
Heavy truck sales declined sharply at the beginning of the pandemic, falling to a low of 308 thousand SAAR in May 2020.
Heavy truck sales were at 547 thousand SAAR in June, down from 566 thousand in May, and up 15% from 475 thousand SAAR in June 2022.
Usually, heavy truck sales decline sharply prior to a recession. Sales were strong in June.
Comments on June Employment Report
by Calculated Risk on 7/07/2023 10:23:00 AM
The headline jobs number in the June employment report was at expectations, however, employment for the previous two months was revised down by 110,000, combined. The participation rate and the employment population ratio were unchanged, and the unemployment rate decreased to 3.6%.
Leisure and hospitality gained 21 thousand jobs in June. At the beginning of the pandemic, in March and April of 2020, leisure and hospitality lost 8.2 million jobs, and are now down 369 thousand jobs since February 2020. So, leisure and hospitality has now added back about 96% all of the jobs lost in March and April 2020.
Construction employment increased 20 thousand and is now 339 thousand above the pre-pandemic level.
Manufacturing employment increased 7 thousand jobs and is now 204 thousand above the pre-pandemic level.
In June, the year-over-year employment change was 3.79 million jobs.
Prime (25 to 54 Years Old) Participation
 Since the overall participation rate is impacted by both cyclical (recession) and demographic (aging population, younger people staying in school) reasons, here is the employment-population ratio for the key working age group: 25 to 54 years old.
The 25 to 54 participation rate increased in June to 83.5% from 83.4% in May, and the 25 to 54 employment population ratio increased to 80.9% from 80.7% the previous month.
Both are above the pre-pandemic levels and suggest all of the prime age workers have returned to the labor force.
Average Hourly Wages
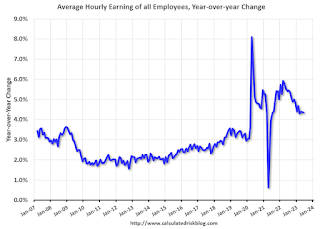 The graph shows the nominal year-over-year change in "Average Hourly Earnings" for all private employees from the Current Employment Statistics (CES).
Average Hourly Wages
 The graph shows the nominal year-over-year change in "Average Hourly Earnings" for all private employees from the Current Employment Statistics (CES).
 There was a huge increase at the beginning of the pandemic as lower paid employees were let go, and then the pandemic related spike reversed a year later.
Wage growth has trended down after peaking at 5.9% YoY in March 2022 and was at 4.4% YoY in June.
Wage growth has trended down after peaking at 5.9% YoY in March 2022 and was at 4.4% YoY in June.
Year-over-year wage growth will likely slow further next month since wage growth was strong in July 2022.
Part Time for Economic Reasons
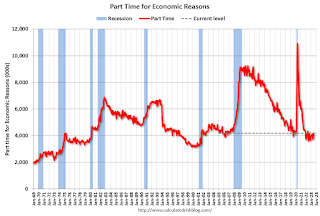 From the BLS report:
These workers are included in the alternate measure of labor underutilization (U-6) that increased to 6.9% from 6.7% in the previous month. This is down from the record high in April 22.9% and up from the lowest level on record (seasonally adjusted) in December 2022 (6.5%). (This series started in 1994). This measure is below the 7.0% level in February 2020 (pre-pandemic).
Unemployed over 26 Weeks
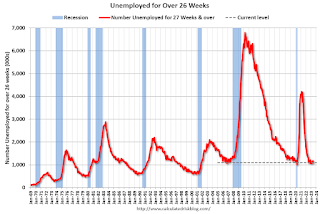 This graph shows the number of workers unemployed for 27 weeks or more.
According to the BLS, there are 1.105 million workers who have been unemployed for more than 26 weeks and still want a job, down from 1.188 million the previous month.
This is at pre-pandemic levels.
Summary:
The headline monthly jobs number was at expectations; however, employment for the previous two months was revised down by 110,000, combined.
Part Time for Economic Reasons
 From the BLS report:
"The number of persons employed part time for economic reasons increased by 452,000 to 4.2 million in June, partially reflecting an increase in the number of persons whose hours were cut due to slack work or business conditions. Persons employed part time for economic reasons are individuals who would have preferred full-time employment but were working part time because their hours had been reduced or they were unable to find full-time jobs."The number of persons working part time for economic reasons increased in June to 4.191 million from 3.739 million in May. This is below pre-recession levels.
These workers are included in the alternate measure of labor underutilization (U-6) that increased to 6.9% from 6.7% in the previous month. This is down from the record high in April 22.9% and up from the lowest level on record (seasonally adjusted) in December 2022 (6.5%). (This series started in 1994). This measure is below the 7.0% level in February 2020 (pre-pandemic).
Unemployed over 26 Weeks
 This graph shows the number of workers unemployed for 27 weeks or more.
 According to the BLS, there are 1.105 million workers who have been unemployed for more than 26 weeks and still want a job, down from 1.188 million the previous month.
This is at pre-pandemic levels.
Summary:
The headline monthly jobs number was at expectations; however, employment for the previous two months was revised down by 110,000, combined.
Overall, this was a solid employment report.
June Employment Report: 209 thousand Jobs, 3.6% Unemployment Rate
by Calculated Risk on 7/07/2023 08:40:00 AM
From the BLS:
Total nonfarm payroll employment increased by 209,000 in June, and the unemployment rate changed little at 3.6 percent, the U.S. Bureau of Labor Statistics reported today. Employment continued to trend up in government, health care, social assistance, and construction.
...
The change in total nonfarm payroll employment for April was revised down by 77,000, from +294,000 to +217,000, and the change for May was revised down by 33,000, from +339,000 to +306,000. With these revisions, employment in April and May combined is 110,000 lower than previously reported.
emphasis added
 Click on graph for larger image.
The first graph shows the jobs added per month since January 2021.
Total payrolls increased by 209 thousand in June. Private payrolls increased by 149 thousand, and public payrolls increased 60 thousand.
Payrolls for April and May were revised down 110 thousand, combined.
Payrolls for April and May were revised down 110 thousand, combined.
 The second graph shows the year-over-year change in total non-farm employment since 1968.
In June, the year-over-year change was 3.79 million jobs. Employment was up significantly year-over-year.
The third graph shows the employment population ratio and the participation rate.
 The Labor Force Participation Rate was unchanged at 62.6% in June, from 62.6% in May. This is the percentage of the working age population in the labor force.
 The Employment-Population ratio was unchanged at 60.3% from 60.3% (blue line).
I'll post the 25 to 54 age group employment-population ratio graph later.
 The fourth graph shows the unemployment rate.
 The unemployment rate decreased in June to 3.6% from 3.7% in May.
This was at consensus expectations; however, April and May payrolls were revised down by 110,000 combined.
Thursday, July 06, 2023
Friday: Employment Report
by Calculated Risk on 7/06/2023 08:38:00 PM
 Note: Mortgage rates are from MortgageNewsDaily.com and are for top tier scenarios.
Friday:
• At 8:30 AM ET, Employment Report for June. The consensus is for 200,000 jobs added, and for the unemployment rate to be unchanged at 3.7%.
June Employment Preview
by Calculated Risk on 7/06/2023 05:45:00 PM
On Friday at 8:30 AM ET, the BLS will release the employment report for June. The consensus is for 200,000 jobs added, and for the unemployment rate to be unchanged at 3.7%.
From BofA economists:
"Nonfarm payrolls likely rose by 250k in June after adding 339k jobs in May. ... Given our forecasts of the participation rate and nonfarm payroll growth, we expect the unemployment rate will fall from 3.7% to 3.6%."From Goldman Sachs following the strong ADP report:
We estimate nonfarm payrolls rose by 250k in June (mom sa). Job growth tends to pick up in June when the labor market is tight—reflecting strong hiring of youth summer workers ... We estimate the unemployment rate pulled back by one tenth to 3.6% (consensus also 3.6%) reflecting a rise in household employment and unchanged labor force participation at 62.6%.• ADP Report: The ADP employment report showed 497,000 private sector jobs were added in June. This suggests job gains well above consensus expectations, however, in general, ADP hasn't been very useful in forecasting the BLS report.
• ISM Surveys: Note that the ISM services are diffusion indexes based on the number of firms hiring (not the number of hires). The ISM® manufacturing employment index decreased in June to 48.1%, down from 51.4% last month. This would suggest about 30,000 jobs lost in manufacturing. The ADP report indicated 42,000 manufacturing jobs lost in May.
The ISM® services employment index increased in June to 53.1%, up from 49.2% last month. This would suggest about 160,000 jobs added in the service sector. Combined this suggests job gains of 120,000, well below consensus expectations.
• Unemployment Claims: The weekly claims report showed a sharp increase in the number of initial unemployment claims during the reference week (includes the 12th of the month) from 246,000 in May to 265,000 in June. This suggests more layoffs in June than in May.
• COVID: As far as the pandemic, the number of patients hospitalized during the reference week in June was around 6,400, down from 8,300 in May.
• Conclusion: All the key indicators suggest another solid employment report in June. We've seen an upside surprise in employment almost every month, however someday we will see a downside surprise.
Early Look at Local Housing Markets in June
by Calculated Risk on 7/06/2023 02:56:00 PM
Today, in the Calculated Risk Real Estate Newsletter: Early Look at Local Housing Markets in June
A brief excerpt:
This is a look at a few early reporting local markets in May. I’m tracking about 40 local housing markets in the US. Some of the 40 markets are states, and some are metropolitan areas. I’ll update these tables throughout the month as additional data is released.There is much more in the article. You can subscribe at https://calculatedrisk.substack.com/
Closed sales in June were mostly for contracts signed in April and May. Since 30-year fixed mortgage rates were in the 6.4% range in April and May - compared to the 5% range the previous year - closed sales were down year-over-year in June.
...
In June, sales in these markets were down 20.4%. In May, these same markets were down 24.7% YoY Not Seasonally Adjusted (NSA).
This is a smaller YoY decline NSA than in May for these early reporting markets. Note that there were the same number of selling days each year in June 2022 and June 2023.
A key factor in the smaller YoY decline was that sales were steadily declining last year due to higher mortgage rates. ...
This was a just a few early reporting markets. Many more local markets to come!

BLS: Job Openings Decreased to 9.8 million in May
by Calculated Risk on 7/06/2023 10:05:00 AM
From the BLS: Job Openings and Labor Turnover Summary
The number of job openings decreased to 9.8 million on the last business day of May, the U.S. Bureau of Labor Statistics reported today. Over the month, the number of hires and total separations were little changed at 6.2 million and 5.9 million, respectively. Within separations, quits (4.0 million) increased, while layoffs and discharges (1.6 million) changed little.The following graph shows job openings (black line), hires (dark blue), Layoff, Discharges and other (red column), and Quits (light blue column) from the JOLTS.
emphasis added
This series started in December 2000.
Note: The difference between JOLTS hires and separations is similar to the CES (payroll survey) net jobs headline numbers. This report is for May the employment report this Friday will be for June.
 Click on graph for larger image.
Note that hires (dark blue) and total separations (red and light blue columns stacked) are usually pretty close each month. This is a measure of labor market turnover. When the blue line is above the two stacked columns, the economy is adding net jobs - when it is below the columns, the economy is losing jobs.
The spike in layoffs and discharges in March 2020 is labeled, but off the chart to better show the usual data.
Jobs openings decreased in May to 9.8 million from 10.3 million in April.
The number of job openings (black) were down 14% year-over-year.
Quits were down 5% year-over-year. These are voluntary separations. (See light blue columns at bottom of graph for trend for "quits").
Trade Deficit Decreased to $69.0 Billion in May
by Calculated Risk on 7/06/2023 08:47:00 AM
The Census Bureau and the Bureau of Economic Analysis reported:
The U.S. Census Bureau and the U.S. Bureau of Economic Analysis announced today that the goods and services deficit was $69.0 billion in May, down $5.5 billion from $74.4 billion in April, revised.
May exports were $247.1 billion, $2.1 billion less than April exports. May imports were $316.1 billion, $7.5 billion less than April imports.
emphasis added
 Click on graph for larger image.
Exports and imports decreased in May.
Exports are down 3% year-over-year; imports are down 7% year-over-year.
Both imports and exports decreased sharply due to COVID-19 and then bounced back - and both have been decreasing recently.
The second graph shows the U.S. trade deficit, with and without petroleum.
 The blue line is the total deficit, and the black line is the petroleum deficit, and the red line is the trade deficit ex-petroleum products.
Note that net, exports of petroleum products are positive and have picked up.
The trade deficit with China decreased to $25.2 billion in March, from $31.5 billion a year ago.
The trade deficit was slightly less than the consensus forecast.
Weekly Initial Unemployment Claims Increase to 248,000
by Calculated Risk on 7/06/2023 08:34:00 AM
The DOL reported:
In the week ending July 1, the advance figure for seasonally adjusted initial claims was 248,000, an increase of 12,000 from the previous week's revised level. The previous week's level was revised down by 3,000 from 239,000 to 236,000. The 4-week moving average was 253,250, a decrease of 3,500 from the previous week's revised average. The previous week's average was revised down by 750 from 257,500 to 256,750.The following graph shows the 4-week moving average of weekly claims since 1971.
emphasis added
 Click on graph for larger image.
The dashed line on the graph is the current 4-week average. The four-week average of weekly unemployment claims decreased to 253,250.
The previous week was revised down.
Weekly claims were above the consensus forecast.
ADP: Private Employment Increased 497,000 in June
by Calculated Risk on 7/06/2023 08:25:00 AM
Private sector employment increased by 497,000 jobs in June and annual pay was up 6.4 percent year-over-year, according to the June ADP® National Employment ReportTM produced by the ADP Research Institute® in collaboration with the Stanford Digital Economy Lab (“Stanford Lab”).This was way above the consensus forecast of 236,000. The BLS report will be released Friday, and the consensus is for 200 thousand non-farm payroll jobs added in June.
...
“Consumer-facing service industries had a strong June, aligning to push job creation higher than expected,” said Nela Richardson, chief economist, ADP. “But wage growth continues to ebb in these same industries, and hiring likely is cresting after a late-cycle surge.”
emphasis added


