 RSS Feed
 by Calculated Risk on 5/29/2023 09:15:00 AM
Monday, May 29, 2023
Housing May 29th Weekly Update: Inventory Increased 2.1% Week-over-week
Altos reports that active single-family inventory was up 2.1% week-over-week.
 Click on graph for larger image.
This inventory graph is courtesy of Altos Research.
As of May 26th, inventory was at 433 thousand (7-day average), compared to 424 thousand the prior week.
Year-to-date, inventory is down 11.8%. And inventory is up 6.8% from the seasonal bottom six weeks ago.
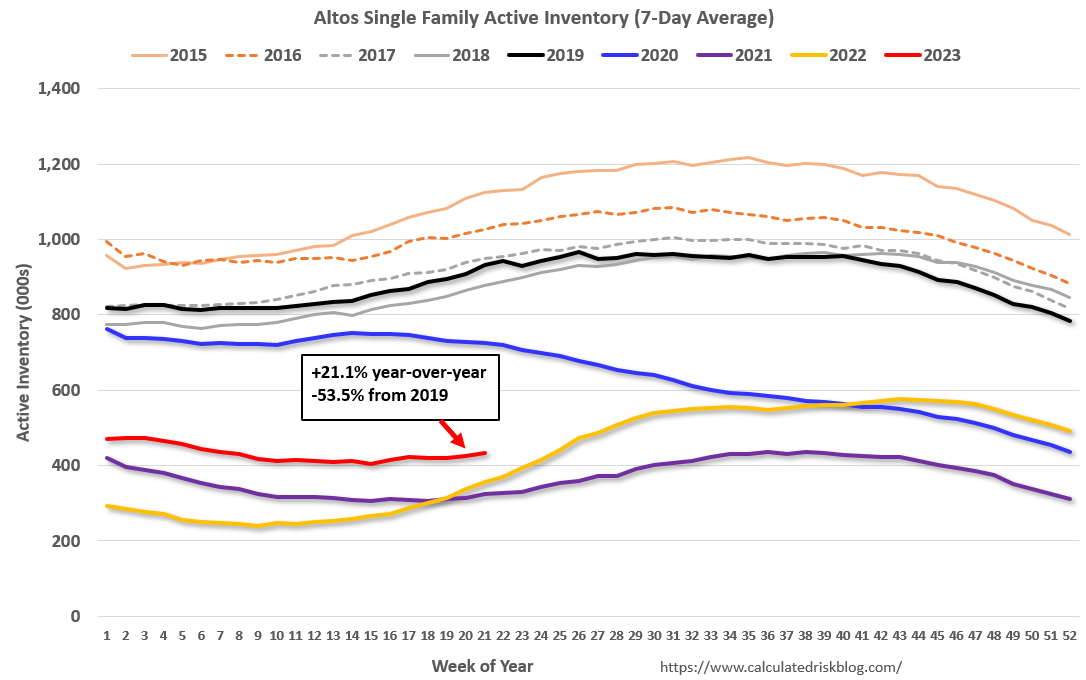
The red line is for 2023. The black line is for 2019. Note that inventory is up from the previous two years (the record low was in 2022), but still well below normal levels.
Inventory was up 21.1% compared to the same week in 2022 (last week it was up 25.4%), and down 53.5% compared to the same week in 2019 (last week down 53.3%).
It appears likely inventory will be down year-over-year in late June.
Mike Simonsen discusses this data regularly on Youtube.
Sunday, May 28, 2023
Hotels: Occupancy Rate Down 1.5% Year-over-year
by Calculated Risk on 5/28/2023 10:32:00 AM
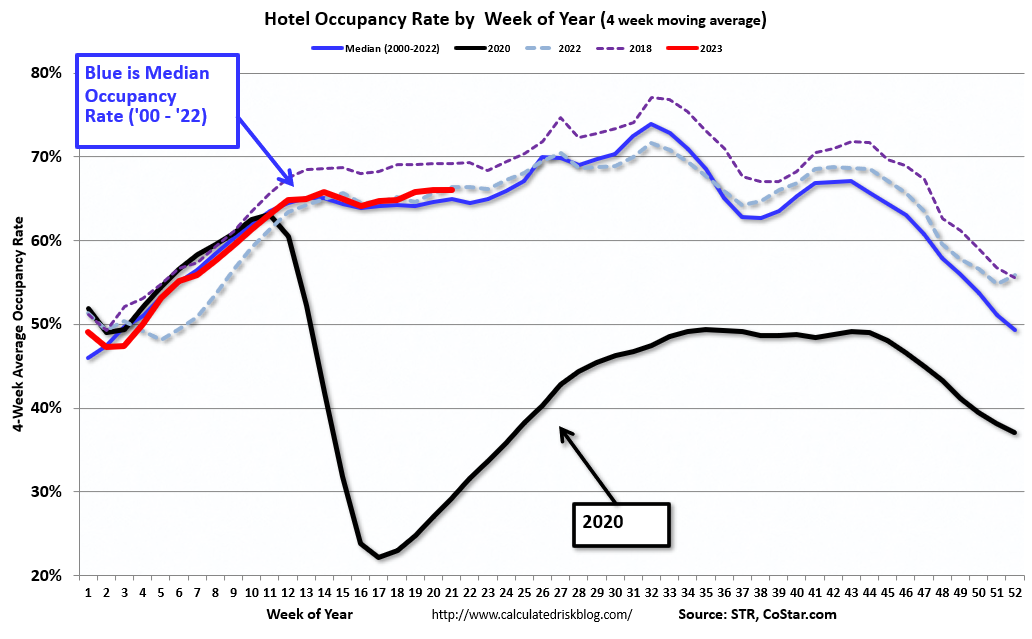
U.S. hotel performance increased from the previous week and showed improved comparisons year over year, according to STR‘s latest data through 20 May.The following graph shows the seasonal pattern for the hotel occupancy rate using the four-week average.
14-20 May 2023 (percentage change from comparable week in 2022):
• Occupancy: 67.5% (-1.5%)
• Average daily rate (ADR): US$158.53 (+3.6%)
• Revenue per available room (RevPAR): US$106.98 (+2.1%)
emphasis added
 Click on graph for larger image.
The red line is for 2023, black is 2020, blue is the median, and dashed light blue is for 2022. Dashed purple is for 2018, the record year for hotel occupancy.
The 4-week average of the occupancy rate is slightly above the median rate for the period 2000 through 2022 (Blue).
Note: Y-axis doesn't start at zero to better show the seasonal change.
The 4-week average of the occupancy rate will move mostly sideways for the next several weeks until the summer travel season.
Saturday, May 27, 2023
Real Estate Newsletter Articles this Week: "Multi-Family Delinquencies Increased"
by Calculated Risk on 5/27/2023 02:11:00 PM
At the Calculated Risk Real Estate Newsletter this week:
• New Home Sales at 683,000 Annual Rate in April
• Two Key Housing Themes: Low Inventory and Few Distressed Sales
• Total Housing Completions will Likely Decrease Slightly in 2023; The Mix will Change
• Fannie and Freddie Serious Delinquencies in April: Single Family Declined, Multi-Family Increased
• Final Look at Local Housing Markets in April
This is usually published 4 to 6 times a week and provides more in-depth analysis of the housing market.
You can subscribe at https://calculatedrisk.substack.com/
Most content is available for free (and no Ads), but please subscribe!
Schedule for Week of May 28, 2023
by Calculated Risk on 5/27/2023 08:11:00 AM
The key report scheduled for this week is the May employment report.
Other key reports include the March Case-Shiller house prices, May ISM Manufacturing and May Vehicle Sales.
All US markets will be closed in observance of Memorial Day.
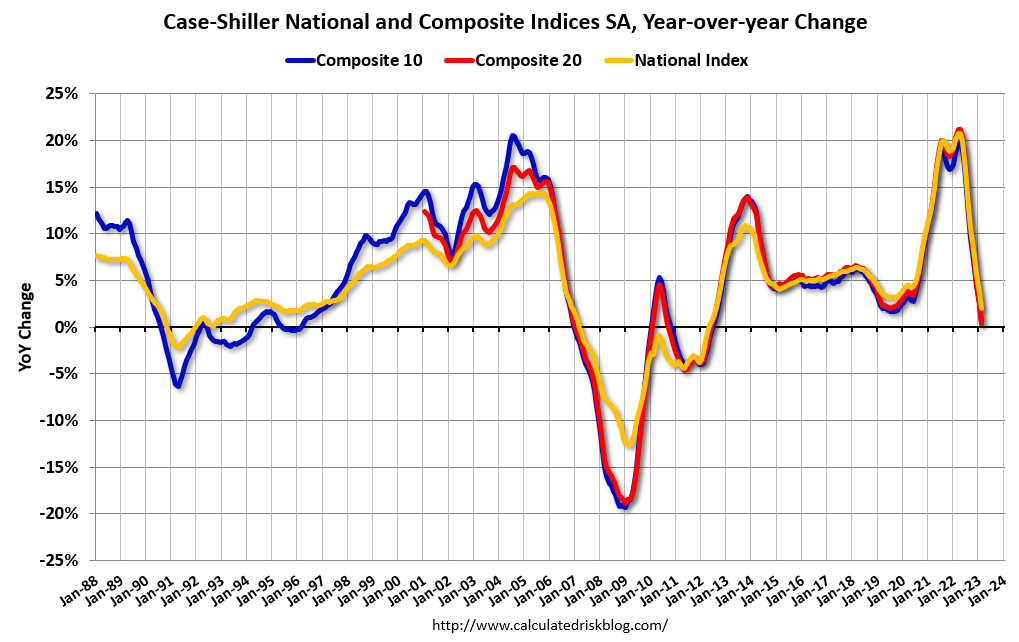 9:00 AM: S&P/Case-Shiller House Price Index for March.
This graph shows the year-over-year change in the seasonally adjusted National Index, Composite 10 and Composite 20 indexes through the most recent report (the Composite 20 was started in January 2000).
9:00 AM: FHFA House Price Index for March 2022. This was originally a GSE only repeat sales, however there is also an expanded index.
10:00 AM: Dallas Fed Survey of Manufacturing Activity for May.
7:00 AM ET: The Mortgage Bankers Association (MBA) will release the results for the mortgage purchase applications index.
9:45 AM: Chicago Purchasing Managers Index for May.
 10:00 AM ET: Job Openings and Labor Turnover Survey for April from the BLS.
 This graph shows job openings (black line), hires (purple), Layoff, Discharges and other (red column), and Quits (light blue column) from the JOLTS.
Jobs openings decreased in March to 9.6 million from 10.0 million in February. The number of job openings (black) were down 20% year-over-year.
2:00 PM: the Federal Reserve Beige Book, an informal review by the Federal Reserve Banks of current economic conditions in their Districts.
8:15 AM: The ADP Employment Report for May. This report is for private payrolls only (no government). The consensus is for 160,000 payroll jobs added in May, down from 296,000 in April.
8:30 AM: The initial weekly unemployment claims report will be released. The consensus is for 234 thousand initial claims, up from 229 thousand last week.
 All day: Light vehicle sales for May. The consensus is for light vehicle sales to be 14.5 million SAAR in May, up from 14.3 million in April (Seasonally Adjusted Annual Rate).
This graph shows light vehicle sales since the BEA started keeping data in 1967. The dashed line is the sales rate for last month.
10:00 AM: ISM Manufacturing Index for May. The consensus is for the ISM to be at 47.0, down from 47.1 in April.
10:00 AM: Construction Spending for April. The consensus is for a 0.2% increase in construction spending.
----- Friday, June 2nd -----
 8:30 AM: Employment Report for May. The consensus is for 180,000 jobs added, and for the unemployment rate to increase to 3.5%.
There were 253,000 jobs added in April, and the unemployment rate was at 3.4%.
This graph shows the jobs added per month since January 2021.
10:00 AM: ISM Manufacturing Index for May. The consensus is for the ISM to be at 47.0, down from 47.1 in April.
10:00 AM: Construction Spending for April. The consensus is for a 0.2% increase in construction spending.
 8:30 AM: Employment Report for May. The consensus is for 180,000 jobs added, and for the unemployment rate to increase to 3.5%.
There were 253,000 jobs added in April, and the unemployment rate was at 3.4%.
This graph shows the jobs added per month since January 2021.
Friday, May 26, 2023
May 26th COVID Update: New Pandemic Lows for Deaths and Hospitalizations
by Calculated Risk on 5/26/2023 09:01:00 PM
 Note: Mortgage rates are from MortgageNewsDaily.com and are for top tier scenarios.
Due to changes at the CDC, weekly cases are no longer updated.
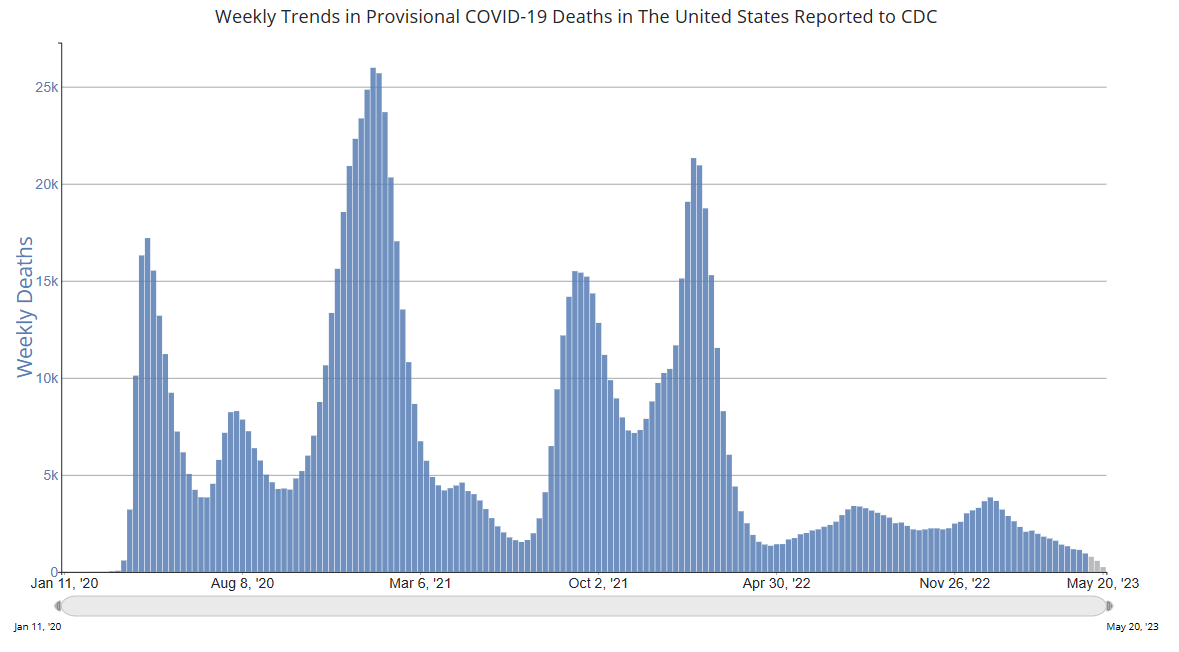
After the first few weeks, the pandemic low for weekly deaths had been the week of July 7, 2021, at 1,690 deaths (until recently).
For COVID hospitalizations, the previous low was 9,821 (until four weeks ago).
| COVID Metrics | ||||
|---|---|---|---|---|
| Now | Week Ago | Goal | ||
| Hospitalized2 | 7,465 | 8,249 | ≤3,0001 | |
| Deaths per Week2 | 778 | 949 | ≤3501 | |
| 1my goals to stop weekly posts, 2Weekly for Currently Hospitalized, and Deaths 🚩 Increasing number weekly for Hospitalized and Deaths ✅ Goal met. | ||||
 Click on graph for larger image.
This graph shows the weekly (columns) number of deaths reported.
For deaths, I'm currently using 3 weeks ago for "now", since the most recent two weeks will be revised significantly.
Fannie and Freddie Serious Delinquencies in April: Single Family Declined, Multi-Family Increased
by Calculated Risk on 5/26/2023 01:08:00 PM
Today, in the Calculated Risk Real Estate Newsletter: Fannie and Freddie Serious Delinquencies in April: Single Family Declined, Multi-Family Increased
Brief excerpt:
Single-family serious delinquencies continued to decline in April, however, multi-family serious delinquencies are now increasing.You can subscribe at https://calculatedrisk.substack.com/.
...
Freddie Mac reports that multi-family delinquencies increased to 0.19% in April, up from 0.08% in April 2022..
This graph shows the Freddie multi-family serious delinquency rate since 2012. Rates were still high in 2012 following the housing bust and financial crisis.
The multi-family rate increased following the pandemic and has increased recently as rent growth has slowed, vacancy rates have increased, and interest rates have increased sharply. This will be something to watch as rents soften.

Q2 GDP Tracking: Around 1% to 2%
by Calculated Risk on 5/26/2023 11:58:00 AM
From BofA:
Overall, today's higher than expected personal income and outlays and durable goods print along with the wider than expected advance goods trade deficit decreased our 2Q US GDP tracking from 1.1% q/q saar to 0.9% q/q saar. [May 26th estimate]From Goldman:
emphasis added
Personal income increased as expected and personal spending increased by more than expected in April. ... Both headline and core durable goods orders increased against consensus expectations for declines. The goods trade deficit widened significantly more than expected in April, driven by a large decline in exports and a more modest rise in imports. We boosted our Q2 GDP tracking estimate by one tenth to +2.1% (qoq ar). [May 26th estimate]And from the Altanta Fed: GDPNow
The GDPNow model estimate for real GDP growth (seasonally adjusted annual rate) in the second quarter of 2023 is 1.9 percent on May 26, down from 2.9 percent on May 17. After recent releases from the US Census Bureau, the US Bureau of Economic Analysis, and the National Association of Realtors, decreases in the nowcasts of second-quarter real net exports and second-quarter real gross private domestic investment growth were partially offset by increases in the nowcasts of second-quarter real personal consumption expenditures growth and second-quarter real government spending growth. [May 26th estimate]
PCE Measure of Shelter Still Accelerating YoY
by Calculated Risk on 5/26/2023 08:58:00 AM
Here is a graph of the year-over-year change in shelter from the CPI report and housing from the PCE report this morning, both through April 2023.
 CPI Shelter was up 8.1% year-over-year in April, down from 8.2% in March.
Housing (PCE) was up 8.4% YoY in April, up from 8.3% in March.
Since asking rents are soft and Year-over-year Rent Growth Continues to Decelerate this means both CPI and PCE measures are currently overstating actual inflation.
Since asking rents are soft and Year-over-year Rent Growth Continues to Decelerate this means both CPI and PCE measures are currently overstating actual inflation.
Personal Income increased 0.4% in April; Spending increased 0.8%
by Calculated Risk on 5/26/2023 08:40:00 AM
The BEA released the Personal Income and Outlays report for April:
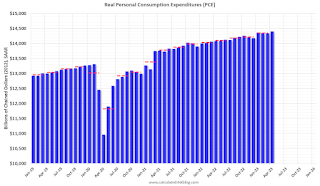
Personal income increased $80.1 billion (0.4 percent at a monthly rate) in April, according to estimates released today by the Bureau of Economic Analysis. Disposable personal income (DPI) increased $79.4 billion (0.4 percent) and personal consumption expenditures (PCE) increased $151.7 billion (0.8 percent).The April PCE price index increased 4.4 percent year-over-year (YoY), up from 4.2 percent YoY in March, and down from the recent peak of 7.0 percent in June 2022.
The PCE price index increased 0.4 percent. Excluding food and energy, the PCE price index increased 0.4 percent. Real DPI increased less than 0.1 percent in April and Real PCE increased 0.5 percent; goods increased 0.8 percent and services increased 0.3 percent.
emphasis added
The PCE price index, excluding food and energy, increased 4.7 percent YoY, up from 4.6 percent in March, and down from the recent peak of 5.4 percent in February 2022.
The following graph shows real Personal Consumption Expenditures (PCE) through April 2023 (2012 dollars). Note that the y-axis doesn't start at zero to better show the change.
 Click on graph for larger image.
The dashed red lines are the quarterly levels for real PCE.
Personal income was at expectations, and PCE was above expectations.
Inflation was above expectations.
Thursday, May 25, 2023
Friday: Personal Income and Outlays, Durable Goods
by Calculated Risk on 5/25/2023 08:39:00 PM
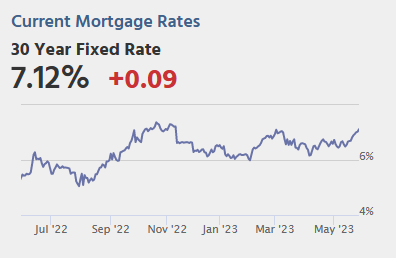 Note: Mortgage rates are from MortgageNewsDaily.com and are for top tier scenarios.
Friday:
• At 8:30 AM ET, Personal Income and Outlays, April 2023. The consensus is for a 0.4% increase in personal income, and for a 0.4% increase in personal spending. And for the Core PCE price index to increase 0.3%. PCE prices are expected to be up 4.3% YoY, and core PCE prices up 4.6% YoY.
• Also at 8:30 AM, Durable Goods Orders for April from the Census Bureau. The consensus is for a 1.1% decrease in durable goods orders.
• At 10:00 AM, University of Michigan's Consumer sentiment index (Final for May). The consensus is for a reading of 57.7.


