 RSS Feed
 by Calculated Risk on 4/21/2023 08:30:00 AM
Friday, April 21, 2023
Black Knight: "Mortgage Delinquencies Hit Record Low in March"
From Black Knight: Black Knight’s First Look: Mortgage Delinquencies Hit Record Low in March, While Prepayments Rose on Easing Rates and Seasonal Tailwinds
• The national delinquency rate dropped 53 basis points (-15%) in March, falling below 3% for the first time on record, ending the month at just 2.92%According to Black Knight's First Look report, the percent of loans delinquent decreased 15% in March compared to February and decreased 13% year-over-year.
• While delinquency rates almost always fall in March – as borrowers utilize tax refunds and other seasonal revenues to pay down past-due debt – the drop marked the second largest decline in the past 17 years
• Factoring in March’s decline, the total number of past-due mortgages (including active foreclosures) has fallen to its lowest level in nearly 23 years, dating all the way back to April 2000
• Serious delinquencies (90+ days past due) showed marked improvement, falling by 51K to their lowest level since March 2020, with volumes shrinking in every state
• Likewise, every state saw overall delinquencies fall in March, with improvements ranging from 11.9% in Washington to 21.5% in Vermont
• Both foreclosure starts (+9.0%) and sales (+4.6%) rose in the month but still remain well below pre-pandemic volumes at the national level
• Active foreclosure inventory held steady, but remains 31K (12%) below March 2020 levels
• The prepayment rate (SMM) rose to 0.50% (+44% month over month) driven, as anticipated, by seasonal tailwinds in sale-related prepayments and an increased demand for refis due to falling rates
emphasis added
Black Knight reported the U.S. mortgage delinquency rate (loans 30 or more days past due, but not in foreclosure) was 2.92% in March, down from 3.45% the previous month.
The percent of loans in the foreclosure process was essentially unchanged in March at 0.46%, from 0.46% the previous month.
The number of delinquent properties, but not in foreclosure, is down 209,000 properties year-over-year, and the number of properties in the foreclosure process is up 31,000 properties year-over-year.
| Black Knight: Percent Loans Delinquent and in Foreclosure Process | ||||
|---|---|---|---|---|
| Mar 2023 | Feb 2023 | |||
| Delinquent | 2.92% | 3.45% | ||
| In Foreclosure | 0.46% | 0.46% | ||
| Number of properties: | ||||
| Number of properties that are delinquent, but not in foreclosure: | 1,539,000 | 1,811,000 | ||
| Number of properties in foreclosure pre-sale inventory: | 240,000 | 240,000 | ||
| Total Properties | 1,779,000 | 2,050,000 | ||
Thursday, April 20, 2023
Hotels: Occupancy Rate Up 3.7% Year-over-year
by Calculated Risk on 4/20/2023 03:39:00 PM
U.S. hotel performance increased from the previous week, according to STR‘s latest data through April 15.The following graph shows the seasonal pattern for the hotel occupancy rate using the four-week average.
April 9-15, 2023 (percentage change from comparable week in 2022):
• Occupancy: 64.2% (+3.7%)
• Average daily rate (ADR): $155.33 (+4.7%)
• Revenue per available room (RevPAR): $99.67 (+8.6%)
emphasis added
 Click on graph for larger image.
The red line is for 2023, black is 2020, blue is the median, and dashed light blue is for 2022. Dashed purple is for 2018, the record year for hotel occupancy.
The 4-week average of the occupancy rate is close to the median rate for the period 2000 through 2020 (Blue).
Note: Y-axis doesn't start at zero to better show the seasonal change.
The 4-week average of the occupancy rate will move more sideways until the summer travel season.
Realtor.com Reports Weekly Active Inventory Up 49% YoY; New Listings Down 5% YoY
by Calculated Risk on 4/20/2023 01:32:00 PM
Realtor.com has monthly and weekly data on the existing home market. Here is their weekly report released today from chief economist Danielle Hale: Weekly Housing Trends View — Data Week Ending Apr 15, 2023
• Active inventory growth continued to climb, with for-sale homes up 49% above one year ago. The number of homeowners shifting home listing timelines around spring holidays helped push active inventory growth up this week. Despite the big surge, the number of homes for-sale continues to trail pre-pandemic levels, keeping many cards in the hands of sellers sitting on very high levels of home equity.
...
• New listings–a measure of sellers putting homes up for sale–were down again this week, but only by 5% from one year ago. The number of newly listed homes has been lower than the same time the previous year for the past 41 weeks and while this week continued that trend, the magnitude shifted in a big way. Shifts in religious holidays that fell earlier in 2023 are likely responsible for last week’s big drop and this week’s significantly smaller decline. On average across the two weeks, the decline in new listings is roughly on track with what we’ve seen so far this year.
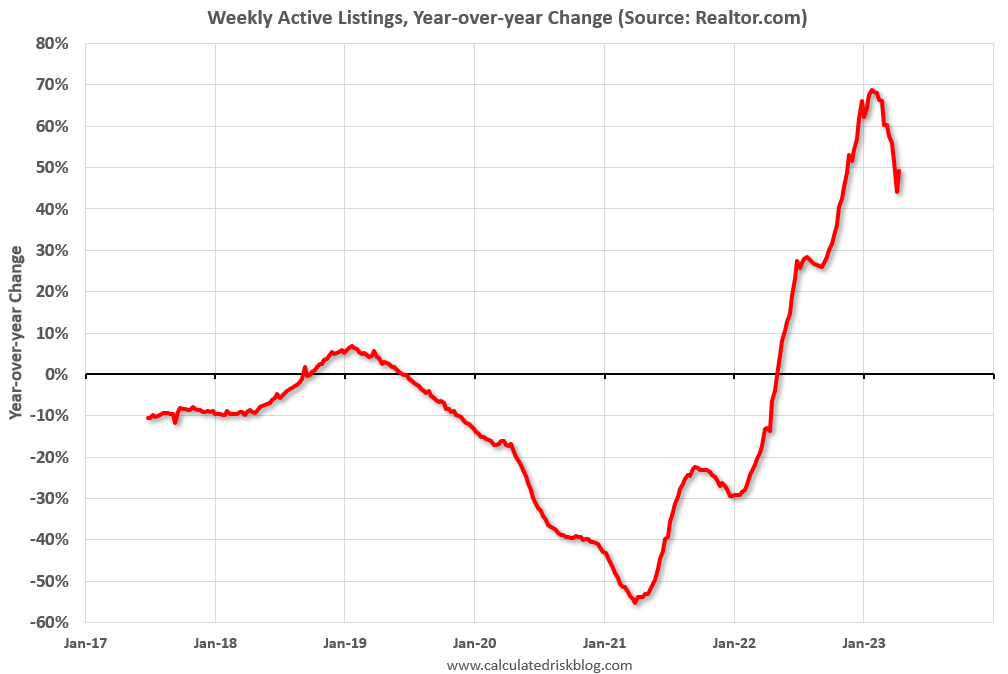 Here is a graph of the year-over-year change in inventory according to realtor.com.
 Inventory is still up year-over-year - from record lows - however, the YoY increase has slowed recently, although this was a pickup from up 44% YoY last week.
NAR: Existing-Home Sales Decreased to 4.44 million SAAR in March; Median Prices Declined 0.9% YoY
by Calculated Risk on 4/20/2023 10:42:00 AM
Today, in the CalculatedRisk Real Estate Newsletter: NAR: Existing-Home Sales Decreased to 4.44 million SAAR in March; Median Prices Declined 0.9% YoY
Excerpt:
On prices, the NAR reported:There is much more in the article. You can subscribe at https://calculatedrisk.substack.com/ Please subscribe!The median existing-home price for all housing types in March was $375,700, a decline of 0.9% from March 2022 ($379,300). Price climbed slightly in three regions but dropped in the WestMedian prices are distorted by the mix (repeat sales indexes like Case-Shiller and FHFA are probably better for measuring prices).
The YoY change in the median price peaked at 25.2% in May 2021 and prices are now down 0.9% YoY. Median house prices increased 3.3% from February to March and have declined 9.2% from the peak in June 2022 (NSA).
It is likely the Case-Shiller index will be down soon year-over-year.
Note that closed sales in March were mostly for contracts signed in January and February. Mortgage rates, according to the Freddie Mac PMMS, were around 6.3% in January and February, and that provided a boost to closed sales in February and March compared to closed sales in December and January.
April sales will be for contracts signed in February and March, and mortgage rates averaged 6.5% in March and that might impact closed sales in April.

NAR: Existing-Home Sales Decreased to 4.44 million SAAR in March
by Calculated Risk on 4/20/2023 10:11:00 AM
From the NAR: Existing-Home Sales Slid 2.4% in March
Existing-home sales edged lower in March, according to the National Association of Realtors®. Month-over-month sales declined in three out of four major U.S. regions, while sales in the Northeast remained steady. All regions posted year-over-year decreases.
Total existing-home sales – completed transactions that include single-family homes, townhomes, condominiums and co-ops – fell 2.4% from February to a seasonally adjusted annual rate of 4.44 million in March. Year-over-year, sales waned 22.0% (down from 5.69 million in March 2022).
...
Total housing inventory registered at the end of March was 980,000 units, up 1.0% from February and 5.4% from one year ago (930,000). Unsold inventory sits at a 2.6-month supply at the current sales pace, unchanged from February but up from 2.0 months in March 2022.
emphasis added
 Click on graph for larger image.
This graph shows existing home sales, on a Seasonally Adjusted Annual Rate (SAAR) basis since 1993.
Sales in March (4.44 million SAAR) were down 2.4% from the previous month and were 22.0% below the March 2022 sales rate.
The second graph shows nationwide inventory for existing homes.
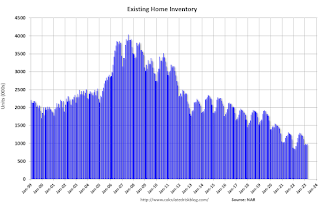 According to the NAR, inventory increased to 0.98 million in March from 0.97 million in February.
 According to the NAR, inventory increased to 0.98 million in March from 0.97 million in February.
Headline inventory is not seasonally adjusted, and inventory usually decreases to the seasonal lows in December and January, and peaks in mid-to-late summer.
The last graph shows the year-over-year (YoY) change in reported existing home inventory and months-of-supply. Since inventory is not seasonally adjusted, it really helps to look at the YoY change. Note: Months-of-supply is based on the seasonally adjusted sales and not seasonally adjusted inventory.
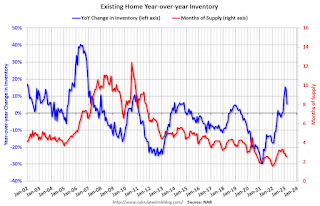 Inventory was up 5.4% year-over-year (blue) in March compared to March 2022.
Months of supply (red) was unchanged at 2.6 months in March from 2.6 months in February.
This was below the consensus forecast. I'll have more later.
The last graph shows the year-over-year (YoY) change in reported existing home inventory and months-of-supply. Since inventory is not seasonally adjusted, it really helps to look at the YoY change. Note: Months-of-supply is based on the seasonally adjusted sales and not seasonally adjusted inventory.
 Inventory was up 5.4% year-over-year (blue) in March compared to March 2022.
 Months of supply (red) was unchanged at 2.6 months in March from 2.6 months in February.
This was below the consensus forecast. I'll have more later.
Weekly Initial Unemployment Claims increase to 245,000
by Calculated Risk on 4/20/2023 08:33:00 AM
The DOL reported:
In the week ending April 15, the advance figure for seasonally adjusted initial claims was 245,000, an increase of 5,000 from the previous week's revised level. The previous week's level was revised up by 1,000 from 239,000 to 240,000. The 4-week moving average was 239,750, a decrease of 500 from the previous week's revised average. The previous week's average was revised up by 250 from 240,000 to 240,250.The following graph shows the 4-week moving average of weekly claims since 1971.
emphasis added
 Click on graph for larger image.
The dashed line on the graph is the current 4-week average. The four-week average of weekly unemployment claims decreased to 239,750.
The previous week was revised up.
Weekly claims were above the consensus forecast.
Wednesday, April 19, 2023
Thursday: Existing Home Sales, Unemployment Claims, Philly Fed Mfg
by Calculated Risk on 4/19/2023 09:01:00 PM
 Note: Mortgage rates are from MortgageNewsDaily.com and are for top tier scenarios.
Thursday:
• At 8:30 AM ET, The initial weekly unemployment claims report will be released. The consensus is for 240 thousand initial claims, up from 239 thousand last week.
• Also at 8:30 AM, the Philly Fed manufacturing survey for April. The consensus is for a reading of -20.0, up from -24.6.
• At 10:00 AM, Existing Home Sales for March from the National Association of Realtors (NAR). The consensus is for 4.50 million SAAR, down from 4.58 million.
LA Port Inbound Traffic Down Sharply YoY in March
by Calculated Risk on 4/19/2023 04:11:00 PM
Notes: The expansion to the Panama Canal was completed in 2016 (As I noted several years ago), and some of the traffic that used the ports of Los Angeles and Long Beach is probably going through the canal. This might be impacting TEUs on the West Coast.
Container traffic gives us an idea about the volume of goods being exported and imported - and usually some hints about the trade report since LA area ports handle about 40% of the nation's container port traffic.
The following graphs are for inbound and outbound traffic at the ports of Los Angeles and Long Beach in TEUs (TEUs: 20-foot equivalent units or 20-foot-long cargo container).
To remove the strong seasonal component for inbound traffic, the first graph shows the rolling 12-month average.
 Click on graph for larger image.
On a rolling 12-month basis, inbound traffic decreased 3.7% in March compared to the rolling 12 months ending in February. Outbound traffic increased 0.2% compared to the rolling 12 months ending the previous month.
The 2nd graph is the monthly data (with a strong seasonal pattern for imports).
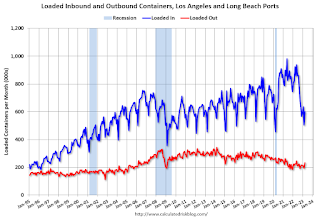 Usually imports peak in the July to October period as retailers import goods for the Christmas holiday, and then decline sharply and bottom in February or March depending on the timing of the Chinese New Year.
 Usually imports peak in the July to October period as retailers import goods for the Christmas holiday, and then decline sharply and bottom in February or March depending on the timing of the Chinese New Year.
Imports were down 35% YoY in March, and exports were up 3% YoY. The volume of containers unloaded last year was much stronger because of all the ships waiting to unload.
It is possible that exports have bottomed after declining for several years (even prior to the pandemic).
Fed's Beige Book: "The labor market becoming less tight ... increases to the labor supply"
by Calculated Risk on 4/19/2023 02:05:00 PM
Fed's Beige Book "This report was prepared at the Federal Reserve Bank of Richmond based on information collected on or before April 10, 2023."
Overall economic activity was little changed in recent weeks. Nine Districts reported either no change or only a slight change in activity this period while three indicated modest growth. Expectations for future growth were mostly unchanged as well; however, two Districts saw outlooks deteriorate. Consumer spending was generally seen as flat to down slightly amid continued reports of moderate price growth. Auto sales remained steady overall, with only a couple of Districts reporting improved sales and inventory levels. Travel and tourism picked up across much of the country this period. Manufacturing activity was widely reported as flat or down even as supply chains continued to improve. Transportation and freight volumes were also flat to down, according to several Districts. On balance, residential real estate sales and new construction activity softened modestly. Nonresidential construction was little changed while sales and leasing activity was generally flat to down. Lending volumes and loan demand generally declined across consumer and business loan types. Several Districts noted that banks tightened lending standards amid increased uncertainty and concerns about liquidity. The majority of Districts reported steady to increasing demand and sales for nonfinancial services. Agriculture conditions were mostly unchanged in recent weeks while some softening was reported in energy markets.
Employment growth moderated somewhat this period as several Districts reported a slower pace of growth than in recent Beige Book reports. A small number of firms reported mass layoffs, and those were centered at a subset of the largest companies. Some other firms opted to allow for natural attrition to occur, and to hire only for critically important roles. Contacts reported the labor market becoming less tight as several Districts noted increases to the labor supply. Additionally, firms benefited from better employee retention, which allowed them to hire for open roles while not constantly trying to back-fill positions. Wages have shown some moderation but remain elevated. Several Districts reported declining needs for off-cycle wage increases compared to last year.
emphasis added
4th Look at Local Housing Markets: California Home Sales down 34% YoY in March; Prices Down 7.0% YoY
by Calculated Risk on 4/19/2023 11:53:00 AM
Today, in the Calculated Risk Real Estate Newsletter: 4th Look at Local Housing Markets: California Home Sales down 34% YoY in March; Prices Down 7.0% YoY
A brief excerpt:
This is the fourth look at local markets in March. I’m tracking about 40 local housing markets in the US. Some of the 40 markets are states, and some are metropolitan areas. I’ll update these tables throughout the month as additional data is released.There is much more in the article. You can subscribe at https://calculatedrisk.substack.com/
...
Here is the press release from the California Association of Realtors® (C.A.R.): Uptick in mortgage interest rates nudges down California home sales in March, C.A.R. reports• Existing, single-family home sales totaled 281,050 in March on a seasonally adjusted annualized rate, down 1.0 percent from February and down 34.2 percent from March 2022....
• March’s statewide median home price was $791,490, up 7.6 percent from February and down 7.0 percent from March 2022.Closed Sales in March
In March, sales in these markets were down 20.8%. In February, these same markets were down 21.8% YoY Not Seasonally Adjusted (NSA).
This is a slightly smaller YoY decline NSA than in February for these markets. The March existing home sales report will show another significant YoY decline and will be the 19th consecutive month with a YoY decline in sales.


