 RSS Feed
 by Calculated Risk on 1/19/2023 09:33:00 AM
Thursday, January 19, 2023
December Housing Starts: Record Number of Housing Units Under Construction
Today, in the CalculatedRisk Real Estate Newsletter: December Housing Starts: Record Number of Housing Units Under Construction
Excerpt:
Possibly Important: Multi-family permits averaged 536,000 SAAR over the last two months after averaging close to 650,000 SAAR over the previous 8 months. This decline in permits is a possible signal that the expected decline in multi-family starts has begun (although permits aren’t a perfect leading indicator for starts).There is much more in the post. You can subscribe at https://calculatedrisk.substack.com/
...
The fifth graph shows housing starts under construction, Seasonally Adjusted (SA).
Red is single family units. Currently there are 769 thousand single family units (red) under construction (SA). This was up slightly in December compared to November, but 59 thousand below the recent peak in April and May. Single family units under construction have peaked since single family starts are now declining. The reason there are so many homes under construction is probably due to supply constraints.
Blue is for 2+ units. Currently there are 943 thousand multi-family units under construction. This is the highest level since December 1973! For multi-family, construction delays are probably also a factor. The completion of these units should help with rent pressure.
Combined, there are an all-time record 1.712 million units under construction.
...
The recent weakness has been mostly for single family starts; however, it appears the expected decline in multi-family starts has begun.

Weekly Initial Unemployment Claims decrease to 190,000
by Calculated Risk on 1/19/2023 08:41:00 AM
The DOL reported:
In the week ending January 14, the advance figure for seasonally adjusted initial claims was 190,000, a decrease of 15,000 from the previous week's unrevised level of 205,000. The 4-week moving average was 206,000, a decrease of 6,500 from the previous week's unrevised average of 212,500.The following graph shows the 4-week moving average of weekly claims since 1971.
emphasis added
 Click on graph for larger image.
The dashed line on the graph is the current 4-week average. The four-week average of weekly unemployment claims decreased to 206,000.
The previous week was unrevised.
Weekly claims were below the consensus forecast.
Housing Starts Decreased to 1.382 million Annual Rate in December
by Calculated Risk on 1/19/2023 08:37:00 AM
From the Census Bureau: Permits, Starts and Completions
Housing Starts:
Privately‐owned housing starts in December were at a seasonally adjusted annual rate of 1,382,000. This is 1.4 percent below the revised November estimate of 1,401,000 and is 21.8 percent below the December 2021 rate of 1,768,000. Single‐family housing starts in December were at a rate of 909,000; this is 11.3 percent above the revised November figure of 817,000. The December rate for units in buildings with five units or more was 463,000.
An estimated 1,553,300 housing units were started in 2022. This is 3.0 percent below the 2021 figure of 1,601,000.
Building Permits:
Privately‐owned housing units authorized by building permits in December were at a seasonally adjusted annual rate of 1,330,000. This is 1.6 percent below the revised November rate of 1,351,000 and is 29.9 percent below the December 2021 rate of 1,896,000. Single‐family authorizations in December were at a rate of 730,000; this is 6.5 percent below the revised November figure of 781,000. Authorizations of units in buildings with five units or more were at a rate of 555,000 in December.
An estimated 1,649,400 housing units were authorized by building permits in 2022. This is 5.0 percent below the 2021 figure of 1,737,000.
emphasis added
 Click on graph for larger image.
The first graph shows single and multi-family housing starts for the last several years.
Multi-family starts (blue, 2+ units) decreased in December compared to November. Multi-family starts were down 14.9% year-over-year in December.
Single-family starts (red) increased in December and were down 25.0% year-over-year.
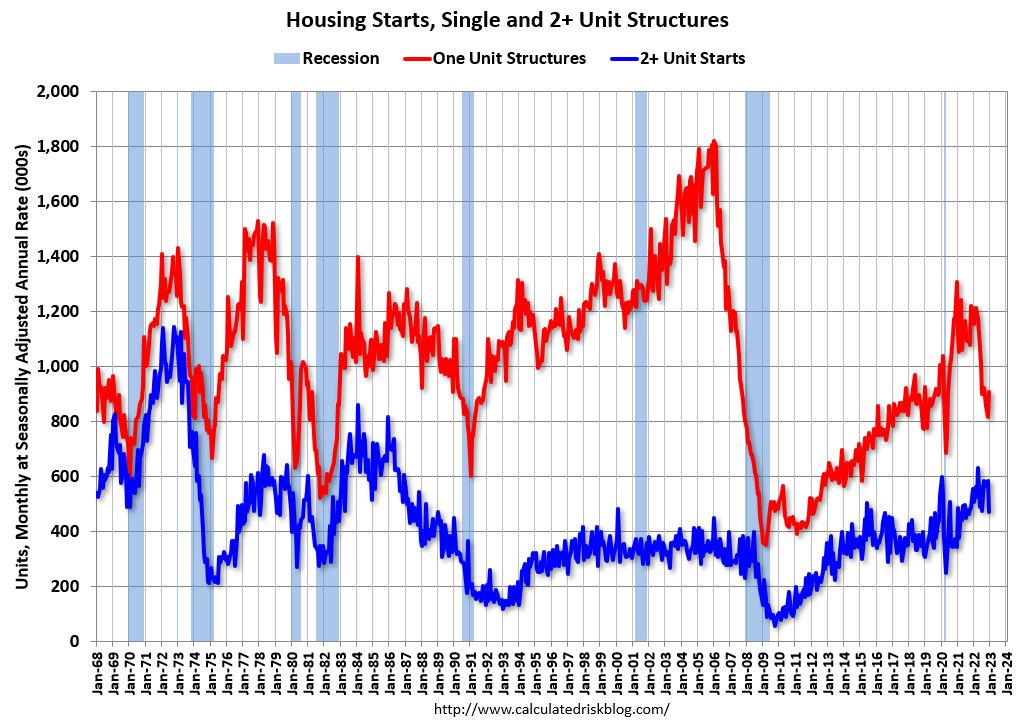 The second graph shows single and multi-family housing starts since 1968.
 This shows the huge collapse following the housing bubble, and then the eventual recovery - and the recent collapse in single-family starts.
Total housing starts in December were above expectations, however, starts in October and November were revised down, combined.
I'll have more later …
Wednesday, January 18, 2023
Thursday: Housing Starts, Unemployment Claims, Philly Fed Mfg
by Calculated Risk on 1/18/2023 09:02:00 PM
 Note: Mortgage rates are from MortgageNewsDaily.com and are for top tier scenarios.
Thursday:
• At 8:30 AM: The initial weekly unemployment claims report will be released. The consensus is for 212 thousand initial claims, up from 205 thousand last week.
• At 8:30 AM: Housing Starts for December. The consensus is for 1.358 million SAAR, down from 1.427 million SAAR.
• At 8:30 AM: the Philly Fed manufacturing survey for January.
4th Look at Local Housing Markets in December; California Home Sales down 44% YoY in December; Prices Down 2.8% YoY
by Calculated Risk on 1/18/2023 03:59:00 PM
Today, in the Calculated Risk Real Estate Newsletter: 4th Look at Local Housing Markets in December
A brief excerpt:
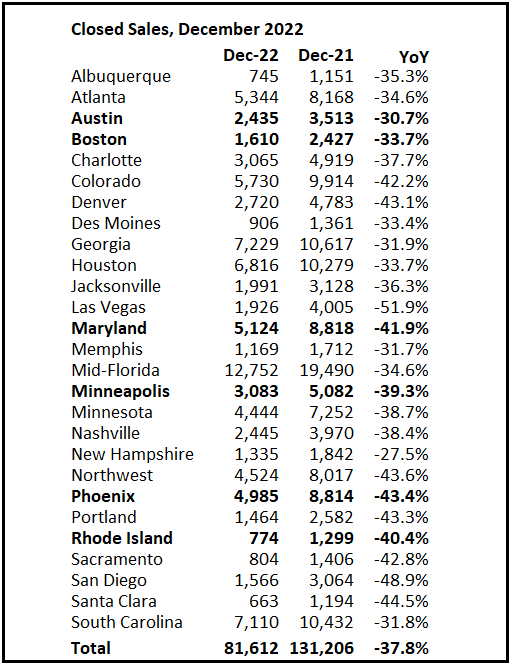
This is the fourth look at local markets in December. I’m tracking about 40 local housing markets in the US. Some of the 40 markets are states, and some are metropolitan areas. I’ll update these tables throughout the month as additional data is released.There is much more in the article. You can subscribe at https://calculatedrisk.substack.com/
...
Here is the press release from the California Association of Realtors® (C.A.R.): Interest rate reprieve bolsters December home sales, C.A.R. reports• Existing, single-family home sales totaled 240,330 in December on a seasonally adjusted annualized rate, up 1.1 percent from November and down 44.1 percent from December 2021.
• December’s statewide median home price was, $774,580 down 0.4% percent from November and down 2.8% percent from December 2021.In December, sales were down 37.8%. In November, these same markets were down 38.1% YoY Not Seasonally Adjusted (NSA).
This is a similar YoY decline as in November for these markets. If national sales decline by the same percent as last month, the NAR will report sales for December under 4.0 million SAAR - below the 4.01 million in May 2020 (pandemic low) and the lowest sales rate since 2010.
Fed's Beige Book: "A sizable volume of new apartment development is due to be completed in 2023"
by Calculated Risk on 1/18/2023 03:17:00 PM
Fed's Beige Book "This report was prepared at the Federal Reserve Bank of Cleveland based on information collected on or before January 9, 2023."
Overall economic activity was relatively unchanged since the previous report. Five Districts reported slight or modest increases in overall activity, six noted no change or slight declines, and one cited a significant decline. On balance, contacts generally expected little growth in the months ahead. Consumer spending increased slightly, with some retailers reporting more robust sales over the holidays. Other retailers noted that high inflation continued to reduce consumers' purchasing power, particularly among low- and moderate-income households. Auto sales were flat on average, but some dealers noted that increased vehicle availability had boosted sales. Tourism contacts reported moderate to robust activity augmented by strong holiday travel. Manufacturers indicated that activity declined modestly on average, and, in many Districts, reported that supply chain disruptions had eased. Housing markets continued to weaken, with sales and construction declining across Districts. Commercial real estate activity slowed slightly, on average, with more notable weakening in the office market. Nonfinancial services firms experienced stable demand on balance. Most bankers reported that residential mortgage demand remained weak, and some said higher borrowing costs had begun to dampen commercial lending. Energy activity continued to increase moderately, and agriculture conditions were generally unchanged or improving.And some regional comments on apartments:
Employment continued to grow at a modest to moderate pace for most Districts. Only one District reported a slight decline in employment, and one other reported no change in employment levels.
emphasis added
New York: A sizable volume of new apartment development is due to be completed in 2023.
...
St Louis: In November, month-over-month median rental rates on new leases fell in all four major District MSAs for both one- and two-bedroom apartments.
...
Dallas: Apartment leasing softened beyond seasonality, with occupancy and rents slipping modestly.
NAHB: Builder Confidence Increased in January
by Calculated Risk on 1/18/2023 10:05:00 AM
The National Association of Home Builders (NAHB) reported the housing market index (HMI) was at 35, up from 31 last month. Any number below 50 indicates that more builders view sales conditions as poor than good.
From the NAHB: Builder Confidence Uptick Signals Turning Point for Housing Lies Ahead
A modest drop in interest rates helped to end a string of 12 straight monthly declines in builder confidence levels, although sentiment remains in bearish territory as builders continue to grapple with elevated construction costs, building material supply chain disruptions and challenging affordability conditions.
Builder confidence in the market for newly built single-family homes in January rose four points to 35, according to the National Association of Home Builders (NAHB)/Wells Fargo Housing Market Index (HMI) released today.
“It appears the low point for builder sentiment in this cycle was registered in December, even as many builders continue to use a variety of incentives, including price reductions, to bolster sales,” said NAHB Chairman Jerry Konter, a home builder and developer from Savannah, Ga. “The rise in builder sentiment also means that cycle lows for permits and starts are likely near, and a rebound for home building could be underway later in 2023.”
“While NAHB is forecasting a decline for single-family starts this year compared to 2022, it appears a turning point for housing lies ahead,” said NAHB Chief Economist Robert Dietz. “In the coming quarters, single-family home building will rise off of cycle lows as mortgage rates are expected to trend lower and boost housing affordability. Improved housing affordability will increase housing demand, as the nation grapples with a structural housing deficit of 1.5 million units.”
...
All three HMI indices posted gains for the first time since December 2021. The HMI index gauging current sales conditions in January rose four points to 40, the component charting sales expectations in the next six months increased two points to 37 and the gauge measuring traffic of prospective buyers increased three points to 23.
Looking at the three-month moving averages for regional HMI scores, the West registered a one-point gain to 27, the South held steady at 36, the Northeast fell four points to 33 and the Midwest dropped two points to 32.
emphasis added
 Click on graph for larger image.
This graph shows the NAHB index since Jan 1985.
This was above the consensus forecast.
The "traffic of prospective buyers" is still well below breakeven at 23 (below 50).
Industrial Production Decreased 0.7 Percent in December
by Calculated Risk on 1/18/2023 09:25:00 AM
From the Fed: Industrial Production and Capacity Utilization
Industrial production decreased 0.7 percent in December and 1.7 percent at an annual rate in the fourth quarter. In December, manufacturing output fell 1.3 percent amid widespread declines across the sector. The index for utilities jumped 3.8 percent, as cold temperatures boosted the demand for heating, while the index for mining moved down 0.9 percent. At 103.4 percent of its 2017 average, total industrial production in December was 1.6 percent above its year-earlier level. Capacity utilization dropped 0.6 percentage point in December to 78.8 percent, a rate that is 0.8 percentage point below its long-run (1972–2021) average,
emphasis added
 Click on graph for larger image.
This graph shows Capacity Utilization. This series is up from the record low set in April 2020, and above the level in February 2020 (pre-pandemic).
Capacity utilization at 78.8% is 0.8% below the average from 1972 to 2021. This was below consensus expectations.
Note: y-axis doesn't start at zero to better show the change.
 The second graph shows industrial production since 1967.
Industrial production decreased in December to 104.5. This is above the pre-pandemic level.
The change in industrial production was below consensus expectations.
Retail Sales Decreased 1.1% in December
by Calculated Risk on 1/18/2023 08:40:00 AM
On a monthly basis, retail sales were down 1.1% from November to December (seasonally adjusted), and sales were up 6.0 percent from December 2021.
From the Census Bureau report:
Advance estimates of U.S. retail and food services sales for December 2022, adjusted for seasonal variation and holiday and trading-day differences, but not for price changes, were $677.1 billion, down 1.1 percent from the previous month, but up 6.0 percent above December 2021.
emphasis added
 Click on graph for larger image.
This graph shows retail sales since 1992. This is monthly retail sales and food service, seasonally adjusted (total and ex-gasoline).
Retail sales ex-gasoline were down 0.8% in December.
The second graph shows the year-over-year change in retail sales and food service (ex-gasoline) since 1993.
Retail and Food service sales, ex-gasoline, increased by 6.8% on a YoY basis.
 Sales in December were below expectations, and sales in October and November were revised down, combined.
MBA: Mortgage Applications Increase in Latest Weekly Survey
by Calculated Risk on 1/18/2023 07:00:00 AM
From the MBA: Mortgage Applications Increase in Latest MBA Weekly Survey
Mortgage applications increased 27.9 percent from one week earlier, according to data from the Mortgage Bankers Association’s (MBA) Weekly Mortgage Applications Survey for the week ending January 13, 2023.
... The Refinance Index increased 34 percent from the previous week and was 81 percent lower than the same week one year ago. The seasonally adjusted Purchase Index increased 25 percent from one week earlier. The unadjusted Purchase Index increased 32 percent compared with the previous week and was 35 percent lower than the same week one year ago.
“Mortgage application activity rebounded strongly in the first full week of January, with both refinance and purchase activity increasing by double-digit percentages compared to last week, which included the New Year’s holiday observance,” said Mike Fratantoni, MBA’s SVP and Chief Economist. “Despite these gains, refinance activity remains more than 80% below last year’s pace and purchase volume remains 35% below year-ago levels.”
Added Fratantoni, “Mortgage rates are now at their lowest level since September 2022, and about a percentage point below the peak mortgage rate last fall. As we enter the beginning of the spring buying season, lower mortgage rates and more homes on the market will help affordability for first-time homebuyers.”
...
The average contract interest rate for 30-year fixed-rate mortgages with conforming loan balances ($726,200 or less) decreased to 6.23 percent from 6.42 percent, with points decreasing to 0.67 from 0.73 (including the origination fee) for 80 percent loan-to-value ratio (LTV) loans.
emphasis added
 Click on graph for larger image.
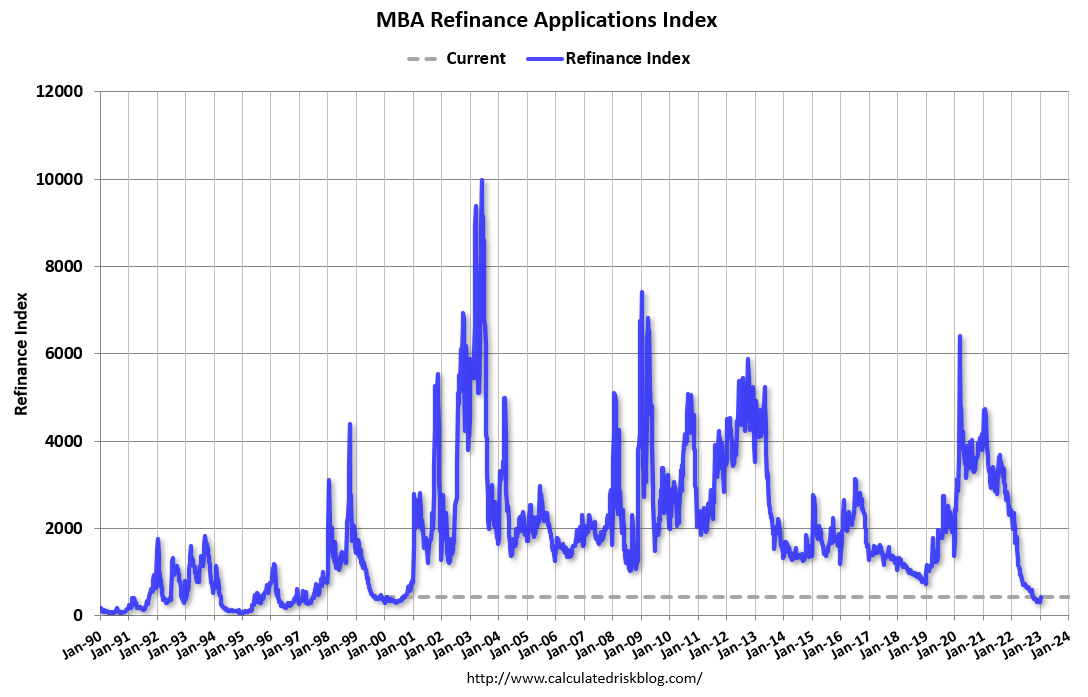
The first graph shows the refinance index since 1990.
With higher mortgage rates, the refinance index declined sharply in 2022.
Two weeks ago, the refinance index was at the lowest level since the year 2000, but it has rebounded a little as rates declined.
The second graph shows the MBA mortgage purchase index.
 According to the MBA, purchase activity is down 35% year-over-year unadjusted.
Note: Red is a four-week average (blue is weekly).


