 RSS Feed
 by Calculated Risk on 12/26/2022 10:00:00 AM
Monday, December 26, 2022
Four High Frequency Indicators for the Economy
This will likely be the final weekly update of these high frequency indicators. I've been posting these and more since the beginning of the pandemic. It has been interesting watching these sectors recover as the pandemic impact subsided.
The TSA is providing daily travel numbers.
This data is as of December 25th.
 Click on graph for larger image.
This data shows the 7-day average of daily total traveler throughput from the TSA for 2019 (Light Blue), 2020 (Black), 2021 (Blue) and 2022 (Red).
The dashed line is the percent of 2019 for the seven-day average.
The 7-day average is 10.1% below the same week in 2019 (89.9% of 2019). (Dashed line)
Air travel - as a percent of 2019 - has picked up recently - but still below pre-pandemic levels.
----- Movie Tickets: Box Office Mojo -----
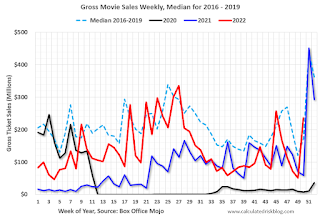 This data shows domestic box office for each week and the median for the years 2016 through 2019 (dashed light blue).
 This data shows domestic box office for each week and the median for the years 2016 through 2019 (dashed light blue).
 Black is 2020, Blue is 2021 and Red is 2022.
The data is from BoxOfficeMojo through December 22nd.
Note that the data is usually noisy week-to-week and depends on when blockbusters are released.
Movie ticket sales were at $236 million last week, up about 37% from the median for the week - thanks to "Avatar: The Way of Water".
Note that the data is usually noisy week-to-week and depends on when blockbusters are released.
Movie ticket sales were at $236 million last week, up about 37% from the median for the week - thanks to "Avatar: The Way of Water".
 This graph shows the seasonal pattern for the hotel occupancy rate using the four-week average.
 The red line is for 2022, black is 2020, blue is the median, and dashed light blue is for 2021. Dashed purple is 2019 (STR is comparing to a strong year for hotels).
This data is through Dec 17th. The occupancy rate was up 9.2% compared to the same week in 2019.
The 4-week average of the occupancy rate is above the median rate for the previous 20 years (Blue) and close to 2019 levels.
Notes: Y-axis doesn't start at zero to better show the seasonal change.
Notes: Y-axis doesn't start at zero to better show the seasonal change.

This graph, based on weekly data from the U.S. Energy Information Administration (EIA), shows gasoline supplied compared to the same week of 2019.
Blue is for 2020. Purple is for 2021, and Red is for 2022.
As of December 16th, gasoline supplied was down 7.4% compared to the same week in 2019.
Recently gasoline supplied has been running below 2019 and 2021 levels - and sometimes below 2020.
Sunday, December 25, 2022
A Very Nerdy Christmas
by Calculated Risk on 12/25/2022 11:25:00 AM
CR Note: This is from Tanta December 25, 2007!
From Mortgage Pig™.


I suppose this requires some explanation. Many years and versions of Excel ago, I was in some interminable conference call--I believe we were discussing general ledger interface mapping for HUD-1 line items regarding undisbursed escrow items on the FHA 203(k) in the servicing system upload, or perhaps we were watching paint dry--when I experienced one of those evolutionary breakthroughs for which the human race is justly famous. I stopped doodling on my legal pad and started defacing my spreadsheet. In a word, Excel Art was born.
An entire running gag developed, centered on the character of Mortgage Pig and his Adventures. The Pig you see above is a newer version; the old Pig didn't wear lipstick (old pig was developed before we started selling loans to Wall Street). You can, of course, print these images, but outside of the context of viewing them in Excel, they simply become primitive, childlike doodles of no particular resonance. Viewing them as a spreadsheet, on the other hand, makes them profoundly amusing. Really. There's just nothing like sending someone a file named "GL Error Recon 071597" and having a pig pop up when the workbook is opened for a knee-slapping good time. If you're a hopeless Nerd with no particular aesthetic sensibilities.
Our own regular commenter bacon dreamz, who is also accomplished with Word Art, has (woe betide his employer) become adept at Excel Art as well, under my provocation, and has developed a way cool variation, Excel Movies. This involves creating a large number of worksheets with tediously copied and edited images that, when you ctrl-page down rapidly, create crude animation. It takes a very long series of conference calls to produce a really good Excel Movie, but it can be done. Unfortunately they're hard to display on a blog post. You'll have to take my word for it that they're hysterical.
I wanted to give you all a little Christmas present. Those of you who spend large portions of your day on conference calls with a spreadsheet in front of you and have no consciences will, I hope, be inspired to create your own Excel Art, so that a drab, utilitarian, sometimes soul-destroying corporate existence may be enlivened with wit, creativity, and expropriation of exploited labor. For those of you who don't use Excel, I hope Santa brought you a new box of crayons.
Happy Holidays to all of you.
UPDATE: Because you wanted to know what was on sheet 3.

Saturday, December 24, 2022
Real Estate Newsletter Articles this Week: Existing-Home Sales Decreased to 4.09 million SAAR in November
by Calculated Risk on 12/24/2022 02:11:00 PM
At the Calculated Risk Real Estate Newsletter this week:
• NAR: Existing-Home Sales Decreased to 4.09 million SAAR in November
• November Housing Starts: Record Number of Housing Units Under Construction
• New Home Sales Increased in November; Previous 3 Months Revised Down Sharply
• Lawler: Update on Rent Trends
• 4th Look at Local Housing Markets in November; California Sales off 48% YoY
This is usually published 4 to 6 times a week and provides more in-depth analysis of the housing market.
You can subscribe at https://calculatedrisk.substack.com/
Most content is available for free (and no Ads), but please subscribe!
Schedule for Week of December 25, 2022
by Calculated Risk on 12/24/2022 08:11:00 AM
Happy Holidays and Merry Christmas!
The key indicator this week is Case-Shiller House Prices for October.
All US markets will be closed in observance of the Christmas Holiday.
9:00 AM: FHFA House Price Index for October. This was originally a GSE only repeat sales, however there is also an expanded index.
 9:00 AM ET: S&P/Case-Shiller House Price Index for October.
This graph shows graph shows the Year over year change in the seasonally adjusted National Index, Composite 10 and Composite 20 indexes through the most recent report (the Composite 20 was started in January 2000).
The consensus is for an 8.0% year-over-year increase in the Composite 20 index for October.
10:30 AM: Dallas Fed Survey of Manufacturing Activity for December.
10:00 AM: Pending Home Sales Index for November. The consensus is for a 0.5% decrease in the index.
10:00 AM: Richmond Fed Survey of Manufacturing Activity for December. This is the last of regional manufacturing surveys for December.
8:30 AM: The initial weekly unemployment claims report will be released. The consensus is for 224 thousand initial claims, up from 216 thousand last week.
9:45 AM: Chicago Purchasing Managers Index for December.
Friday, December 23, 2022
COVID Dec 23, 2022: Update on Cases, Hospitalizations and Deaths
by Calculated Risk on 12/23/2022 09:07:00 PM
On COVID (focus on hospitalizations and deaths). Data is now weekly.
| COVID Metrics | ||||
|---|---|---|---|---|
| Now | Week Ago | Goal | ||
| New Cases per Week2🚩 | 487,367 | 455,028 | ≤35,0001 | |
| Hospitalized2🚩 | 33,027 | 31,900 | ≤3,0001 | |
| Deaths per Week2🚩 | 2,952 | 2,699 | ≤3501 | |
| 1my goals to stop weekly posts, 2Weekly for Cases, Currently Hospitalized, and Deaths 🚩 Increasing number weekly for Cases, Hospitalized, and Deaths ✅ Goal met. | ||||
 Click on graph for larger image.
This graph shows the weekly (columns) number of deaths reported.
January was the worst month for the previous two years, and hopefully this January will not see a significant wave.
Hotels: Occupancy Rate Up 9.2% Compared to Same Week in 2019
by Calculated Risk on 12/23/2022 01:39:00 PM
U.S. hotel performance came in lower than the previous week but showed improved comparisons to 2019 in part because of a favorable calendar shift, according to STR‘s latest data through Dec. 17.The following graph shows the seasonal pattern for the hotel occupancy rate using the four-week average.
Dec. 11-17, 2022 (percentage change from comparable week in 2019*):
• Occupancy: 54.5% (+9.2%)
• Average daily rate (ADR): $135.08 (+23.7%)
• Revenue per available room (RevPAR): $73.65 (+35.1%)
The corresponding week in 2019 ended on 21 December, which brought performance down lower for that period.
*Due to the pandemic impact, STR is measuring recovery against comparable time periods from 2019.
emphasis added
Click on graph for larger image.The red line is for 2022, black is 2020, blue is the median, and dashed light blue is for 2021. Dashed purple is 2019 (STR is comparing to a strong year for hotels).
The 4-week average of the occupancy rate is above the median rate for the previous 20 years (Blue) and close to 2019 levels.
Note: Y-axis doesn't start at zero to better show the seasonal change.
The 4-week average of the occupancy rate will decline through the New Year and then start increasing.
Q4 GDP Tracking
by Calculated Risk on 12/23/2022 01:39:00 PM
From Goldman:
We boosted our Q4 GDP tracking estimate by one tenth to +1.7% (qoq ar), reflecting a larger contribution from inventories but slower consumption growth.And from the Altanta Fed: GDPNow
emphasis added [Dec 23rd estimate]
The GDPNow model estimate for real GDP growth (seasonally adjusted annual rate) in the fourth quarter of 2022 is 3.7 percent on December 23, up from 2.7 percent on December 20. After recent releases from the US Census Bureau, the US Bureau of Economic Analysis, and the National Association of Realtors, the nowcasts of fourth-quarter real personal consumption expenditures growth and fourth-quarter real gross private domestic investment growth increased from 3.4 percent and -0.2 percent, respectively, to 3.6 percent and 3.8 percent, respectively. [Dec 23rd estimate]
New Home Sales Increased in November; Previous 3 Months Revised Down Sharply
by Calculated Risk on 12/23/2022 10:43:00 AM
Today, in the Calculated Risk Real Estate Newsletter: New Home Sales Increased in November; Previous 3 Months Revised Down Sharply
Brief excerpt:
The next graph shows the months of supply by stage of construction. “Months of supply” is inventory at each stage, divided by the sales rate.You can subscribe at https://calculatedrisk.substack.com/.
There are 1.2 months of completed supply (red line). This is getting close to the normal level.
The inventory of new homes under construction is at 5.5 months (blue line). This elevated level of homes under construction is due to supply chain constraints.
And about 2.0 months of potential inventory have not been started (grey line) - about double the normal level. Homebuilders are probably waiting to start some homes until they have a firmer grasp on prices and demand.
...
As I discussed two months ago, the Census Bureau overestimates sales, and underestimates inventory when cancellation rates are rising, see: New Home Sales and Cancellations: Net vs Gross Sales. So, take the headline sales number with a large grain of salt - the actual negative impact on the homebuilders is far greater than the headline number suggests!
There are a large number of homes under construction, and this suggests we will see a sharp increase in completed inventory over the next several months - and that will put pressure on new home prices.

New Home Sales Increase to 640,000 Annual Rate in November
by Calculated Risk on 12/23/2022 10:08:00 AM
The Census Bureau reports New Home Sales in November were at a seasonally adjusted annual rate (SAAR) of 640 thousand.
The previous three months were revised down sharply.
Sales of new single‐family houses in November 2022 were at a seasonally adjusted annual rate of 640,000, according to estimates released jointly today by the U.S. Census Bureau and the Department of Housing and Urban Development. This is 5.8 percent above the revised October rate of 605,000, but is 15.3 percent below the November 2021 estimate of 756,000.
emphasis added
 Click on graph for larger image.
The first graph shows New Home Sales vs. recessions since 1963. The dashed line is the current sales rate.
New home sales are below pre-pandemic levels.
The second graph shows New Home Months of Supply.
 The months of supply decreased in November to 8.6 months from 9.3 months in October.
 The all-time record high was 12.1 months of supply in January 2009. The all-time record low was 3.5 months, most recently in October 2020.
This is well above the top of the normal range (about 4 to 6 months of supply is normal).
"The seasonally‐adjusted estimate of new houses for sale at the end of November was 461,000. This represents a supply of 8.6 months at the current sales rate."
 The last graph shows sales NSA (monthly sales, not seasonally adjusted annual rate).
In November 2022 (red column), 46 thousand new homes were sold (NSA). Last year, 54 thousand homes were sold in November.
The all-time high for November was 86 thousand in 2005, and the all-time low for November was 20 thousand in 2010.
This was above expectations, however sales in the three previous months were revised down. I'll have more later today.
Personal Income increased 0.4% in November; Spending increased 0.1%
by Calculated Risk on 12/23/2022 08:36:00 AM
The BEA released the Personal Income and Outlays report for November:
Personal income increased $80.1 billion (0.4 percent) in November, according to estimates released today by the Bureau of Economic Analysis. Disposable personal income (DPI) increased $68.6 billion (0.4 percent) and personal consumption expenditures (PCE) increased $19.8 billion (0.1 percent).The November PCE price index increased 5.5 percent year-over-year (YoY), down from 6.1 percent YoY in October.
The PCE price index increased 0.1 percent. Excluding food and energy, the PCE price index increased 0.2 percent. Real DPI increased 0.3 percent in November and real PCE increased less than 0.1 percent; goods decreased 0.6 percent and services increased 0.3 percent.
emphasis added
The PCE price index, excluding food and energy, increased 4.7 percent YoY, down from 5.0 percent in October.
The following graph shows real Personal Consumption Expenditures (PCE) through November 2022 (2012 dollars). Note that the y-axis doesn't start at zero to better show the change.
 Click on graph for larger image.
The dashed red lines are the quarterly levels for real PCE.
Personal income was above expectations, and the increase in PCE was below expectations.
Inflation was lower than expected.
Using the two-month method to estimate Q4 real PCE growth, real PCE was increasing at a 4.0% annual rate in Q3 2022. (Using the mid-month method, real PCE was increasing at 3.0%)
Using the two-month method to estimate Q4 real PCE growth, real PCE was increasing at a 4.0% annual rate in Q3 2022. (Using the mid-month method, real PCE was increasing at 3.0%)


