 RSS Feed
 by Calculated Risk on 12/21/2022 10:14:00 AM
Wednesday, December 21, 2022
NAR: Existing-Home Sales Decreased to 4.09 million SAAR in November
From the NAR: Existing-Home Sales Dipped 7.7% in November
Existing-home sales declined for the tenth month in a row in November, according to the National Association of REALTORS®. All four major U.S. regions recorded month-over-month and year-over-year declines.
Total existing-home sales – completed transactions that include single-family homes, townhomes, condominiums and co-ops – waned 7.7% from October to a seasonally adjusted annual rate of 4.09 million in November. Year-over-year, sales dwindled by 35.4% (down from 6.33 million in November 2021).
...
Total housing inventory registered at the end of November was 1.14 million units, which was down 6.6% from October, but up 2.7% from one year ago (1.11 million). Unsold inventory sits at a 3.3-month supply at the current sales pace, which was identical to October, but up from 2.1 months in November 2021.
emphasis added
 Click on graph for larger image.
This graph shows existing home sales, on a Seasonally Adjusted Annual Rate (SAAR) basis since 1993.
Sales in November (4.09 million SAAR) were down 7.7% from the previous month and were 35.4% below the November 2021 sales rate.
The second graph shows nationwide inventory for existing homes.
 According to the NAR, inventory decreased to 1.14 million in November from 1.22 million in October.
Headline inventory is not seasonally adjusted, and inventory usually decreases to the seasonal lows in December and January, and peaks in mid-to-late summer.
The last graph shows the year-over-year (YoY) change in reported existing home inventory and months-of-supply. Since inventory is not seasonally adjusted, it really helps to look at the YoY change. Note: Months-of-supply is based on the seasonally adjusted sales and not seasonally adjusted inventory.
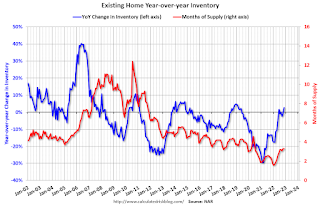 Inventory was up 2.7% year-over-year (blue) in November compared to November 2021.
Months of supply (red) was unchanged at 3.3 months in November from 3.3 months in October.
This was below the consensus forecast. I'll have more later.
The last graph shows the year-over-year (YoY) change in reported existing home inventory and months-of-supply. Since inventory is not seasonally adjusted, it really helps to look at the YoY change. Note: Months-of-supply is based on the seasonally adjusted sales and not seasonally adjusted inventory.
 Inventory was up 2.7% year-over-year (blue) in November compared to November 2021.
 Months of supply (red) was unchanged at 3.3 months in November from 3.3 months in October.
This was below the consensus forecast. I'll have more later.
MBA: Mortgage Applications Increase in Latest Weekly Survey
by Calculated Risk on 12/21/2022 07:00:00 AM
From the MBA: Mortgage Applications Increase in Latest MBA Weekly Survey
— Mortgage applications increased 0.9 percent from one week earlier, according to data from the Mortgage Bankers Association’s (MBA) Weekly Mortgage Applications Survey for the week ending December 16, 2022.
... The Refinance Index increased 6 percent from the previous week and was 85 percent lower than the same week one year ago. The seasonally adjusted Purchase Index decreased 0.1 percent from one week earlier. The unadjusted Purchase Index decreased 3 percent compared with the previous week and was 36 percent lower than the same week one year ago.
“The Federal Reserve raised its short-term rate target last week, but longer-term rates, including mortgage rates, declined for the week, with the 30-year conforming rate reaching 6.34 percent – its lowest level since September,” said Mike Fratantoni, MBA’s SVP and Chief Economist. “Refinance application volume increased slightly in response but was still about 85 percent below year-ago levels. This is a particularly slow time of year for homebuying, so it is not surprising that purchase applications did not move much in response to lower mortgage rates.”
Added Fratantoni: “The latest data on the housing market show that homebuilders are pulling back the pace of new construction in response to low levels of traffic, and we expect this weakness in demand will persist in 2023, as the U.S. is likely to enter a recession. However, if mortgage rates continue to trend down, as we are forecasting, more buyers are likely to return to the market later in the year, as affordability improves with both lower rates and slower home-price growth.”
...
The average contract interest rate for 30-year fixed-rate mortgages with conforming loan balances ($647,200 or less) decreased to 6.34 percent from 6.42 percent, with points decreasing to 0.59 from 0.64 (including the origination fee) for 80 percent loan-to-value ratio (LTV) loans.
emphasis added
 Click on graph for larger image.
The first graph shows the refinance index since 1990.
With higher mortgage rates, the refinance index has declined sharply this year.
The refinance index is up slightly from the low in November 2022 (an extreme low).
The second graph shows the MBA mortgage purchase index
 According to the MBA, purchase activity is down 36% year-over-year unadjusted.
The purchase index is at the pandemic low and up from the low in October 2022.
Note: Red is a four-week average (blue is weekly).
Note: Red is a four-week average (blue is weekly).
Tuesday, December 20, 2022
Wednesday: Existing Home Sales
by Calculated Risk on 12/20/2022 09:00:00 PM
 Note: Mortgage rates are from MortgageNewsDaily.com and are for top tier scenarios.
Wednesday:
• At 7:00 AM ET, The Mortgage Bankers Association (MBA) will release the results for the mortgage purchase applications index.
• 10:00 AM, Existing Home Sales for November from the National Association of Realtors (NAR). The consensus is for 4.20 million SAAR, down from 4.43 million
CoreLogic: "Annual Single-Family Rent Price Growth Falls to Single Digits in October"
by Calculated Risk on 12/20/2022 11:39:00 AM
From CoreLogic: Annual US Single-Family Rent Price Growth Falls to Single Digits in October, CoreLogic Reports
U.S. rental price growth slowed for the sixth straight month on an annual basis in October to 8.8%, the lowest rate of appreciation in more than a year but still three times higher than the pre-pandemic level. Despite the continued cooling, a shortage of available properties is keeping costs elevated, a trend that is partially fueling year-over-year gains in the lower-priced tier. Miami led the nation for rent growth for the 15th consecutive month at 16.3%, but gains there have slowed dramatically since the spring when they hit 40.8%.
“Single-family rents decreased again on a monthly basis in October but were still up year over year,” said Molly Boesel, principal economist at CoreLogic. “While rents typically experience a seasonal decline in October, this year’s decrease was larger than average and could point to prices slowing more sharply than expected in the coming months.”
emphasis added
 Click on graph for larger image.
This graph from CoreLogic shows the year-over-year change in rents for several price tiers.
This index was reported to be up 10.2% YoY in September - and is slowing quickly.
November Housing Starts: Record Number of Housing Units Under Construction
by Calculated Risk on 12/20/2022 09:27:00 AM
Today, in the CalculatedRisk Real Estate Newsletter: November Housing Starts: Record Number of Housing Units Under Construction
Excerpt:
Possibly Important: Note the sharp decline in multi-family permits in November. This has been averaging close to 650,000 SAAR over the last 8 months and declined to 509,000 in November from 620,000 in October. This is a possible signal that the expected decline in multi-family starts will happen soon (although permits aren’t a perfect leading indicator for starts).There is much more in the post. You can subscribe at https://calculatedrisk.substack.com/
...
The fourth graph shows housing starts under construction, Seasonally Adjusted (SA).
Red is single family units. Currently there are 777 thousand single family units (red) under construction (SA). This is below the previous seven months, and 51 thousand below the recent peak in April and May. Single family units under construction have peaked since single family starts are now declining. The reason there are so many homes under construction is probably due to supply constraints.
Blue is for 2+ units. Currently there are 932 thousand multi-family units under construction. This is the highest level since December 1973! For multi-family, construction delays are probably also a factor. The completion of these units should help with rent pressure.
Combined, there are 1.709 million units under construction. This ties last month as the all-time record number of units under construction.
...
Multi-family starts will likely slow soon due to a combination of less rent growth and higher interest rates. We are already seeing a slowdown in design for multi-family.

Housing Starts Decreased to 1.427 million Annual Rate in November
by Calculated Risk on 12/20/2022 08:36:00 AM
From the Census Bureau: Permits, Starts and Completions
Housing Starts:
Privately‐owned housing starts in November were at a seasonally adjusted annual rate of 1,427,000. This is 0.5 percent below the revised October estimate of 1,434,000 and is 16.4 percent below the November 2021 rate of 1,706,000. Single‐family housing starts in November were at a rate of 828,000; this is 4.1 percent below the revised October figure of 863,000. The November rate for units in buildings with five units or more was 584,000.
Building Permits:
Privately‐owned housing units authorized by building permits in November were at a seasonally adjusted annual rate of 1,342,000. This is 11.2 percent below the revised October rate of 1,512,000 and is 22.4 percent below the November 2021 rate of 1,729,000. Single‐family authorizations in November were at a rate of 781,000; this is 7.1 percent below the revised October figure of 841,000. Authorizations of units in buildings with five units or more were at a rate of 509,000 in November.
emphasis added
 Click on graph for larger image.
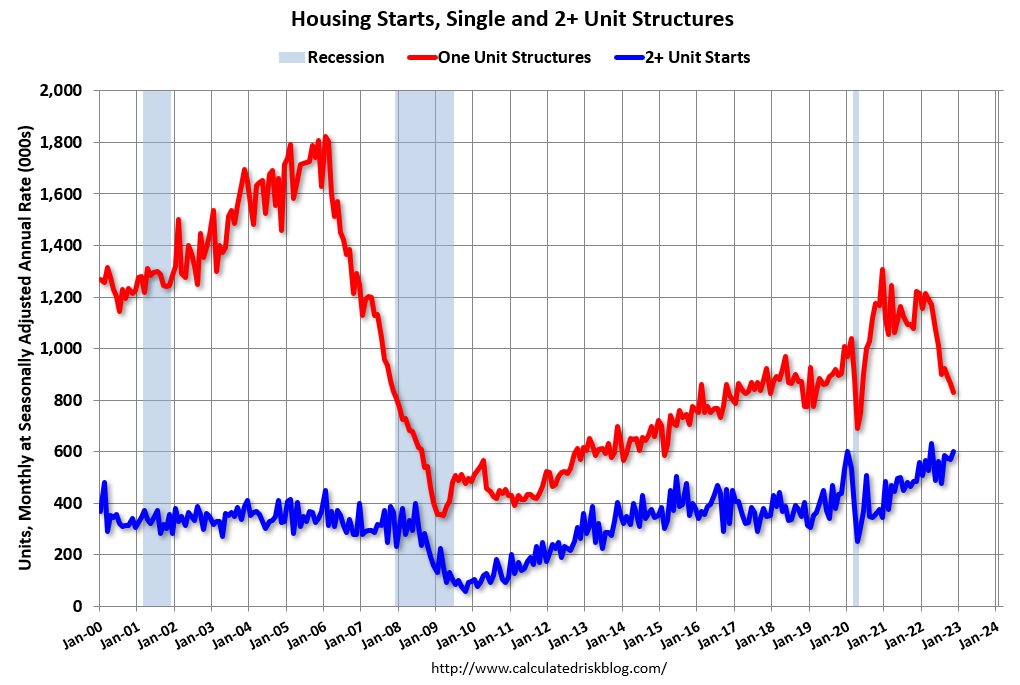
The first graph shows single and multi-family housing starts for the last several years.
Multi-family starts (blue, 2+ units) increased in November compared to October. Multi-family starts were up 23.3% year-over-year in November.
Single-family starts (red) decreased in November and were down 32.1% year-over-year.
 The second graph shows single and multi-family housing starts since 1968.
 This shows the huge collapse following the housing bubble, and then the eventual recovery.
Total housing starts in November were above expectations, however, starts in September and October were revised down, combined.
I'll have more later …
Monday, December 19, 2022
Tuesday: Housing Starts
by Calculated Risk on 12/19/2022 08:12:00 PM
 From Matthew Graham at Mortgage News Daily: Mortgage Rates Slightly Higher to Start Holiday-Shortened Week
In specific terms today, the average lender is offering a conventional 30yr fixed rate that is roughly an eighth of a point higher than Friday afternoon. [30 year fixed 6.27%]Tuesday:
emphasis added
• At 8:30 AM, 8:30 AM: Housing Starts for November. The consensus is for 1.400 million SAAR, down from 1.425 million SAAR.
MBA Survey: "Share of Mortgage Loans in Forbearance Remains Flat at 0.70% in November"
by Calculated Risk on 12/19/2022 04:00:00 PM
Note: This is as of November 30th.
From the MBA: Share of Mortgage Loans in Forbearance Remains Flat at 0.70% in November
The Mortgage Bankers Association’s (MBA) monthly Loan Monitoring Survey revealed that the total number of loans now in forbearance remained flat relative to the prior month at 0.70% as of November 30, 2022. According to MBA’s estimate, 350,000 homeowners are in forbearance plans.
The share of Fannie Mae and Freddie Mac loans in forbearance increased 1 basis point to 0.32%. Ginnie Mae loans in forbearance increased 5 basis points to 1.46%, and the forbearance share for portfolio loans and private-label securities (PLS) declined 6 basis points to 0.97%.
“There were pockets of weakness in the November data, despite the forbearance rate remaining unchanged and the overall loan performance of serviced loans staying mostly flat,” said Marina Walsh, CMB, MBA’s Vice President of Industry Analysis. “The forbearance rate for Ginnie Mae loans increased for the fourth consecutive month, and the overall performance of the portfolio declined for the third consecutive month. Furthermore, the performance of government post-forbearance workouts also weakened.”
Added Walsh, “With many indicators pointing to a recession and higher unemployment in 2023, many of the most vulnerable homeowners will be those with FHA, VA, or other government loans. Loss mitigation options may help to ease the financial hardship for these homeowners.”
emphasis added
 Click on graph for larger image.
This graph shows the percent of portfolio in forbearance by investor type over time.
The share of forbearance plans had been decreasing, although the percent in forbearance was unchanged in November. At the end of November, there were about 350,000 homeowners in forbearance plans.
4th Look at Local Housing Markets in November; California Sales off 48% YoY
by Calculated Risk on 12/19/2022 11:16:00 AM
Today, in the Calculated Risk Real Estate Newsletter: 4th Look at Local Housing Markets in November; California Sales off 48% YoY
A brief excerpt:
Here is a table comparing the year-over-year Not Seasonally Adjusted (NSA) declines in sales this year from the National Association of Realtors® (NAR) with the local markets I track. So far, these measures have tracked closely, and the preliminary data below suggests a sharp decline in sales in November.There is much more in the article. You can subscribe at https://calculatedrisk.substack.com/
NOTE: Housing economist Tom Lawler expects the NAR to report sales of 4.16 million SAAR for November (the NAR reports this coming Wednesday). The consensus is for the NAR to report 4.20 million. (Lawler has an excellent track record).
Sales in some of the hottest markets are down around 40% YoY (all of California was down 47.7%), whereas in other markets, sales are only down in around 20% YoY.
In November, sales were down 36.3% in these markets. In October, these same markets were down 28.6% YoY Not Seasonally Adjusted (NSA).
Note that in November 2022, there were the same number of selling days as in November 2021, so the SA decline will be similar to the NSA decline. And this suggests another significant step down in sales in November!
...
More local markets to come!

NAHB: Builder Confidence Decreased Further in December
by Calculated Risk on 12/19/2022 10:06:00 AM
The National Association of Home Builders (NAHB) reported the housing market index (HMI) was at 31, down from 33 last month. Any number below 50 indicates that more builders view sales conditions as poor than good.
From the NAHB: Reflecting a Weakening Housing Market, Builder Confidence Declined Every Month in 2022
High mortgage rates, elevated construction costs running well above the inflation rate and flagging consumer demand due to deteriorating affordability conditions have dragged builder sentiment down every month in 2022.
Builder confidence in the market for newly built single-family homes posted its 12th straight monthly decline in December, dropping two points to 31, according to the National Association of Home Builders (NAHB)/Wells Fargo Housing Market Index (HMI) released today. This is the lowest confidence reading since mid-2012, with the exception of the onset of the pandemic in the spring of 2020.
“In this high inflation, high mortgage rate environment, builders are struggling to keep housing affordable for home buyers,” said NAHB Chairman Jerry Konter, a home builder and developer from Savannah, Ga. “Our latest survey shows 62% of builders are using incentives to bolster sales, including providing mortgage rate buy-downs, paying points for buyers and offering price reductions. But with construction costs up more than 30% since inflation began to take off at the beginning of the year, there is little room for builders to cut prices. Only 35% of builders reduced homes prices in December, edging down from 36% in November. The average price reduction was 8%, up from 5% or 6% earlier in the year.”
“The silver lining in this HMI report is that it is the smallest drop in the index in the past six months, indicating that we are possibly nearing the bottom of the cycle for builder sentiment,” said NAHB Chief Economist Robert Dietz. “Mortgage rates are down from above 7% in recent weeks to about 6.3% today, and for the first time since April, builders registered an increase in future sales expectations.”
Dietz added that in this tenuous economic climate, builders still need to plan a year or more out when thinking about land and construction timelines.“NAHB is expecting weaker housing conditions to persist in 2023, and we forecast a recovery coming in 2024, given the existing nationwide housing deficit of 1.5 million units and future, lower mortgage rates anticipated with the Fed easing monetary policy in 2024.”
...
The HMI index gauging current sales conditions fell three points to 36 and traffic of prospective buyers held steady at 20. The component charting sales expectations in the next six months increased four points to 35.
Looking at the three-month moving averages for regional HMI scores, the Northeast fell five points to 37, the Midwest dropped four points to 34, the South fell six points to 36 and the West posted a three-point decline to 26.
emphasis added
 Click on graph for larger image.
This graph shows the NAHB index since Jan 1985.
This was below the consensus forecast, and the lowest level since 2012 (excluding the one month low at the beginning of the pandemic).
The "traffic of prospective buyers" is now well below breakeven at 20 (below 50).


