 RSS Feed
 by Calculated Risk on 12/17/2022 02:11:00 PM
Saturday, December 17, 2022
Real Estate Newsletter Articles this Week: Another Step Down for Sales in November
At the Calculated Risk Real Estate Newsletter this week:
• Lawler: Early Read on Existing Home Sales in November
• 3rd Look at Local Housing Markets in November
• Current State of the Housing Market; Overview for mid-December
• Housing, Inflation and Why the Fed Should Consider a Pause
• 2nd Look at Local Housing Markets in November
This is usually published 4 to 6 times a week and provides more in-depth analysis of the housing market.
You can subscribe at https://calculatedrisk.substack.com/
Most content is available for free (and no Ads), but please subscribe!
Schedule for Week of December 18, 2022
by Calculated Risk on 12/17/2022 08:11:00 AM
The key economic reports this week are Housing Starts, New Home Sales, Existing Home Sales, the 3rd estimate of Q3 GDP, and November Personal income and outlays.
10:00 AM: The December NAHB homebuilder survey. The consensus is for a reading of 33, unchanged from 33. Any number below 50 indicates that more builders view sales conditions as poor than good.
 8:30 AM: Housing Starts for November.
 This graph shows single and multi-family housing starts since 1968.
The consensus is for 1.400 million SAAR, down from 1.425 million SAAR.
7:00 AM ET: The Mortgage Bankers Association (MBA) will release the results for the mortgage purchase applications index.
 10:00 AM: Existing Home Sales for November from the National Association of Realtors (NAR). The consensus is for 4.20 million SAAR, down from 4.43 million.
The graph shows existing home sales from 1994 through the report last month.
Housing economist Tom Lawler expects the NAR to report sales of 4.16 million SAAR for November.
8:30 AM: The initial weekly unemployment claims report will be released. The consensus is for 225 thousand initial claims, up from 211 thousand last week.
8:30 AM: Gross Domestic Product, 3rd quarter 2022 (Third estimate). The consensus is for real GDP at 2.9% annualized, unchanged from the second estimate of 2.9%.
8:30 AM: Chicago Fed National Activity Index for November. This is a composite index of other data.
11:00 AM: the Kansas City Fed manufacturing survey for December.
8:30 AM: Durable Goods Orders for November. The consensus is for a 0.1% increase..
8:30 AM: Personal Income and Outlays for November. The consensus is for a 0.2% increase in personal income, and for a 0.2% increase in personal spending. And for a 0.3% increase in the PCE prices index, and the Core PCE price index to increase 0.2%. PCE prices are expected to be up 5.7% YoY, and core PCE prices up 4.7% YoY.
 10:00 AM: New Home Sales for November from the Census Bureau.
 This graph shows New Home Sales since 1963. The dashed line is the sales rate for last month.
The consensus is for 595 thousand SAAR, down from 632 thousand in October.
10:00 AM: University of Michigan's Consumer sentiment index (Final for December).
10:00 AM: State Employment and Unemployment (Monthly) for November 2022
Friday, December 16, 2022
COVID Dec 16, 2022: Update on Cases, Hospitalizations and Deaths
by Calculated Risk on 12/16/2022 09:41:00 PM
On COVID (focus on hospitalizations and deaths). Data is now weekly.
| COVID Metrics | ||||
|---|---|---|---|---|
| Now | Week Ago | Goal | ||
| New Cases per Week2 | 455,466 | 469,240 | ≤35,0001 | |
| Hospitalized2🚩 | 31,599 | 30,000 | ≤3,0001 | |
| Deaths per Week2 | 3,115 | 2,703 | ≤3501 | |
| 1my goals to stop weekly posts, 2Weekly for Cases, Currently Hospitalized, and Deaths 🚩 Increasing number weekly for Cases, Hospitalized, and Deaths ✅ Goal met. | ||||
 Click on graph for larger image.
This graph shows the weekly (columns) number of deaths reported.
California November Existing Home Sales Down Almost 50% YoY, Prices Down YoY
by Calculated Risk on 12/16/2022 03:59:00 PM
From the California Association of Realtors®: Rapid interest rate increases continue to depress California home sales and prices in November, C.A.R. reports
• Existing, single-family home sales totaled 237,740 in November on a seasonally adjusted annualized rate, down 13.2 percent from October and down 47.7 percent from November 2021.
• November’s statewide median home price was $777,500, down 3.0 percent from October and down 0.6 percent from November 2021.
...
Housing demand in California continued to fall as rising interest rates further dampened the state’s housing market in November as home sales registered the lowest annualized pace since October 2007 and the largest year-over-year sales drop in at least the past four decades, the CALIFORNIA ASSOCIATION OF REALTORS® (C.A.R.) said today.
Closed escrow sales of existing, single-family detached homes in California totaled a seasonally adjusted annualized rate of 237,740 in November, according to information collected by C.A.R. from more than 90 local REALTOR® associations and MLSs statewide. The statewide annualized sales figure represents what would be the total number of homes sold during 2022 if sales maintained the November pace throughout the year. It is adjusted to account for seasonal factors that typically influence home sales. November’s sales pace was down 13.2 percent on a monthly basis from 274,040 in October and down 47.7 percent from a year ago, when 454,450 homes were sold on an annualized basis. The year-to-year sales decline was the biggest since 1980.
Home sales have been on a downward trend for 17 straight months on a year-over-year basis. It was the fourth time in the last five months that sales dropped more than 30 percent from the year-ago level. The monthly 13.2 percent sales decline was worse than the long-run average of -0.5 percent change recorded between an October and a November in the past 43 years. Sales in all price segments dropped more than 40 percent year-over-year, with the $2 million plus price segment falling the most at 47.7percent. The most affordable market (sub-$300,000) experienced the smallest sales drop at 41.4 percent.
...
California’s median home price declined for the third straight month, dropping 3.0 percent in November to $777,500 from the $801,190 recorded in October. November’s price was 0.6 percent lower than the $782,480 recorded last November and marked the first year-over-year price decline in 30 months. The November 2022 price was also the lowest since February 2022.
...
• Housing inventory in California continued to rise both month-to-month and year-to-year as the market entered its holiday season and home sellers remained on the sideline. The statewide unsold inventory index (UII) was unchanged from the prior month at 3.3 months in November, but it was more than doubled the level of 1.6 months recorded in the same month of last year.
emphasis added
LA Port Inbound Traffic Down Sharply in November
by Calculated Risk on 12/16/2022 11:38:00 AM
Notes: The expansion to the Panama Canal was completed in 2016 (As I noted a few years ago), and some of the traffic that used the ports of Los Angeles and Long Beach is probably going through the canal. This might be impacting TEUs on the West Coast.
Container traffic gives us an idea about the volume of goods being exported and imported - and usually some hints about the trade report since LA area ports handle about 40% of the nation's container port traffic.
The following graphs are for inbound and outbound traffic at the ports of Los Angeles and Long Beach in TEUs (TEUs: 20-foot equivalent units or 20-foot-long cargo container).
To remove the strong seasonal component for inbound traffic, the first graph shows the rolling 12-month average.
 Click on graph for larger image.
On a rolling 12-month basis, inbound traffic decreased 2.1% in November compared to the rolling 12 months ending in October. Outbound traffic increased 0.9% compared to the rolling 12 months ending the previous month.
The 2nd graph is the monthly data (with a strong seasonal pattern for imports).
 Usually imports peak in the July to October period as retailers import goods for the Christmas holiday, and then decline sharply and bottom in February or March depending on the timing of the Chinese New Year.
Imports were down 26% YoY in November, and exports were up 12% YoY.
It is possible that exports have bottomed after declining for several years (even prior to the pandemic).
Lawler: Early Read on Existing Home Sales in November
by Calculated Risk on 12/16/2022 09:44:00 AM
Today, in the Calculated Risk Real Estate Newsletter: Lawler: Early Read on Existing Home Sales in November
A brief excerpt:
From housing economist Tom Lawler:There is much more in the article. You can subscribe at https://calculatedrisk.substack.com/
Based on publicly available local realtor/MLS reports released across the country through today, I project that existing home sales as estimated by the National Association of Realtors ran at a seasonally adjusted annual rate of 4.16 million in November, down 6.1% from October’s preliminary pace and down 34.3%% from last November’s seasonally adjusted pace. On an unadjusted basis the YOY % decline in sales was largest in the West, and smallest in the Northeast and Midwest.
Thursday, December 15, 2022
Hotels: Occupancy Rate Down 1.2% Compared to Same Week in 2019
by Calculated Risk on 12/15/2022 04:22:00 PM
U.S. hotel performance came in higher than the previous week and showed improved comparisons to 2019, according to STR‘s latest data through Dec. 10.The following graph shows the seasonal pattern for the hotel occupancy rate using the four-week average.
Dec. 4-10, 2022 (percentage change from comparable week in 2019*):
• Occupancy: 59.6% (-1.2%)
• Average daily rate (ADR): $144.79 (+15.4%)
• Revenue per available room (RevPAR): $86.29 (+14.0%)
*Due to the pandemic impact, STR is measuring recovery against comparable time periods from 2019.
emphasis added
 Click on graph for larger image.
The red line is for 2022, black is 2020, blue is the median, and dashed light blue is for 2021. Dashed purple is 2019 (STR is comparing to a strong year for hotels).
The 4-week average of the occupancy rate is above the median rate for the previous 20 years (Blue) and close to 2019 levels.
Note: Y-axis doesn't start at zero to better show the seasonal change.
The 4-week average of the occupancy rate will decline through the New Year.
Realtor.com Reports Weekly Active Inventory Up 55% Year-over-year; New Listings Down 16%
by Calculated Risk on 12/15/2022 02:24:00 PM
Realtor.com has monthly and weekly data on the existing home market. Here is their weekly report released today from Chief Economist Danielle Hale: Weekly Housing Trends View — Data Week Ending Dec 10, 2022. Note: They have data on list prices, new listings and more, but this focus is on inventory.
• Active inventory growth held steady with for-sale homes up 55% above one year ago. Inventory growth climbed higher this week after last week’s first pause in eight weeks.
...
• New listings–a measure of sellers putting homes up for sale–were again down, this week by 16% from one year ago. This marks the twenty-third consecutive week of year-over-year declines in homeowners listing their home for sale, and the decline was much bigger than last week’s smallest decline since July.
 Here is a graph of the year-over-year change in inventory according to realtor.com.
 Note the rapid increase in the YoY change earlier this year, from down 30% at the beginning of the year, to up 29% YoY at the beginning of July.
Then the Realtor.com data was stuck at up around 26% to 30% YoY for 14 weeks in a row. This was due to the slowdown in new listings, even as sales had fallen sharply.
Then the YoY change started increasing sharply again (inventory is likely falling seasonally week-to-week now, but the comparison is YoY).
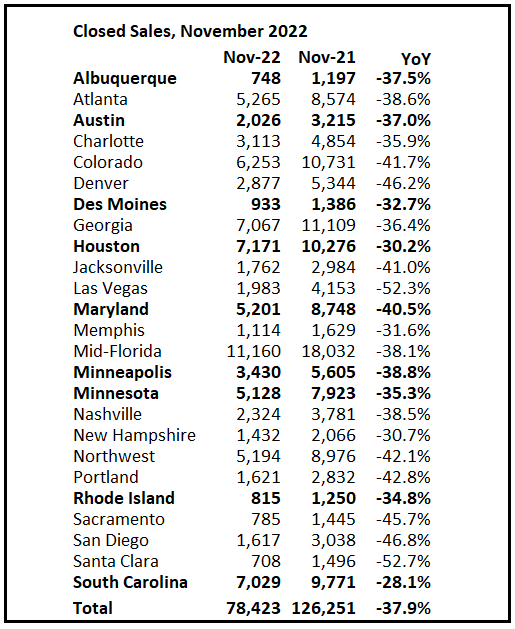
3rd Look at Local Housing Markets in November, Another significant step down in sales!
by Calculated Risk on 12/15/2022 11:50:00 AM
Today, in the Calculated Risk Real Estate Newsletter:
3rd Look at Local Housing Markets in November
A brief excerpt:
First, a few excerpts from the Austin Board of Realtors® November release:There is much more in the article. You can subscribe at https://calculatedrisk.substack.com/For the first time since February 2019, median home prices in the Austin-Round Rock MSA experienced a 0% year over year increase, according to the Austin Board of REALTORS® November 2022 Central Texas Housing Market Report....
… housing inventory almost quadrupled to 3.1 months of inventory year over year for the Austin-Round Rock MSA
emphasis added
In November, sales were down 37.9%. In October, these same markets were down 29.3% YoY Not Seasonally Adjusted (NSA).
Note that in November 2022, there were the same number of selling days as in November 2021, so the SA decline will be similar to the NSA decline. And this suggests another significant step down in sales in November!
...
Many more local markets to come!
Cleveland Fed: Median CPI increased 0.5% and Trimmed-mean CPI increased 0.2% in November
by Calculated Risk on 12/15/2022 09:12:00 AM
Note: The Cleveland Fed release was delayed this month. The Cleveland Fed released the median CPI and the trimmed-mean CPI:
According to the Federal Reserve Bank of Cleveland, the median Consumer Price Index rose 0.5% in November. The 16% trimmed-mean Consumer Price Index increased 0.2% in November. "The median CPI and 16% trimmed-mean CPI are measures of core inflation calculated by the Federal Reserve Bank of Cleveland based on data released in the Bureau of Labor Statistics’ (BLS) monthly CPI report".
 Click on graph for larger image.
This graph shows the year-over-year change for these four key measures of inflation.
On a year-over-year basis, the median CPI rose 7.0%, the trimmed-mean CPI rose 6.7%, and the CPI less food and energy rose 6.0%. Core PCE is for October and increased 5.0% year-over-year.
Note: The Cleveland Fed released the median CPI details here: "Used Cars" decreased at a 30% annualized rate in November.
Note that Owners' Equivalent Rent and Rent of Primary Residence account for almost 1/3 of median CPI, and these measures were up between 5.2% annualized in the Northeast and 10.4% in the South with an average of close to 8% annualized. This data is lagged, and actually rent growth has slowed sharply in recent months.


