 RSS Feed
 by Calculated Risk on 12/15/2022 04:22:00 PM
Thursday, December 15, 2022
Hotels: Occupancy Rate Down 1.2% Compared to Same Week in 2019
U.S. hotel performance came in higher than the previous week and showed improved comparisons to 2019, according to STR‘s latest data through Dec. 10.The following graph shows the seasonal pattern for the hotel occupancy rate using the four-week average.
Dec. 4-10, 2022 (percentage change from comparable week in 2019*):
• Occupancy: 59.6% (-1.2%)
• Average daily rate (ADR): $144.79 (+15.4%)
• Revenue per available room (RevPAR): $86.29 (+14.0%)
*Due to the pandemic impact, STR is measuring recovery against comparable time periods from 2019.
emphasis added
 Click on graph for larger image.
The red line is for 2022, black is 2020, blue is the median, and dashed light blue is for 2021. Dashed purple is 2019 (STR is comparing to a strong year for hotels).
The 4-week average of the occupancy rate is above the median rate for the previous 20 years (Blue) and close to 2019 levels.
Note: Y-axis doesn't start at zero to better show the seasonal change.
The 4-week average of the occupancy rate will decline through the New Year.
Realtor.com Reports Weekly Active Inventory Up 55% Year-over-year; New Listings Down 16%
by Calculated Risk on 12/15/2022 02:24:00 PM
Realtor.com has monthly and weekly data on the existing home market. Here is their weekly report released today from Chief Economist Danielle Hale: Weekly Housing Trends View — Data Week Ending Dec 10, 2022. Note: They have data on list prices, new listings and more, but this focus is on inventory.
• Active inventory growth held steady with for-sale homes up 55% above one year ago. Inventory growth climbed higher this week after last week’s first pause in eight weeks.
...
• New listings–a measure of sellers putting homes up for sale–were again down, this week by 16% from one year ago. This marks the twenty-third consecutive week of year-over-year declines in homeowners listing their home for sale, and the decline was much bigger than last week’s smallest decline since July.
 Here is a graph of the year-over-year change in inventory according to realtor.com.
 Note the rapid increase in the YoY change earlier this year, from down 30% at the beginning of the year, to up 29% YoY at the beginning of July.
Then the Realtor.com data was stuck at up around 26% to 30% YoY for 14 weeks in a row. This was due to the slowdown in new listings, even as sales had fallen sharply.
Then the YoY change started increasing sharply again (inventory is likely falling seasonally week-to-week now, but the comparison is YoY).
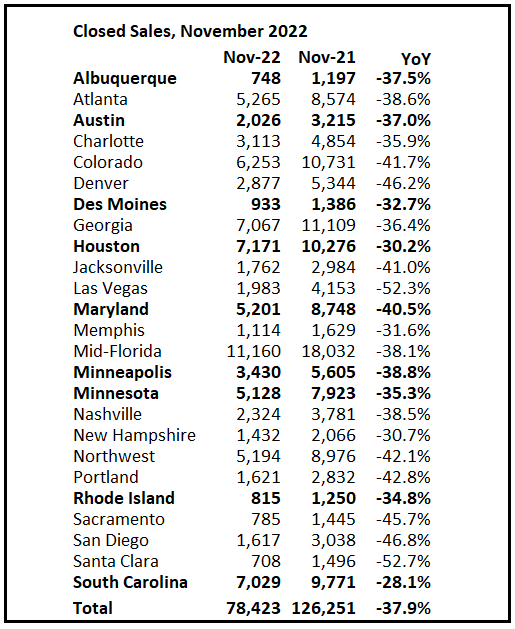
3rd Look at Local Housing Markets in November, Another significant step down in sales!
by Calculated Risk on 12/15/2022 11:50:00 AM
Today, in the Calculated Risk Real Estate Newsletter:
3rd Look at Local Housing Markets in November
A brief excerpt:
First, a few excerpts from the Austin Board of Realtors® November release:There is much more in the article. You can subscribe at https://calculatedrisk.substack.com/For the first time since February 2019, median home prices in the Austin-Round Rock MSA experienced a 0% year over year increase, according to the Austin Board of REALTORS® November 2022 Central Texas Housing Market Report....
… housing inventory almost quadrupled to 3.1 months of inventory year over year for the Austin-Round Rock MSA
emphasis added
In November, sales were down 37.9%. In October, these same markets were down 29.3% YoY Not Seasonally Adjusted (NSA).
Note that in November 2022, there were the same number of selling days as in November 2021, so the SA decline will be similar to the NSA decline. And this suggests another significant step down in sales in November!
...
Many more local markets to come!
Cleveland Fed: Median CPI increased 0.5% and Trimmed-mean CPI increased 0.2% in November
by Calculated Risk on 12/15/2022 09:12:00 AM
Note: The Cleveland Fed release was delayed this month. The Cleveland Fed released the median CPI and the trimmed-mean CPI:
According to the Federal Reserve Bank of Cleveland, the median Consumer Price Index rose 0.5% in November. The 16% trimmed-mean Consumer Price Index increased 0.2% in November. "The median CPI and 16% trimmed-mean CPI are measures of core inflation calculated by the Federal Reserve Bank of Cleveland based on data released in the Bureau of Labor Statistics’ (BLS) monthly CPI report".
 Click on graph for larger image.
This graph shows the year-over-year change for these four key measures of inflation.
On a year-over-year basis, the median CPI rose 7.0%, the trimmed-mean CPI rose 6.7%, and the CPI less food and energy rose 6.0%. Core PCE is for October and increased 5.0% year-over-year.
Note: The Cleveland Fed released the median CPI details here: "Used Cars" decreased at a 30% annualized rate in November.
Note that Owners' Equivalent Rent and Rent of Primary Residence account for almost 1/3 of median CPI, and these measures were up between 5.2% annualized in the Northeast and 10.4% in the South with an average of close to 8% annualized. This data is lagged, and actually rent growth has slowed sharply in recent months.
Retail Sales Decreased 0.6% in November
by Calculated Risk on 12/15/2022 08:45:00 AM
On a monthly basis, retail sales were up 0.6% from October to November (seasonally adjusted), and sales were up 6.5 percent from November 2021.
From the Census Bureau report:
Advance estimates of U.S. retail and food services sales for November 2022, adjusted for seasonal variation and holiday and trading-day differences, but not for price changes, were $689.4 billion, down 0.6 percent from the previous month, but up 6.5 percent above November 2021. ... The September 2022 to October 2022 percent change was unrevised from up 1.3 percent.
emphasis added
 Click on graph for larger image.
This graph shows retail sales since 1992. This is monthly retail sales and food service, seasonally adjusted (total and ex-gasoline).
Retail sales ex-gasoline were down 0.6% in November.
The second graph shows the year-over-year change in retail sales and food service (ex-gasoline) since 1993.
Retail and Food service sales, ex-gasoline, increased by 5.6% on a YoY basis.
 Sales in November were below expectations, and sales in September and October were revised down, combined.
Weekly Initial Unemployment Claims decrease to 211,000
by Calculated Risk on 12/15/2022 08:33:00 AM
The DOL reported:
In the week ending December 10, the advance figure for seasonally adjusted initial claims was 211,000, a decrease of 20,000 from the previous week's revised level. The previous week's level was revised up by 1,000 from 230,000 to 231,000. The 4-week moving average was 227,250, a decrease of 3,000 from the previous week's revised average. The previous week's average was revised up by 250 from 230,000 to 230,250.The following graph shows the 4-week moving average of weekly claims since 1971.
emphasis added
 Click on graph for larger image.
The dashed line on the graph is the current 4-week average. The four-week average of weekly unemployment claims decreased to 227,250.
The previous week was revised up.
Weekly claims were lower than the consensus forecast.
Wednesday, December 14, 2022
Thursday: Retail Sales, Unemployment Claims, Industrial Production
by Calculated Risk on 12/14/2022 09:02:00 PM
 Note: Mortgage rates are from MortgageNewsDaily.com and are for top tier scenarios.
Thursday:
• At 8:30 AM ET, Retail sales for November will be released. The consensus is for a 0.2% decrease in retail sales.
• Also at 8:30 AM, The initial weekly unemployment claims report will be released. The consensus is for 230 thousand initial claims, unchanged from 230 thousand last week.
• Also at 8:30 AM, The New York Fed Empire State manufacturing survey for December. The consensus is for a reading of -1.0, down from 4.5.
• Also at 8:30 AM, the Philly Fed manufacturing survey for December. The consensus is for a reading of -12.0, up from -19.4.
• At 9:15 AM, The Fed will release Industrial Production and Capacity Utilization for November. The consensus is for a 0.1% increase in Industrial Production, and for Capacity Utilization to decrease to 79.8%.
FOMC Projections and Press Conference
by Calculated Risk on 12/14/2022 02:12:00 PM
Statement here.
Fed Chair Powell press conference video here or on YouTube here, starting at 2:30 PM ET.
Here are the projections. In September, the FOMC participants’ midpoint of the target level for the federal funds rate was 4.625%. The FOMC participants’ midpoint of the target range is now closer to 5.125%.
Current Wall Street forecasts are for GDP to increase in 2022 Q4 over Q4, slightly above FOMC September projections. These tracking estimates would put Q4/Q4 at 0.63% in 2022. So, the FOMC revised up 2022 GDP slightly, but revised down 2023 GDP.
| GDP projections of Federal Reserve Governors and Reserve Bank presidents, Change in Real GDP1 | ||||
|---|---|---|---|---|
| Projection Date | 2022 | 2023 | 2024 | 2025 |
| Dec 2022 | 0.4 to 0.5 | 0.4 to 1.0 | 1.3 to 2.0 | 1.6 to 2.0 |
| Sept 2022 | 0.1 to 0.3 | 0.5 to 1.5 | 1.4 to 2.0 | 1.6 to 2.0 |
The unemployment rate was at 3.7% in November. So far, the economic slowdown has barely pushed up the unemployment rate, and the FOMC revised down the 2022 projection but revised 2023 up.
| Unemployment projections of Federal Reserve Governors and Reserve Bank presidents, Unemployment Rate2 | ||||
|---|---|---|---|---|
| Projection Date | 2022 | 2023 | 2024 | 2025 |
| Dec 2022 | 3.7 | 4.4 to 4.7 | 4.3 to 4.8 | 4.0 to 4.7 |
| Sept 2022 | 3.8 to 3.9 | 4.1 to 4.5 | 4.0 to 4.6 | 4.0 to 4.5 |
As of October 2022, PCE inflation was up 6.0% from October 2021. This was below the cycle high of 7.0% YoY in June. The FOMC revised up PCE inflation for 2022.
| Inflation projections of Federal Reserve Governors and Reserve Bank presidents, PCE Inflation1 | ||||
|---|---|---|---|---|
| Projection Date | 2022 | 2023 | 2024 | 2025 |
| Dec 2022 | 5.6 to 5.8 | 2.9 to 3.5 | 2.3 to 2.7 | 2.0 to 2.2 |
| Sept 2022 | 5.3 to 5.7 | 2.6 to 3.5 | 2.1 to 2.6 | 2.0 to 2.2 |
PCE core inflation was up 5.0% in October year-over-year. This was below the cycle high of 5.4% YoY in February. Core inflation has picked up more than expected and the FOMC revised up their projections.
| Core Inflation projections of Federal Reserve Governors and Reserve Bank presidents, Core Inflation1 | ||||
|---|---|---|---|---|
| Projection Date | 2022 | 2023 | 2024 | 2025 |
| Dec 2022 | 4.7 to 4.8 | 3.2 to 3.7 | 2.3 to 2.7 | 2.0 to 2.2 |
| Sept 2022 | 4.4 to 4.6 | 3.0 to 3.4 | 2.2 to 2.5 | 2.0 to 2.2 |
FOMC Statement: Raise Rates 50 bp; "Ongoing increases appropriate"
by Calculated Risk on 12/14/2022 02:02:00 PM
Fed Chair Powell press conference video here or on YouTube here, starting at 2:30 PM ET.
FOMC Statement:
Recent indicators point to modest growth in spending and production. Job gains have been robust in recent months, and the unemployment rate has remained low. Inflation remains elevated, reflecting supply and demand imbalances related to the pandemic, higher food and energy prices, and broader price pressures.
Russia's war against Ukraine is causing tremendous human and economic hardship. The war and related events are contributing to upward pressure on inflation and are weighing on global economic activity. The Committee is highly attentive to inflation risks.
The Committee seeks to achieve maximum employment and inflation at the rate of 2 percent over the longer run. In support of these goals, the Committee decided to raise the target range for the federal funds rate to 4-1/4 to 4-1/2 percent. The Committee anticipates that ongoing increases in the target range will be appropriate in order to attain a stance of monetary policy that is sufficiently restrictive to return inflation to 2 percent over time. In determining the pace of future increases in the target range, the Committee will take into account the cumulative tightening of monetary policy, the lags with which monetary policy affects economic activity and inflation, and economic and financial developments. In addition, the Committee will continue reducing its holdings of Treasury securities and agency debt and agency mortgage-backed securities, as described in the Plans for Reducing the Size of the Federal Reserve's Balance Sheet that were issued in May. The Committee is strongly committed to returning inflation to its 2 percent objective.
In assessing the appropriate stance of monetary policy, the Committee will continue to monitor the implications of incoming information for the economic outlook. The Committee would be prepared to adjust the stance of monetary policy as appropriate if risks emerge that could impede the attainment of the Committee's goals. The Committee's assessments will take into account a wide range of information, including readings on public health, labor market conditions, inflation pressures and inflation expectations, and financial and international developments.
Voting for the monetary policy action were Jerome H. Powell, Chair; John C. Williams, Vice Chair; Michael S. Barr; Michelle W. Bowman; Lael Brainard; James Bullard; Susan M. Collins; Lisa D. Cook; Esther L. George; Philip N. Jefferson; Loretta J. Mester; and Christopher J. Waller.
emphasis added
Current State of the Housing Market; Overview for mid-December
by Calculated Risk on 12/14/2022 10:18:00 AM
Today, in the Calculated Risk Real Estate Newsletter: Current State of the Housing Market; Overview for mid-December
A brief excerpt:
Over the last month …There is much more in the article. You can subscribe at https://calculatedrisk.substack.com/
1. New listings have declined further year-over-year (YoY).
2. Mortgage rates have declined recently but are still up sharply YoY.
3. House prices are declining month-over-month (MoM) as measured by the Case-Shiller repeat sales index.
4. Rents are falling.
...
And here is a graph comparing the YoY change in the NAR median prices vs the Case-Shiller National Index (the median is distorted by the mix of homes sold, and also lagged since this is for closing prices).
The YoY change in the median price peaked at 25.2% in May 2021 and has now slowed to 6.6%. In general, the NAR median price leads the Case-Shiller index by 2 to 3 months, so I expect the Case-Shiller index to show significantly slower YoY growth over the next several months.
...
Next Wednesday, the NAR will release existing home sales for November. This report will likely show another sharp year-over-year decline in sales for November.


