 RSS Feed
 by Calculated Risk on 11/30/2022 10:48:00 AM
Wednesday, November 30, 2022
Inflation Adjusted House Prices 3.3% Below Peak
Today, in the Calculated Risk Real Estate Newsletter: Inflation Adjusted House Prices 3.3% Below Peak
Excerpt:
It has been over 16 years since the bubble peak. In the Case-Shiller release yesterday, the seasonally adjusted National Index (SA), was reported as being 62% above the bubble peak in 2006. However, in real terms, the National index (SA) is about 12% above the bubble peak (and historically there has been an upward slope to real house prices). The composite 20, in real terms, is about 3% above the bubble peak.
Both indexes have declined for four consecutive months in real terms (inflation adjusted).
People usually graph nominal house prices, but it is also important to look at prices in real terms. As an example, if a house price was $200,000 in January 2000, the price would be almost $338,000 today adjusted for inflation (69% increase). That is why the second graph below is important - this shows "real" prices. ...
The second graph shows the same two indexes in real terms (adjusted for inflation using CPI less Shelter). Note: some people use other inflation measures to adjust for real prices. In real terms, the National index is 3.3% below the recent peak, and the Composite 20 index is 4.4% below the recent peak in 2022.
In real terms, house prices are still above the bubble peak levels. There is an upward slope to real house prices, and it has been over 16 years since the previous peak, but real prices are historically high.

There is much more in the article. You can subscribe at https://calculatedrisk.substack.com/
NAR: Pending Home Sales Decreased 4.6% in October, Year-over-year Down 37%
by Calculated Risk on 11/30/2022 10:11:00 AM
From the NAR: Pending Home Sales Declined 4.6% in October
Pending home sales slid for the fifth consecutive month in October, according to the National Association of REALTORS®. Three of four U.S. regions recorded month-over-month decreases, and all four regions recorded year-over-year declines in transactions.This was close to the expected decline for this index. Note: Contract signings usually lead sales by about 45 to 60 days, so this would usually be for closed sales in November and December.
The Pending Home Sales Index (PHSI), a forward-looking indicator of home sales based on contract signings, sank 4.6% to 77.1 in October. Year-over-year, pending transactions slipped by 37.0%. An index of 100 is equal to the level of contract activity in 2001.
"October was a difficult month for home buyers as they faced 20-year-high mortgage rates," said NAR Chief Economist Lawrence Yun. "The West region, in particular, suffered from the combination of high interest rates and expensive home prices. Only the Midwest squeaked out a gain."
"The upcoming months should see a return of buyers, as mortgage rates appear to have already peaked and have been coming down since mid-November."
...
The Northeast PHSI sank 4.3% from last month to 68.7, a fall of 29.5% from October 2021. The Midwest index increased 3.3% to 83.5 in October, a decrease of 32.1% from one year ago.
The South PHSI dropped 6.4% to 90.6 in October, falling 38.2% from the prior year. The West index slipped by 11.3% in October to 55.6, sinking 46.2% from October 2021.
emphasis added
BLS: Job Openings Decreased to 10.3 million in October
by Calculated Risk on 11/30/2022 10:06:00 AM
From the BLS: Job Openings and Labor Turnover Summary
The number of job openings edged down to 10.3 million on the last business day of October, the U.S. Bureau of Labor Statistics reported today. Over the month the number of hires and total separations changed little at 6.0 million and 5.7 million, respectively. Within separations, quits (4.0 million) and layoffs and discharges (1.4 million) changed little.The following graph shows job openings (black line), hires (dark blue), Layoff, Discharges and other (red column), and Quits (light blue column) from the JOLTS.
emphasis added
This series started in December 2000.
Note: The difference between JOLTS hires and separations is similar to the CES (payroll survey) net jobs headline numbers. This report is for October the employment report this Friday will be for November.
 Click on graph for larger image.
Note that hires (dark blue) and total separations (red and light blue columns stacked) are usually pretty close each month. This is a measure of labor market turnover. When the blue line is above the two stacked columns, the economy is adding net jobs - when it is below the columns, the economy is losing jobs.
The spike in layoffs and discharges in March 2020 is labeled, but off the chart to better show the usual data.
Jobs openings decreased in October to 10.334 million from 10.687 million in September.
The number of job openings (black) were down 7% year-over-year.
Quits were down 3% year-over-year. These are voluntary separations. (See light blue columns at bottom of graph for trend for "quits").
Q3 GDP Growth Revised Up to 2.9% Annual Rate
by Calculated Risk on 11/30/2022 08:33:00 AM
From the BEA: Gross Domestic Product (Second Estimate) and Corporate Profits (Preliminary), Third Quarter 2022
Real gross domestic product (GDP) increased at an annual rate of 2.9 percent in the third quarter of 2022, according to the "second" estimate released by the Bureau of Economic Analysis. In the second quarter, real GDP decreased 0.6 percent.Here is a Comparison of Second and Advance Estimates. PCE growth was revised up from 1.4% to 1.7%. Residential investment was revised down from -26.4% to -26.8%.
The GDP estimate released today is based on more complete source data than were available for the "advance" estimate issued last month. In the advance estimate, the increase in real GDP was 2.6 percent. The second estimate primarily reflected upward revisions to consumer spending and nonresidential fixed investment that were partly offset by a downward revision to private inventory investment. Imports, which are a subtraction in the calculation of GDP, decreased more than previously estimated
...
Real gross domestic income (GDI) increased 0.3 percent in the third quarter, in contrast to a decrease of 0.8 percent in the second quarter (revised). The average of real GDP and real GDI, a supplemental measure of U.S. economic activity that equally weights GDP and GDI, increased 1.6 percent in the third quarter, in contrast to a decrease of 0.7 percent (revised) in the second quarter.
emphasis added
ADP: Private Employment Increased 127,000 in November
by Calculated Risk on 11/30/2022 08:21:00 AM
Private sector employment increased by 127,000 jobs in November and annual pay was up 7.6 percent year-over-year, according to the November ADP® National Employment ReportTM produced by the ADP Research Institute® in collaboration with the Stanford Digital Economy Lab (“Stanford Lab”)This was below the consensus forecast of 200,000. The BLS report will be released Friday, and the consensus is for 200 thousand non-farm payroll jobs added in November.
The jobs report and pay insights use ADP’s fine-grained anonymized and aggregated payroll data of over 25 million U.S. employees to provide a representative picture of the labor market. The report details the current month’s total private employment change, and weekly job data from the previous month. ADP’s pay measure uniquely captures the earnings of a cohort of almost 10 million employees over a 12-month period.
“Turning points can be hard to capture in the labor market, but our data suggest that Federal Reserve tightening is having an impact on job creation and pay gains,” said Nela Richardson, chief economist, ADP. “In addition, companies are no longer in hyper-replacement mode. Fewer people are quitting and the post-pandemic recovery is stabilizing.”
emphasis added
MBA: Mortgage Applications Decrease in Latest Weekly Survey
by Calculated Risk on 11/30/2022 07:00:00 AM
From the MBA: Mortgage Applications Decrease in Latest MBA Weekly Survey
Mortgage applications decreased 0.8 percent from one week earlier, according to data from the Mortgage Bankers Association’s (MBA) Weekly Mortgage Applications Survey for the week ending November 25, 2022. This week’s results include an adjustment for the observance of the Thanksgiving holiday.
... The Refinance Index decreased 13 percent from the previous week and was 86 percent lower than the same week one year ago. The seasonally adjusted Purchase Index increased 4 percent from one week earlier. The unadjusted Purchase Index decreased 31 percent compared with the previous week and was 41 percent lower than the same week one year ago.
“Mortgage rates declined again last week, following bond yields lower. The 30-year fixed mortgage rate decreased to 6.49 percent and has now fallen 57 basis points over the past four weeks. Additionally, mortgage rates for most other loan types declined,” said Joel Kan, MBA’s Vice President and Deputy Chief Economist. “The economy here and abroad is weakening, which should lead to slower inflation and allow the Fed to slow the pace of rate hikes. Purchase activity increased slightly after adjusting for the Thanksgiving holiday, but the decline in rates was still not enough to bring back refinance activity. Refinance applications fell another 13 percent, and the refinance share of applications was at 26 percent. Both measures were at their lowest levels since 2000.”
...
The average contract interest rate for 30-year fixed-rate mortgages with conforming loan balances ($647,200 or less) decreased to 6.49 percent from 6.67 percent, with points remaining at 0.68 (including the origination fee) for 80 percent loan-to-value ratio (LTV) loans.
emphasis added
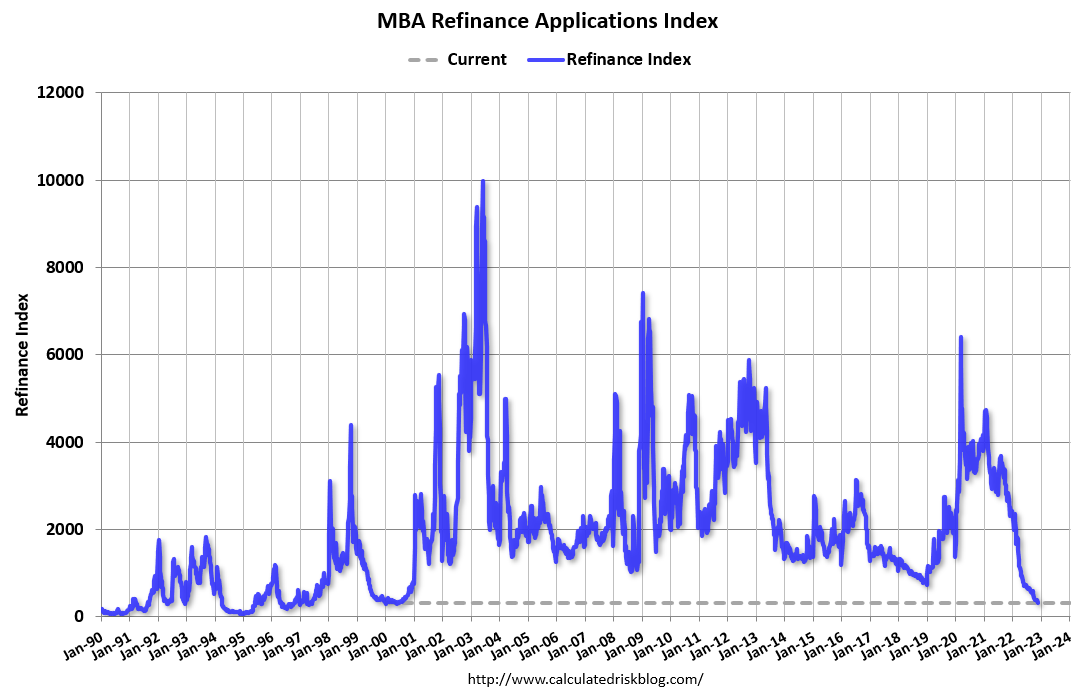 Click on graph for larger image.
The first graph shows the refinance index since 1990.
With higher mortgage rates, the refinance index has declined sharply this year.
The refinance index is at the lowest level since the year 2000.
The second graph shows the MBA mortgage purchase index
 According to the MBA, purchase activity is down 41% year-over-year unadjusted.
The purchase index is just below the pandemic low and up slightly from the lowest level since 2015.
Note: Red is a four-week average (blue is weekly).
Note: Red is a four-week average (blue is weekly).
Tuesday, November 29, 2022
Wednesday: GDP, ADP Employment, Job Openings, Pending Home Sales, Fed Chair Powell and More
by Calculated Risk on 11/29/2022 09:23:00 PM
 Note: Mortgage rates are from MortgageNewsDaily.com and are for top tier scenarios.
Wednesday:
• At 7:00 AM ET, The Mortgage Bankers Association (MBA) will release the results for the mortgage purchase applications index.
• At 8:15 AM: The ADP Employment Report for November. This report is for private payrolls only (no government). The consensus is for 200,000 jobs added, down from 239,000 in October.
• At 8:30 AM: Gross Domestic Product (Second Estimate) and Corporate Profits (Preliminary), 3rd Quarter 2022. The consensus is that real GDP increased 2.7% annualized in Q3, up from the advance estimate of 2.6% in Q3.
• At 9:45 AM: Chicago Purchasing Managers Index for November.
• At 10:00 AM ET: Job Openings and Labor Turnover Survey for October from the BLS.
• At 10:00 AM: Pending Home Sales Index for October. The consensus is for a 5.0% decrease in the index.
• At 10:30 AM: (likely) FDIC Quarterly Banking Profile, Third quarter.
• At 1:30 PM: Speech, Fed Chair Jerome Powell, Economic Outlook, Inflation, and the Labor Market, At the Brookings Institution, 1775 Massachusetts Avenue N.W., Washington, D.C.
• At 2:00 PM: the Federal Reserve Beige Book, an informal review by the Federal Reserve Banks of current economic conditions in their Districts.
Las Vegas October 2022: Visitor Traffic Down Just 0.8% Compared to 2019; Convention Traffic UP
by Calculated Risk on 11/29/2022 06:34:00 PM
Note: I like using Las Vegas as a measure of recovery for both leisure (visitors) and business (conventions).
From the Las Vegas Visitor Authority: October 2022 Las Vegas Visitor Statistics
With an improving conventions segment combined with several events including the dual weekend When We Were Young music festival, two Raiders home games and the NASCAR South Point 400 race, the month saw the destination host over 3.6M visitors, nearly matching the tally of October 2019.
Reaching the highest level since November 2019, overall hotel occupancy reached 87.7% (+6.1 pts YoY and down ‐2.3 pts vs. October 2019). Weekend occupancy reached 94.0%, a level not seen since the 94.8% figure of February 2020, the month immediately preceding the COVID shutdown, while Midweek occupancy reached 85.1%, the highest figure since October 2019's 87.1% tally.
Strong demand during the month supported by major events and conventions shattered the monthly record for ADR as avg. daily room rates approached $210, +20.8% YoY and +55.1% ahead of October 2019 while RevPAR surpassed $184 for the month, +29.9% YoY and +51.1% over October 2019
 Click on graph for larger image.
 The first graph shows visitor traffic for 2019 (dark blue), 2020 (light blue), 2021 (yellow) and 2022 (red)
Visitor traffic was down 0.8% compared to the same month in 2019.
Visitor traffic was up 7.3% compared to last October.
The second graph shows convention traffic.

Convention traffic was UP 19.6% compared to October 2019.The second graph shows convention traffic.
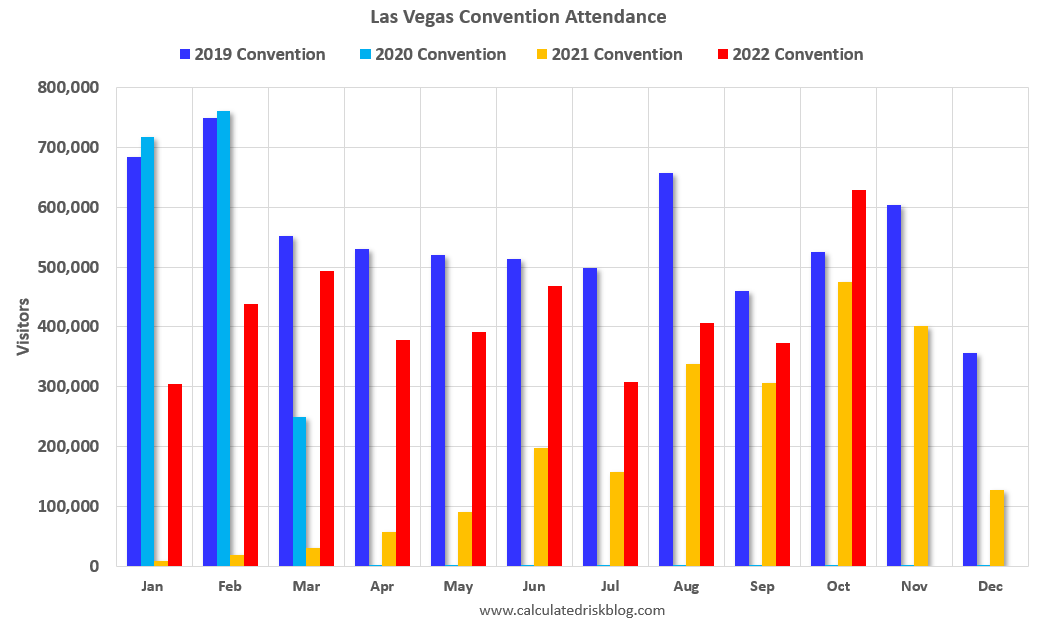
Note: There was almost no convention traffic from April 2020 through May 2021.
FHFA Announces Baseline Conforming Loan Limit Will Increase to $726,200
by Calculated Risk on 11/29/2022 01:12:00 PM
High-Cost Areas increase to $1,089,300.
Here is the official announcement from the FHFA: FHFA Announces Conforming Loan Limit Values for 2023
The Federal Housing Finance Agency (FHFA) today announced the conforming loan limit values (CLLs) for mortgages to be acquired by Fannie Mae and Freddie Mac (the Enterprises) in 2023. In most of the United States, the 2023 CLL value for one-unit properties will be $726,200, an increase of $79,000 from $647,200 in 2022.
...
The new ceiling loan limit for one-unit properties will be $1,089,300, which is 150 percent of $726,200.
Comments on September Case-Shiller and FHFA House Prices
by Calculated Risk on 11/29/2022 09:51:00 AM
Today, in the Calculated Risk Real Estate Newsletter: Case-Shiller: National House Price Index "Continued to Decline" to 10.6% year-over-year increase in September
Excerpt:
Both the Case-Shiller House Price Index (HPI) and the Federal Housing Finance Agency (FHFA) HPI for September were released today. Here is a graph of the month-over-month (MoM) change in the Case-Shiller National Index Seasonally Adjusted (SA).
The Case-Shiller Home Price Indices for “September” is a 3-month average of July, August and September closing prices. July closing prices include some contracts signed in May, so there is a significant lag to this data.
The MoM decrease in Case-Shiller was at -0.76% seasonally adjusted. This was the third consecutive MoM decrease, and slightly less than the decrease last month. This suggests prices fell sharply for September closings.
On a seasonally adjusted basis, prices declined in all of the Case-Shiller cities on a month-to-month basis. The largest monthly declines seasonally adjusted were in San Francisco (-2.2%), Phoenix (-2.1%) and Las Vegas (-2.1%). San Francisco has fallen 10.3% from the peak in May 2022.
...
The September Case-Shiller report is mostly for contracts signed in the May through August period when 30-year mortgage rates were in the low-to-mid 5% range. The October report will mostly be for contracts signed in the June through September period - when rates were mostly in the low-to-mid 5% range (except September).
The impact from higher rates in September and October will not show up significantly for a few more months.

There is much more in the article. You can subscribe at https://calculatedrisk.substack.com/


