 RSS Feed
 by Calculated Risk on 11/13/2022 08:13:00 PM
Sunday, November 13, 2022
Sunday Night Futures
Weekend:
• Schedule for Week of November 13, 2022
Monday:
• No major economic releases scheduled.
From CNBC: Pre-Market Data and Bloomberg futures S&P 500 are down 11 and DOW futures are down 70 (fair value).
Oil prices were down over the last week with WTI futures at $88.96 per barrel and Brent at $5.99 per barrel. A year ago, WTI was at $81, and Brent was at $83 - so WTI oil prices are up 10% year-over-year.
Here is a graph from Gasbuddy.com for nationwide gasoline prices. Nationally prices are at $3.78 per gallon. A year ago, prices were at $3.40 per gallon, so gasoline prices are up $0.38 per gallon year-over-year.
Heavy Truck Sales Up 13% Year-over-year
by Calculated Risk on 11/13/2022 11:01:00 AM
The BEA released their estimate of vehicle sales for October earlier.
This graph shows heavy truck sales since 1967 using data from the BEA. The dashed line is the October 2022 seasonally adjusted annual sales rate (SAAR).
Heavy truck sales really collapsed during the great recession, falling to a low of 180 thousand SAAR in May 2009. Then heavy truck sales increased to a new all-time high of 570 thousand SAAR in April 2019.
 Click on graph for larger image.
Note: "Heavy trucks - trucks more than 14,000 pounds gross vehicle weight."
Heavy truck sales declined sharply at the beginning of the pandemic, falling to a low of 308 thousand SAAR in May 2020.
Heavy truck sales were at 499 thousand SAAR in October, up from 475 thousand in September, and up from 438 thousand SAAR in October 2021.
Usually, heavy truck sales decline sharply prior to a recession. Sales were solid in October.
Saturday, November 12, 2022
Real Estate Newsletter Articles this Week: Current State of the Housing Market; Overview for mid-November
by Calculated Risk on 11/12/2022 02:11:00 PM
At the Calculated Risk Real Estate Newsletter this week:
• Current State of the Housing Market; Overview for mid-November
• Housing and Inflation
• Homebuilder Comments in October: "As negative as I've seen"
• New Home Cancellations increased Sharply in Q3
• https://calculatedrisk.substack.com/p/new-home-cancellations-increased-5b3
• Black Knight Mortgage Monitor: Home Prices Declined in September; Down 2.6% since June
This is usually published 4 to 6 times a week and provides more in-depth analysis of the housing market.
You can subscribe at https://calculatedrisk.substack.com/
Most content is available for free (and no Ads), but please subscribe!
Schedule for Week of November 13, 2022
by Calculated Risk on 11/12/2022 08:11:00 AM
The key economic reports this week are October Retail Sales, Housing Starts and Existing Home sales.
For manufacturing, October industrial production, and the November New York, Philly and Kansas City Fed surveys, will be released this week.
No major economic releases scheduled.
8:30 AM: The Producer Price Index for October from the BLS. The consensus is for a 0.5% increase in PPI, and a 0.4% increase in core PPI.
8:30 AM: The New York Fed Empire State manufacturing survey for November. The consensus is for a reading of -7.0, up from -9.1.
11:00 AM: NY Fed: Q3 Quarterly Report on Household Debt and Credit
7:00 AM ET: The Mortgage Bankers Association (MBA) will release the results for the mortgage purchase applications index.
 8:30 AM ET: Retail sales for October will be released.
The consensus is for a 0.9% increase in retail sales.
This graph shows retail sales since 1992. This is monthly retail sales and food service, seasonally adjusted (total and ex-gasoline).
 9:15 AM: The Fed will release Industrial Production and Capacity Utilization for October.
This graph shows industrial production since 1967.
The consensus is for a 0.2% increase in Industrial Production, and for Capacity Utilization to increase to 80.4%.
10:00 AM: The November NAHB homebuilder survey. The consensus is for a reading of 36, down from 38. Any number below 50 indicates that more builders view sales conditions as poor than good.
During the day: The AIA's Architecture Billings Index for October (a leading indicator for commercial real estate).
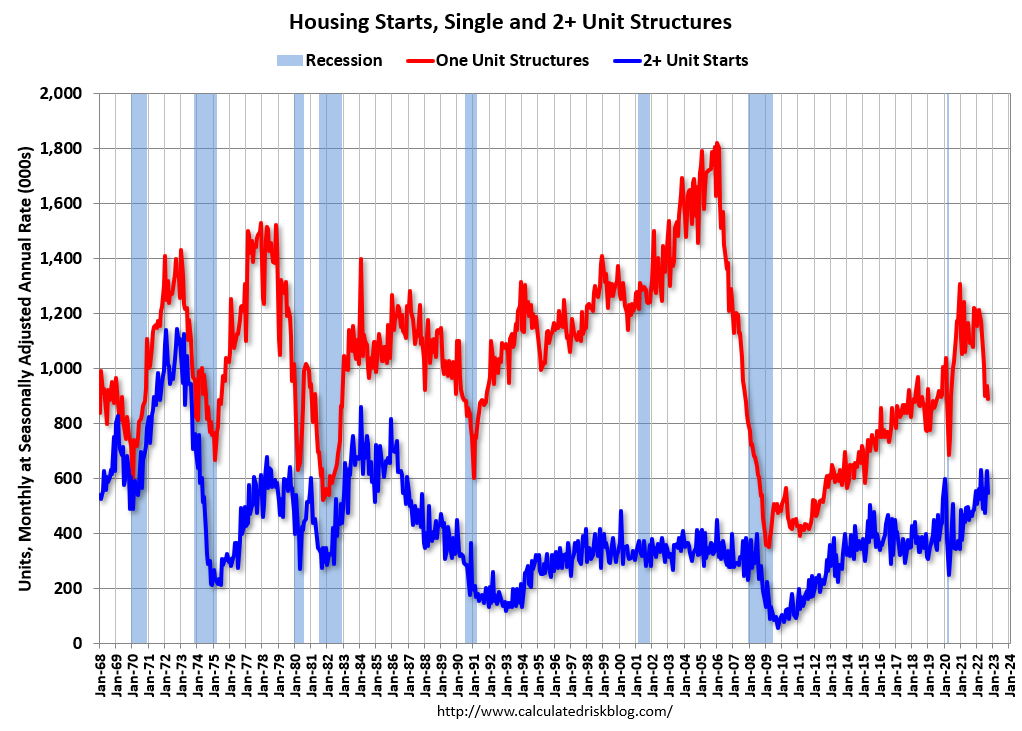 8:30 AM: Housing Starts for October.
 This graph shows single and total housing starts since 1968.
The consensus is for 1.410 million SAAR, down from 1.439 million SAAR.
8:30 AM: The initial weekly unemployment claims report will be released. The consensus is for 230 thousand initial claims, up from 225 thousand last week.
8:30 AM: the Philly Fed manufacturing survey for November. The consensus is for a reading of -8.0, up from -8.7.
11:00 AM: the Kansas City Fed manufacturing survey for November.
 10:00 AM: Existing Home Sales for October from the National Association of Realtors (NAR). The consensus is for 4.39 million SAAR, down from 4.71 million in September.
The graph shows existing home sales from 1994 through the report last month.
10:00 AM: State Employment and Unemployment (Monthly) for October 2022
Friday, November 11, 2022
COVID Nov 11, 2022: Update on Cases, Hospitalizations and Deaths
by Calculated Risk on 11/11/2022 06:14:00 PM
NOTE: COVID stats are updated on Fridays.
On COVID (focus on hospitalizations and deaths). Data has switched to weekly.
Weekly deaths bottomed in July 2021 at 1,666.
| COVID Metrics | ||||
|---|---|---|---|---|
| Now | Week Ago | Goal | ||
| New Cases per Week2🚩 | 288,989 | 273,021 | ≤35,0001 | |
| Hospitalized2 | 21,259 | 21,299 | ≤3,0001 | |
| Deaths per Week2 | 2,344 | 2,489 | ≤3501 | |
| 1my goals to stop weekly posts, 2Weekly for Cases, Currently Hospitalized, and Deaths 🚩 Increasing number weekly for Cases, Hospitalized, and Deaths ✅ Goal met. | ||||
 Click on graph for larger image.
This graph shows the weekly (columns) number of deaths reported.
Early Q4 GDP Tracking
by Calculated Risk on 11/11/2022 02:09:00 PM
It is early in Q4 ... we will have more estimates next week.
From BofA:
[Forecast 1.0% in Q4] Overall, the data since our last weekly publication pushed down our 3Q GDP tracking estimate from 3.1% q/q saar (seasonally adjusted annual rate) to 3.0% q/q saar. Looking ahead to next week, there are a number of data releases that could affect 3Q tracking, including retail sales on Wednesday, which will also kick-off our 4Q tracking. [Nov 11th estimate]And from the Altanta Fed: GDPNow
emphasis added
The GDPNow model estimate for real GDP growth (seasonally adjusted annual rate) in the fourth quarter of 2022 is 4.0 percent on November 9, up from 3.6 percent on November 3. [Nov 9th estimate]
Current State of the Housing Market; Overview for mid-November
by Calculated Risk on 11/11/2022 09:46:00 AM
Today, in the Calculated Risk Real Estate Newsletter: Current State of the Housing Market; Overview for mid-November
A brief excerpt:
Over the last month …There is much more in the article. You can subscribe at https://calculatedrisk.substack.com/
1. New listings have declined further year-over-year.
2.Mortgage rates had increased further but declined this week.
3. House prices are declining month-over-month (MoM) as measured by the repeat sales indexes.
...
The next graph shows the month-over-month (MoM) decrease in the seasonally adjusted Case-Shiller index. The MoM decrease in Case-Shiller was at -0.86% seasonally adjusted. This was the second consecutive MoM decrease, and the largest MoM since February 2010. Since this includes closings in June and July, this suggests prices fell sharply for August closings.
...
Next Friday, the NAR will release existing home sales for October. This report will likely show another sharp year-over-year decline in sales for October.

Hotels: Occupancy Rate Down 9.2% Compared to Same Week in 2019
by Calculated Risk on 11/11/2022 08:29:00 AM
As expected due to the Halloween calendar shift, U.S. hotel performance came in lower than the previous week and showed weakened comparisons to 2019, according to STR‘s latest data through Nov. 5.The following graph shows the seasonal pattern for the hotel occupancy rate using the four-week average.
Oct. 30 through Nov. 5, 2022 (percentage change from comparable week in 2019*):
• Occupancy: 62.4% (-9.2%)
• Average daily rate (ADR): $147.48 (+11.4%)
• Revenue per available room (RevPAR): $91.99 (+1.1%)
While none of the Top 25 Markets showed an occupancy increase over 2019, Tampa came closest to its pre-pandemic comparable (-1.0% to 72.4%). ...
*Due to the pandemic impact, STR is measuring recovery against comparable time periods from 2019.
emphasis added
 Click on graph for larger image.
The red line is for 2022, black is 2020, blue is the median, and dashed light blue is for 2021. Dashed purple is 2019 (STR is comparing to a strong year for hotels).
The 4-week average of the occupancy rate is above the median rate for the previous 20 years (Blue).
Note: Y-axis doesn't start at zero to better show the seasonal change.
The 4-week average of the occupancy rate will decline into the Winter.
Thursday, November 10, 2022
Realtor.com Reports Weekly Active Inventory Up 42% Year-over-year; New Listings Down 20%
by Calculated Risk on 11/10/2022 04:27:00 PM
Realtor.com has monthly and weekly data on the existing home market. Here is their weekly report released today from Chief Economist Danielle Hale: Weekly Housing Trends View — Data Week Ending Nov 5, 2022. Note: They have data on list prices, new listings and more, but this focus is on inventory.
• Active inventory continued to grow, increasing 42% above one year ago. Inventory accelerated by a more modest amount this week, but it was still the fourth consecutive week of roughly 2+% inventory gains after a fair amount of stability since July. Inventory growth even in the face of fewer newly listed homes indicates how many buyers have retreated from the housing market rather than navigate higher costs stemming from higher purchase prices and higher mortgage rates.
...
• New listings–a measure of sellers putting homes up for sale–were again down, dropping 20% from one year ago. This marks the eighteenth week of year over year declines in homeowners listing their home for sale, a sign that homeowners are well aware of the market’s reset. This data suggests that many potential sellers may be joining buyers in “wait-and-see” mode.
 Here is a graph of the year-over-year change in inventory according to realtor.com.
 Note the rapid increase in the YoY change earlier this year, from down 30% at the beginning of the year, to up 29% YoY at the beginning of July.
Then the Realtor.com data was stuck at up around 26% to 30% YoY for 14 weeks in a row. This was due to the slowdown in new listings, even as sales had fallen sharply.
Now YoY inventory is increasing again with even higher mortgage rates, suggesting sales are off more than new listings.
Housing and Inflation
by Calculated Risk on 11/10/2022 02:02:00 PM
Today, in the Calculated Risk Real Estate Newsletter: Housing and Inflation
A brief excerpt:
A few key points:There is much more in the article. You can subscribe at https://calculatedrisk.substack.com/
• The Fed has been raising rates to slow inflation. Since housing is a key transmission mechanism for Fed policy, the housing market has slowed dramatically as the Fed raised rates (and mortgage rates increased).
• The CPI report this morning contained some good news on inflation.
• The BLS reported “The index for shelter contributed over half of the monthly all items increase”.
• The BLS measure for shelter is seriously lagged and is likely behind the curve on the sharp slowdown in rents.
...
Both CPI and core CPI were below expectations, and the year-over-year change is declining. Bond yields fell sharply this morning, and the 30-year mortgage rate dropped significantly to 6.67% from 7.25% yesterday (average top tier scenarios with zero points).
...
My current view is inflation will ease quicker than the Fed currently expects.


