 RSS Feed
 by Calculated Risk on 7/20/2022 07:00:00 AM
Wednesday, July 20, 2022
MBA: Mortgage Applications Decrease in Latest Weekly Survey
From the MBA: Mortgage Applications Decrease in Latest MBA Weekly Survey
Mortgage applications decreased 6.3 percent from one week earlier, according to data from the Mortgage Bankers Association’s (MBA) Weekly Mortgage Applications Survey for the week ending July 15, 2022.
... The Refinance Index decreased 4 percent from the previous week and was 80 percent lower than the same week one year ago. The seasonally adjusted Purchase Index decreased 7 percent from one week earlier. The unadjusted Purchase Index increased 16 percent compared with the previous week and was 19 percent lower than the same week one year ago.
“Mortgage applications declined for the third week in a row, reaching the lowest level since 2000. Similarly, with most mortgage rates more than two percentage points higher than a year ago, demand for refinances continues to plummet, with MBA’s refinance index also falling to a 22-year low,” said Joel Kan, MBA’s Associate Vice President of Economic and Industry Forecasting. “Purchase activity declined for both conventional and government loans, as the weakening economic outlook, high inflation, and persistent affordability challenges are impacting buyer demand. The decline in recent purchase applications aligns with slower homebuilding activity due to reduced buyer traffic and ongoing building material shortages and higher costs.”
...
The average contract interest rate for 30-year fixed-rate mortgages with conforming loan balances ($647,200 or less) increased to 5.82 percent from 5.74 percent, with points increasing to 0.65 from 0.59 (including the origination fee) for 80 percent loan-to-value ratio (LTV) loans.
emphasis added
 Click on graph for larger image.
The first graph shows the refinance index since 1990.
With higher mortgage rates, the refinance index has declined sharply over the last several months.
The refinance index is at the lowest level since the year 2000.
The second graph shows the MBA mortgage purchase index
 According to the MBA, purchase activity is down 19% year-over-year unadjusted.
The purchase index is now only 14% above the pandemic low.
Note: Red is a four-week average (blue is weekly).
Note: Red is a four-week average (blue is weekly).
Tuesday, July 19, 2022
Wednesday: Existing Home Sales
by Calculated Risk on 7/19/2022 11:33:00 PM
Wednesday:
• At 7:00 AM ET, The Mortgage Bankers Association (MBA) will release the results for the mortgage purchase applications index.
• At 10:00 AM, Existing Home Sales for June from the National Association of Realtors (NAR). The consensus is for 5.40 million SAAR, down from 5.41 million last month. Housing economist Tom Lawler expects the NAR to report sales of 5.12 million SAAR for June.
• During the day: The AIA's Architecture Billings Index for June (a leading indicator for commercial real estate).
On COVID (focus on hospitalizations and deaths):
Hospitalizations have almost quadrupled from the lows in April 2022.
 Click on graph for larger image.
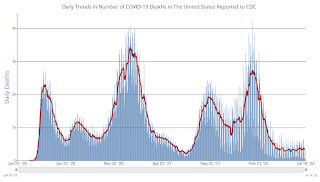
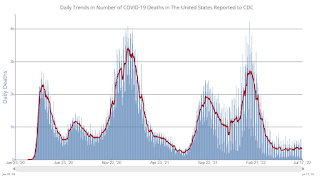
This graph shows the daily (columns) and 7-day average (line) of deaths reported.
| COVID Metrics | ||||
|---|---|---|---|---|
| Now | Week Ago | Goal | ||
| New Cases per Day2🚩 | 123,639 | 121,347 | ≤5,0001 | |
| Hospitalized2🚩 | 34,061 | 31,685 | ≤3,0001 | |
| Deaths per Day2🚩 | 352 | 343 | ≤501 | |
| 1my goals to stop daily posts, 27-day average for Cases, Currently Hospitalized, and Deaths 🚩 Increasing 7-day average week-over-week for Cases, Hospitalized, and Deaths ✅ Goal met. | ||||
 Click on graph for larger image.
This graph shows the daily (columns) and 7-day average (line) of deaths reported.
Average daily deaths bottomed in July 2021 at 214 per day.
Slowdown in Showings Suggests Further Declines in Existing Home Sales in Coming Months
by Calculated Risk on 7/19/2022 02:56:00 PM
Today, in the Calculated Risk Real Estate Newsletter: Slowdown in Showings Suggests Further Declines in Existing Home Sales in Coming Months
A brief excerpt:
The following data is courtesy of David Arbit, Director of Research at the Minneapolis Area REALTORS® and NorthstarMLS (posted with permission). Here is a link to their data.There is much more in the article. You can subscribe at https://calculatedrisk.substack.com/
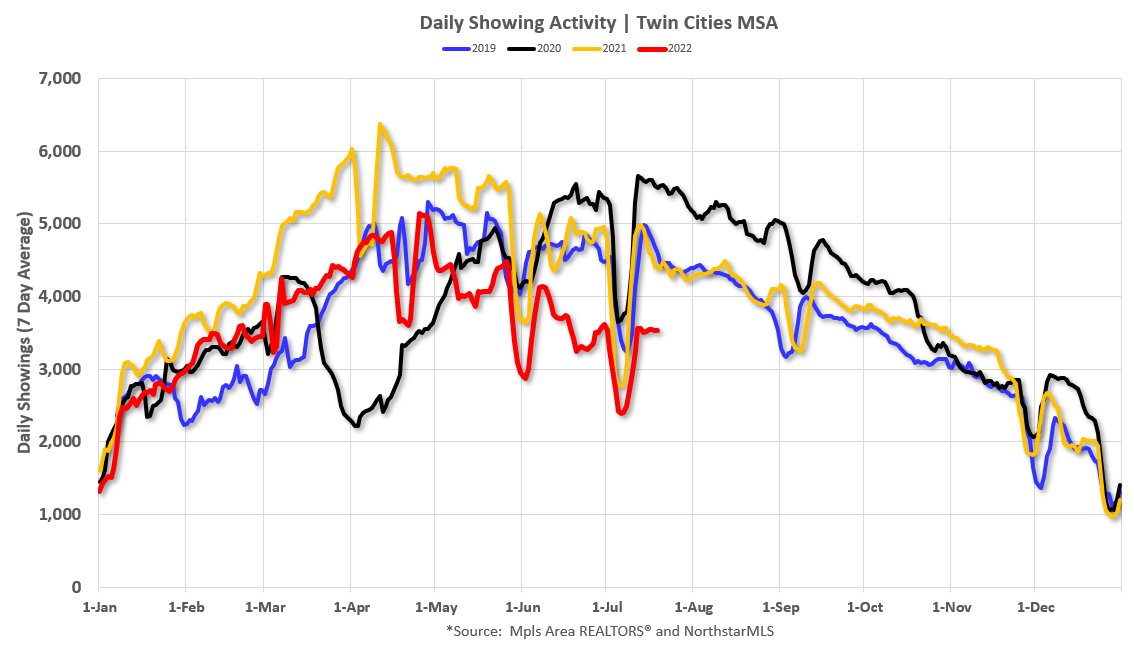
This graph shows the 7-day average showings for the Twin Cities area for 2019, 2020, 2021, and 2022. The 7-day average showings (red) are currently off 23% from 2019.
Click on graph for larger image.
This slowdown in showings started in May and accelerated in June. The existing home sales for June will be released tomorrow, and that is for closings in June. Closings in June were mostly for contracts signed in April and May. This slowdown in showings suggests further declines in closed sales over the next few months.
There was a huge dip in showings in 2020 (black) at the start of the pandemic, and then showing were well above 2019 (blue) levels for the rest of the year. And showings in 2021 (gold) were very strong in the first half of the year, and then were closer to 2019 in the 2nd half.
Note that there were dips in showings during holidays (July 4th, Memorial Day, Thanksgiving and Christmas), and also dips related to protests and curfews related to the deaths of George Floyd and Daunte Wright.
2022 (red) started off solid but is now well below the previous three years.
June Housing Starts: All-Time Record Housing Units Under Construction
by Calculated Risk on 7/19/2022 09:17:00 AM
Today, in the CalculatedRisk Real Estate Newsletter: June Housing Starts: All-Time Record Housing Units Under Construction
Excerpt:
The fourth graph shows housing starts under construction, Seasonally Adjusted (SA).There is much more in the post. You can subscribe at https://calculatedrisk.substack.com/ (Most content is available for free, so please subscribe).
Red is single family units. Currently there are 824 thousand single family units under construction (SA). This is just below the previous two months, and otherwise is the highest level since November 2006. Single family units under construction might have peaked since single family starts are now declining. The reason there are so many homes under construction is probably due to supply constraints.
Blue is for 2+ units. Currently there are 856 thousand multi-family units under construction. This is the highest level since March 1974! For multi-family, construction delays are probably also a factor. The completion of these units should help with rent pressure.
Combined, there are a record 1.680 million units under construction. This is above the previous record of 1.628 million units that were under construction in 1973 (mostly apartments in 1973 for the baby boom generation).

Housing Starts Decreased to 1.559 million Annual Rate in June
by Calculated Risk on 7/19/2022 08:38:00 AM
From the Census Bureau: Permits, Starts and Completions
Housing Starts:
Privately‐owned housing starts in June were at a seasonally adjusted annual rate of 1,559,000. This is 2.0 percent below the revised May estimate of 1,591,000 and is 6.3 percent below the June 2021 rate of 1,664,000. Single‐family housing starts in June were at a rate of 982,000; this is 8.1 percent below the revised May figure of 1,068,000. The June rate for units in buildings with five units or more was 568,000.
Building Permits:
Privately‐owned housing units authorized by building permits in June were at a seasonally adjusted annual rate of 1,685,000. This is 0.6 percent below the revised May rate of 1,695,000, but is 1.4 percent above the June 2021 rate of 1,661,000. Single‐family authorizations in June were at a rate of 967,000; this is 8.0 percent below the revised May figure of 1,051,000. Authorizations of units in buildings with five units or more were at a rate of 666,000 in June.
emphasis added
 Click on graph for larger image.
The first graph shows single and multi-family housing starts for the last several years.
Multi-family starts (blue, 2+ units) increased in June compared to May. Multi-family starts were up 15.6% year-over-year in June.
Single-family starts (red) decreased in June and were down 15.7% year-over-year.
 The second graph shows single and multi-family housing starts since 1968.
 This shows the huge collapse following the housing bubble, and then the eventual recovery.
Total housing starts in June were slightly above expectations, and starts in April and May, were revised up, combined.
I'll have more later …
Monday, July 18, 2022
Tuesday: Housing Starts
by Calculated Risk on 7/18/2022 09:18:00 PM
 Tuesday:
• At 8:30 AM ET, Housing Starts for June. The consensus is for 1.586 million SAAR, up from 1.549 million SAAR in May.
On COVID (focus on hospitalizations and deaths):
Hospitalizations have almost quadrupled from the lows in April 2022.
 Click on graph for larger image.
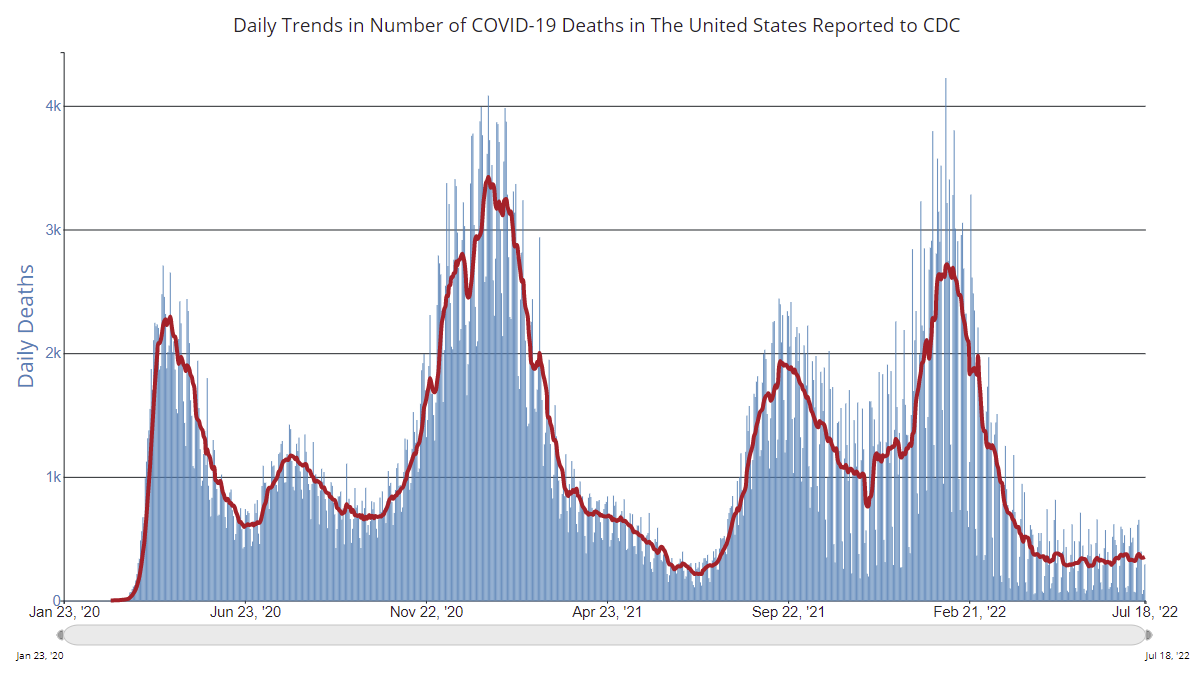
This graph shows the daily (columns) and 7-day average (line) of deaths reported.
| COVID Metrics | ||||
|---|---|---|---|---|
| Now | Week Ago | Goal | ||
| New Cases per Day2🚩 | 122,639 | 110,404 | ≤5,0001 | |
| Hospitalized2🚩 | 31,463 | 31,169 | ≤3,0001 | |
| Deaths per Day2🚩 | 336 | 320 | ≤501 | |
| 1my goals to stop daily posts, 27-day average for Cases, Currently Hospitalized, and Deaths 🚩 Increasing 7-day average week-over-week for Cases, Hospitalized, and Deaths ✅ Goal met. | ||||
 Click on graph for larger image.
This graph shows the daily (columns) and 7-day average (line) of deaths reported.
Average daily deaths bottomed in July 2021 at 214 per day.
MBA Survey: "Share of Mortgage Loans in Forbearance Decreases Slightly to 0.81% in June"
by Calculated Risk on 7/18/2022 04:00:00 PM
Note: This is as of June 30th.
From the MBA: Share of Mortgage Loans in Forbearance Decreases Slightly to 0.81% in June
The Mortgage Bankers Association’s (MBA) monthly Loan Monitoring Survey revealed that the total number of loans now in forbearance decreased by 4 basis points from 0.85% of servicers’ portfolio volume in the prior month to 0.81% as of June 30, 2022. According to MBA’s estimate, 405,000 homeowners are in forbearance plans.
The share of Fannie Mae and Freddie Mac loans in forbearance decreased 3 basis points to 0.35%. Ginnie Mae loans in forbearance increased 1 basis point to 1.26%, and the forbearance share for portfolio loans and private-label securities (PLS) declined 18 basis points to 1.68%.
“The overall forbearance rate in June stayed relatively flat with just a 4-basis-point decline from May,” said Marina Walsh, CMB, MBA’s Vice President of Industry Analysis. “Borrowers continue to exit forbearance, but at a much slower pace than six or nine months ago. New forbearance requests are still trickling in, as permitted under the CARES Act, resulting in very little movement in the overall percentage of loans in forbearance.”
Added Walsh, “There are some early indicators of borrower stress resulting from high inflation and rising interest rates, among other factors. For example, overall servicing portfolio performance dropped by 14 basis points to 95.71% current in June, and the performance of post-forbearance workouts declined by 140 basis points to 81.34%. It is worth monitoring post-forbearance workouts for all borrowers, and particularly for borrowers with government loans, who are typically the most vulnerable to economic slowdowns.”
emphasis added
 Click on graph for larger image.
This graph shows the percent of portfolio in forbearance by investor type over time.
The share of forbearance plans is decreasing, and, at the end of June, there were about 405,000 homeowners in forbearance plans.
3rd Look at Local Housing Markets in June, Sales Down Sharply, Inventory "Surged"
by Calculated Risk on 7/18/2022 01:21:00 PM
Today, in the Calculated Risk Real Estate Newsletter: 3rd Look at Local Housing Markets in June, Sales Down Sharply, Inventory "Surged"
A brief excerpt:
California doesn’t report monthly inventory numbers, but they do report the year-over-year change. Here is the press release from the California Association of Realtors® (C.A.R.): California home sales and price curb in June as housing demand cools, C.A.R. reportsThere is much more in the article. You can subscribe at https://calculatedrisk.substack.com/Closed escrow sales of existing, single-family detached homes in California totaled a seasonally adjusted annualized rate of 344,970 in June, according to information collected by C.A.R. from more than 90 local REALTOR® associations and MLSs statewide. The statewide annualized sales figure represents what would be the total number of homes sold during 2022 if sales maintained the June pace throughout the year. It is adjusted to account for seasonal factors that typically influence home sales. June’s sales pace was down 8.4 percent on a monthly basis from 376,560 in May and down 20.9 percent from a year ago, when 436,020 homes were sold on an annualized basis.
California’s median home price declined 4.0 percent in June to $863,790 from the revised record-high of $900,170 recorded in May. The June price was 5.4 percent higher than the $819,630 recorded last June. The moderation in the median home price was due partly to a change in the mix of sales in June, as the high-end market started pulling back.
With both closed sales and pending sales slowing by more than 20 percent, total active listings surged 64.4 percent in June, the largest year-over-year growth in more than seven years. Active listings in June also climbed to the highest level since November 2019, with a month-to-month increase of 28.8 percent from May.... Housing economist Tom Lawler expects the NAR to report sales at a seasonally adjusted annual rate of 5.12 million in June. The consensus is for 5.40 million.
Contracts for sales in June were mostly signed in April and May, when mortgage rates were lower than in June, so we will probably see further declines in sales in July and August

NAHB: Builder Confidence "Plunges" to 55 in July
by Calculated Risk on 7/18/2022 10:07:00 AM
The National Association of Home Builders (NAHB) reported the housing market index (HMI) was at 55, down from 67 in June. Any number above 50 indicates that more builders view sales conditions as good than poor.
From the NAHB: Builder Confidence Plunges as Affordability Woes Mount
Builder confidence plunged in July as high inflation and increased interest rates stalled the housing market by dramatically slowing sales and buyer traffic. In a further sign of a weakening housing market, builder confidence in the market for newly built single-family homes posted its seventh straight monthly decline in July, falling 12 points to 55, according to the National Association of Home Builders (NAHB)/Wells Fargo Housing Market Index (HMI) released today. This marks the lowest HMI reading since May 2020 and the largest single-month drop in the history of the HMI, except for the 42-point drop in April 2020.
“Production bottlenecks, rising home building costs and high inflation are causing many builders to halt construction because the cost of land, construction and financing exceeds the market value of the home,” said NAHB Chairman Jerry Konter, a home builder and developer from Savannah, Ga. “In another sign of a softening market, 13% of builders in the HMI survey reported reducing home prices in the past month to bolster sales and/or limit cancellations.”
“Affordability is the greatest challenge facing the housing market,” said NAHB Chief Economist Robert Dietz. “Significant segments of the home buying population are priced out of the market. Policymakers must address supply-side issues to help builders produce more affordable housing.”
...
All three HMI components posted declines in July: Current sales conditions dropped 12 points to 64, sales expectations in the next six months declined 11 points to 50 and traffic of prospective buyers fell 11 points to 37.
Looking at the three-month moving averages for regional HMI scores, the Northeast fell six points to 65, the Midwest dropped four points to 52, the South fell eight points to 70 and the West posted a 12-point decline to 62.
emphasis added
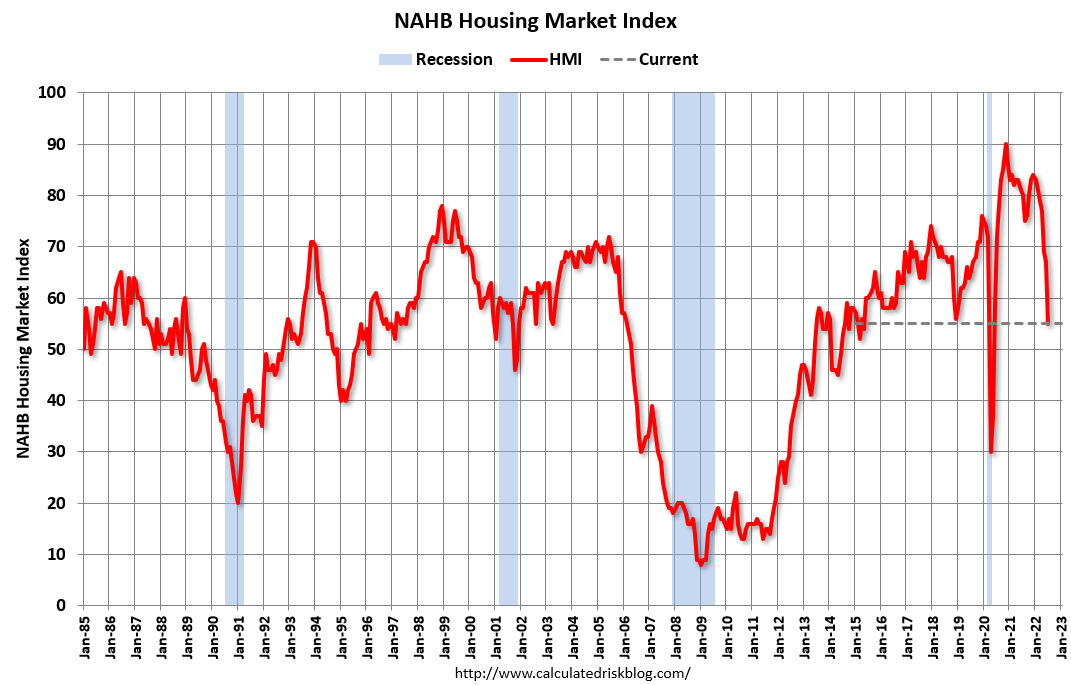 Click on graph for larger image.
This graph shows the NAHB index since Jan 1985.
This was well below the consensus forecast, but still above 50.
The "traffic of prospective buyers" is now well below breakeven at 37 (below 50).
Housing Inventory July 18th Update: Up 30% Year-over-year
by Calculated Risk on 7/18/2022 08:54:00 AM
Inventory is increasing rapidly. Inventory bottomed seasonally at the beginning of March 2022 and is now up 110% since then. More than double!
Altos reports inventory is up 30.3% year-over-year and is now 16.3% above the peak last year.
 Click on graph for larger image.
This inventory graph is courtesy of Altos Research.
 Click on graph for larger image.
This inventory graph is courtesy of Altos Research.
As of July 15th, inventory was at 509 thousand (7-day average), compared to 490 thousand the prior week.
Inventory was up 3.8% from the previous week. Inventory is increasing much faster than normal for this time of year (both in percentage terms and in total inventory added).
Inventory is still historically low. Compared to the same week in 2021, inventory is up 30.3% from 391 thousand, however compared to the same week in 2020 inventory is down 21.4% from 647 thousand. Compared to 3 years ago, inventory is down 47.6% from 970 thousand.
Here are the inventory milestones I’m watching for with the Altos data:
1. The seasonal bottom (happened on March 4th for Altos) ✅
2. Inventory up year-over-year (happened on May 13th for Altos) ✅
3. Inventory up compared to two years ago (currently down 21.4% according to Altos)
4. Inventory up compared to 2019 (currently down 47.6%).
1. The seasonal bottom (happened on March 4th for Altos) ✅
2. Inventory up year-over-year (happened on May 13th for Altos) ✅
3. Inventory up compared to two years ago (currently down 21.4% according to Altos)
4. Inventory up compared to 2019 (currently down 47.6%).

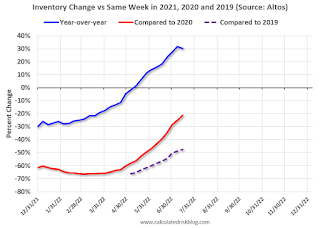
Here is a graph of the inventory change vs 2021, 2020 (milestone 3 above) and 2019 (milestone 4).
The blue line is the year-over-year data, the red line is compared to two years ago, and dashed purple is compared to 2019.
Two years ago (in 2020) inventory was declining all year, so the two-year comparison will get easier all year.
Based on the recent increases in inventory, my current estimate is inventory will be up compared to 2020 in late August of this year (next month), and back to 2019 levels at the beginning of 2023.
Mike Simonsen discusses this data regularly on Youtube.


