 RSS Feed
 by Calculated Risk on 6/06/2022 08:35:00 AM
Monday, June 06, 2022
Four High Frequency Indicators for the Economy
These indicators are mostly for travel and entertainment. It is interesting to watch these sectors recover as the pandemic subsides. Note: Apple has discontinued "Apple mobility", and restaurant traffic is mostly back to normal.
The TSA is providing daily travel numbers.
This data is as of June 5th.
 Click on graph for larger image.
This data shows the 7-day average of daily total traveler throughput from the TSA for 2019 (Light Blue), 2020 (Black), 2021 (Blue) and 2022 (Red).
The dashed line is the percent of 2019 for the seven-day average.
The 7-day average is down 12.4% from the same day in 2019 87.6% of 2019). (Dashed line)
Air travel has been moving sideways over the last three months, off about 10% from 2019.
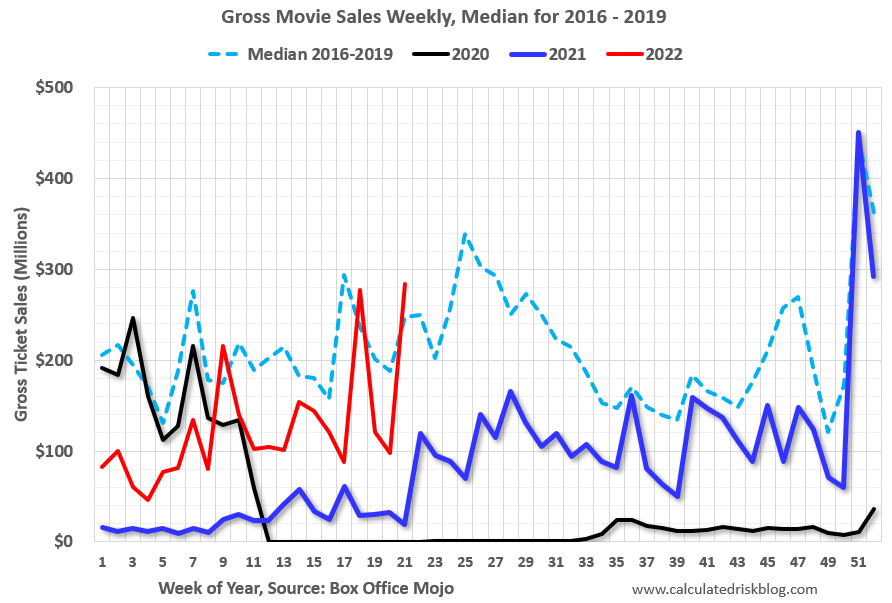 This data shows domestic box office for each week and the median for the years 2016 through 2019 (dashed light blue).
 Black is 2020, Blue is 2021 and Red is 2022.
The data is from BoxOfficeMojo through June 2nd.
Note that the data is usually noisy week-to-week and depends on when blockbusters are released.
Movie ticket sales were at $284 million last week, up about 15% from the median for the week - due primarily to the release of Top Gun.
Note that the data is usually noisy week-to-week and depends on when blockbusters are released.
Movie ticket sales were at $284 million last week, up about 15% from the median for the week - due primarily to the release of Top Gun.
 This graph shows the seasonal pattern for the hotel occupancy rate using the four-week average.
 The red line is for 2022, black is 2020, blue is the median, and dashed light blue is for 2021. Dashed purple is 2019 (STR is comparing to a strong year for hotels).
This data is through May 28th. The occupancy rate was up 3.2% compared to the same week in 2019.
The 4-week average of the occupancy rate is at the median rate for the previous 20 years (Blue).
Notes: Y-axis doesn't start at zero to better show the seasonal change.
Notes: Y-axis doesn't start at zero to better show the seasonal change.
This was the first increase in the occupancy rate compared to the same week in 2019. This was partly due to the timing of Memorial Day, and I expect the occupancy rate to be down compared to 2019 next week.
Here is some interesting data on New York subway usage (HT BR).
 This graph is from Todd W Schneider.
 This graph shows how much MTA traffic has recovered in each borough (Graph starts at first week in January 2020 and 100 = 2019 average).
Manhattan is at about 39% of normal.
This data is through Friday, June 3rd.
He notes: "Data updates weekly from the MTA’s public turnstile data, usually on Saturday mornings".
Sunday, June 05, 2022
Sunday Night Futures
by Calculated Risk on 6/05/2022 06:07:00 PM
Weekend:
• Schedule for Week of June 5, 2022
Monday:
• No major economic releases scheduled.
From CNBC: Pre-Market Data and Bloomberg futures S&P 500 DOW futures are up slightly (fair value).
Oil prices were up over the last week with WTI futures at $118.87 per barrel and Brent at $119.72 per barrel. A year ago, WTI was at $69 and Brent was at $71 - so WTI oil prices are up 70% year-over-year.
Here is a graph from Gasbuddy.com for nationwide gasoline prices. Nationally prices are at $4.86 per gallon. A year ago prices were at $3.04 per gallon, so gasoline prices are up $1.82 per gallon year-over-year.
Vehicle Sales Mix and Heavy Trucks
by Calculated Risk on 6/05/2022 12:13:00 PM
It will be interesting to see if high gasoline prices will lead to a higher percentage of passenger car sales.
This graph shows the percent of light vehicle sales between passenger cars and trucks / SUVs through May 2022.
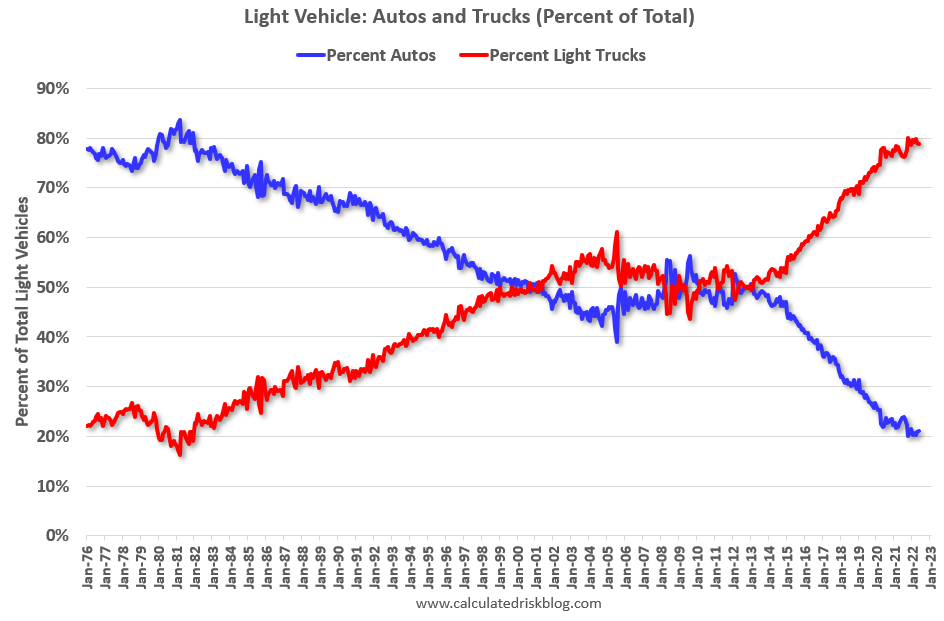 Over time the mix has changed more and more towards light trucks and SUVs.
Only when oil prices are high, does the trend slow or reverse.
The percent of light trucks and SUVs was at 78.9% in May 2022 - just below the record high percentage of 80.0% last October.
The second graph shows heavy truck sales since 1967 using data from the BEA. The dashed line is the May 2022 seasonally adjusted annual sales rate (SAAR).
 Heavy truck sales really collapsed during the great recession, falling to a low of 180 thousand SAAR in May 2009. Then heavy truck sales increased to a new all-time high of 563 thousand SAAR in September 2019.
Note: "Heavy trucks - trucks more than 14,000 pounds gross vehicle weight."
Heavy truck sales really declined at the beginning of the pandemic, falling to a low of 299 thousand SAAR in May 2020.
Heavy truck sales were at 450 thousand SAAR in May, up from 442 thousand in April, and down 10% from 501 thousand SAAR in May 2021. If there is a slump in construction, then heavy truck sales will decline.
Saturday, June 04, 2022
Real Estate Newsletter Articles this Week
by Calculated Risk on 6/04/2022 02:11:00 PM
At the Calculated Risk Real Estate Newsletter this week:
• When will House Price Growth Slow?
• Rent Increases Up Sharply Year-over-year, Pace is slowing
• Worst Housing Affordability" since 1991 excluding Bubble
• Case-Shiller National Index up 20.6% Year-over-year in March; New Record Monthly Increase
• Lawler: Large Builders Acquired Lots of Lots over the Last Year
This is usually published 4 to 6 times a week and provides more in-depth analysis of the housing market.
You can subscribe at https://calculatedrisk.substack.com/
Most content is available for free (and no Ads), but please subscribe!
Schedule for Week of June 5, 2022
by Calculated Risk on 6/04/2022 08:11:00 AM
The key report this week is CPI.
Other key reports include the April trade balance and Q1 Flow of Funds.
No major economic releases scheduled.
 8:30 AM: Trade Balance report for April from the Census Bureau.
 The consensus is the trade deficit to be $89.3 billion. The U.S. trade deficit was at $109.8 Billion in March.
7:00 AM ET: The Mortgage Bankers Association (MBA) will release the results for the mortgage purchase applications index.
8:30 AM: The initial weekly unemployment claims report will be released. The consensus is for 210 thousand up from 200 thousand last week.
12:00 PM: Q1 Flow of Funds Accounts of the United States from the Federal Reserve.
8:30 AM: The Consumer Price Index for May from the BLS. The consensus is for 0.7% increase in CPI, and a 0.5% increase in core CPI.
10:00 AM: University of Michigan's Consumer sentiment index (Preliminary for June).
Friday, June 03, 2022
COVID June 3, 2022: Hospitalizations Increasing
by Calculated Risk on 6/03/2022 09:01:00 PM
On COVID (focus on hospitalizations and deaths):
| COVID Metrics | ||||
|---|---|---|---|---|
| Now | Week Ago | Goal | ||
| Percent fully Vaccinated | 66.7% | --- | ≥70.0%1 | |
| Fully Vaccinated (millions) | 221.4 | --- | ≥2321 | |
| New Cases per Day3 | 99,289 | 110,387 | ≤5,0002 | |
| Hospitalized3🚩 | 21,765 | 20,521 | ≤3,0002 | |
| Deaths per Day3 | 246 | 325 | ≤502 | |
| 1 Minimum to achieve "herd immunity" (estimated between 70% and 85%). 2my goals to stop daily posts, 37-day average for Cases, Currently Hospitalized, and Deaths 🚩 Increasing 7-day average week-over-week for Cases, Hospitalized, and Deaths ✅ Goal met. | ||||
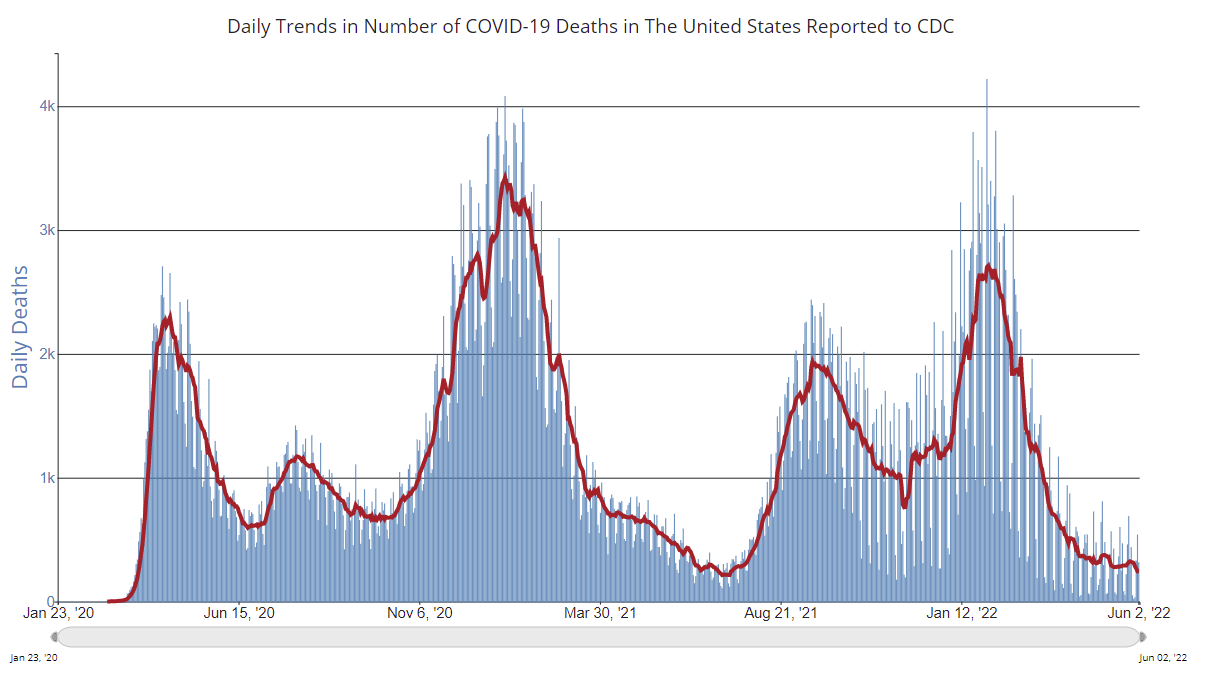 Click on graph for larger image.
This graph shows the daily (columns) and 7-day average (line) of deaths reported.
Average daily deaths bottomed in July 2021 at 214 per day.
Realtor.com Reports Weekly Inventory Up 11% Year-over-year
by Calculated Risk on 6/03/2022 03:14:00 PM
Realtor.com has monthly and weekly data on the existing home market. Here is their weekly report released this morning from Chief Economist Danielle Hale: Weekly Housing Trends View — Data Week Ending May 28, 2022. Note: They have data on list prices, new listings and more, but this focus is on inventory.
• Active inventory continued to grow, rising 11% above one year ago. In a few short weeks, we’ve observed a significant turnaround in the number of homes available for sale, going from essentially flat at the beginning of May weeks ago to +11% in this data from the last week of the month. This is helping to rebalance the housing market, but the trend must be understood in context. Our May Housing Trends Report showed that the active listings count remained nearly 50 percent below its level at the beginning of the pandemic. In other words, home shoppers continue to see a historically low number of homes for sale.
 Here is a graph of the year-over-year change in inventory according to realtor.com. Note: I corrected a sign error in the data for Feb 26, 2022.
Note the rapid increase in the YoY change, from down 30% at the beginning of the year, to up 11% YoY now. It will be important to watch if that trend continues.
The second graph is from the May Housing Trends Report referenced above.

This shows realtor.com's estimate of active inventory over the last six years.
Note that inventory was declining rapidly for most of 2020, and it is very likely that inventory will be up compared to 2020 later this year.
Q2 GDP Forecasts: Around 3.0%
by Calculated Risk on 6/03/2022 03:00:00 PM
From BofA:
We continue to track 3.0% qoq saar growth for 2Q. Weaker than expected vehicle sales were offset by better inventories and capex spending [June 3 estimate]From Goldman:
emphasis added
We boosted our Q2 GDP tracking estimate by 0.2pp to +3.0% (qoq ar). [June 1 estimate]And from the Altanta Fed: GDPNow
The GDPNow model estimate for real GDP growth (seasonally adjusted annual rate) in the second quarter of 2022 is 1.3 percent on June 1, down from 1.9 percent on May 27. [June 1 estimate]
When will House Price Growth Slow?
by Calculated Risk on 6/03/2022 12:32:00 PM
Today, in the Calculated Risk Real Estate Newsletter: When will House Price Growth Slow?
A brief excerpt:
Most analysts expect house price growth to slow sharply in coming months. For example, a few weeks ago, I wrote: What will Happen with House Prices?Some answers in the article. You can subscribe at https://calculatedrisk.substack.com/
However, the most recent Case-Shiller report showed house prices were up a record 20.6% year-over-year (YoY). This report was for March (a three-month average of January, February and March prices).
And, according to Zillow research, house prices will be up even more YoY in the April Case-Shiller National Index (to be released on June 28th. The Zillow forecast is for the YoY change for the Case-Shiller National index to be a record 20.8% in April.
...
Why are prices still up sharply year-over-year?
Comments on May Employment Report
by Calculated Risk on 6/03/2022 09:31:00 AM
The headline jobs number in the May employment report was above expectations, however employment for the previous two months was revised down by 22,000. The participation rate and the employment-population ratio both increased slightly, and the unemployment rate was unchanged at 3.6%.
Excluding leisure and hospitality, the economy has more than added back all the jobs lost at the beginning of the pandemic. Leisure and hospitality gained 84 thousand jobs in May. At the beginning of the pandemic, in March and April of 2020, leisure and hospitality lost 8.20 million jobs, and are now down 1.35 million jobs since February 2020. So, leisure and hospitality has now added back about 84% all of the jobs lost in March and April 2020.
Construction employment increased 36 thousand and is now 40 thousand above the pre-pandemic level.
Manufacturing added 18 thousand jobs and is just 17 thousand below the pre-pandemic level.
Earlier: May Employment Report: 390 thousand Jobs, 3.6% Unemployment Rate
In May, the year-over-year employment change was 6.5 million jobs.
Permanent Job Losers
 Click on graph for larger image.
This graph shows permanent job losers as a percent of the pre-recession peak in employment through the report today.
In May, the year-over-year employment change was 6.5 million jobs.
Permanent Job Losers
 Click on graph for larger image.
This graph shows permanent job losers as a percent of the pre-recession peak in employment through the report today.
This data is only available back to 1994, so there is only data for three recessions.
In May, the number of permanent job losers was unchanged at 1.386 million from 1.386 million in the previous month.
In May, the number of permanent job losers was unchanged at 1.386 million from 1.386 million in the previous month.
These jobs were likely the hardest to recover, so it is a positive that the number of permanent job losers is essentially back to pre-recession levels.
Prime (25 to 54 Years Old) Participation
 Since the overall participation rate has declined due to cyclical (recession) and demographic (aging population, younger people staying in school) reasons, here is the employment-population ratio for the key working age group: 25 to 54 years old.
The 25 to 54 participation rate increased in May to 82.6% from 82.4% in April, and the 25 to 54 employment population ratio increased to 80.0% from 79.9% the previous month.
Both are slightly below the pre-pandemic levels and indicate almost all of the prime age workers have returned to the labor force.
Part Time for Economic Reasons
 From the BLS report:
These workers are included in the alternate measure of labor underutilization (U-6) that increased to 7.1% from 7.0% in the previous month. This is down from the record high in April 22.9% for this measure since 1994. This measure is close to the 7.0% in February 2020 (pre-pandemic).
Unemployed over 26 Weeks
 This graph shows the number of workers unemployed for 27 weeks or more.
According to the BLS, there are 1.356 million workers who have been unemployed for more than 26 weeks and still want a job, down from 1.483 million the previous month.
This does not include all the people that left the labor force.
Summary:
The headline monthly jobs number was above expectations; however, the previous two months were revised down by 22,000 combined.
Part Time for Economic Reasons
 From the BLS report:
"The number of persons employed part time for economic reasons increased by 295,000 to 4.3 million in May, reflecting an increase in the number of persons whose hours were cut due to slack work or business conditions. The number of persons employed part time for economic reasons is little different from its February 2020 level. These individuals, who would have preferred full-time employment, were working part time because their hours had been reduced or they were unable to find full-time jobs."The number of persons working part time for economic reasons increased in May to 4.328 million from 4.033 million in April. This is at pre-recession levels.
These workers are included in the alternate measure of labor underutilization (U-6) that increased to 7.1% from 7.0% in the previous month. This is down from the record high in April 22.9% for this measure since 1994. This measure is close to the 7.0% in February 2020 (pre-pandemic).
Unemployed over 26 Weeks
 This graph shows the number of workers unemployed for 27 weeks or more.
 According to the BLS, there are 1.356 million workers who have been unemployed for more than 26 weeks and still want a job, down from 1.483 million the previous month.
This does not include all the people that left the labor force.
Summary:
The headline monthly jobs number was above expectations; however, the previous two months were revised down by 22,000 combined.
The headline unemployment rate was unchanged at 3.6%.
There are still 0.8 million fewer jobs than prior to the recession.
Overall, this was another strong report.


