 RSS Feed
 by Calculated Risk on 11/08/2021 12:08:00 PM
Monday, November 08, 2021
Fed Governor Bowman: The U.S. Housing and Mortgage Market: Risks and Resilience
From Fed Governor Michelle Bowman, At the Women in Housing and Finance Public Policy Luncheon, Washington, D.C., The U.S. Housing and Mortgage Market: Risks and Resilience. Bowman comments on house prices and the end of the forbearance programs. Here are here comments on house prices:
Home prices had been rising at a moderate rate since 2012, but since mid-2020, their growth has accelerated significantly. In total, home prices in September were 21 percent higher than in June 2020. Home price increases are also widespread. In September, about 90 percent of American cities had experienced rising home prices over the past three months, and the home price increases were substantial in most of these cities.
These sharp increases raise the concern that housing is overvalued and that home prices may decline. Historically, large home price increases are somewhat less concerning if they are supported by economic fundamentals rather than speculation. Fundamentals certainly seem to be a large part of the story behind the increases we've seen since the middle of last year. The demand for housing has risen for several reasons. Interest rates are low, families have accumulated savings, and income growth in the past 18 months has been quite strong. Families are also reconsidering where, and in what kind of home, they want to live. Purchases of second homes, for example, have been somewhat high in the past 18 months. Meanwhile, the supply of new homes has been held back by shortages of materials, labor, and developed lots.
Another reason to be less concerned about the recent escalation in home prices is that we do not see much of the decline in underwriting standards that fueled the home price bubble in the mid-2000s. Mortgage underwriting standards have remained conservative relative to the mid-2000s, in part because of the mortgage policy reforms that were put in place in the aftermath of the housing crisis. Investor activity is subdued relative to that time as well.
Nonetheless, home prices do decline from time to time. In inflation-adjusted terms, U.S. home prices fell from 1979 to 1982 and from 1989 to 1993, although by much less than from 2006 to 2012. Although the declines in national home prices were modest in some of these episodes, some areas of the country experienced sharp declines. As we all know, home price declines cause problems and strain throughout the economy. To give just one example, families and small business owners borrow against their homes to fund big-ticket purchases and business expansions, and house price declines make it harder to use homes as loan collateral. This effect can be amplified if a credit crunch occurs, in which lenders react to the decline in house prices by pulling back on their lending. With banks and the broader financial system currently quite robust, such a credit crunch seems unlikely. Nonetheless, I know how painful these declines can be, especially in certain markets. For example, from my experience living in rural Kansas, I understand how smaller communities with a less diversified housing and employment base can take a long time to recover from a fall in home prices. I wonder also about communities with a sizable share of second-home owners. So I will continue to watch the incoming data closely.
Falling home prices would certainly be very dramatic, but continued outsized increases could also be problematic. First, high home prices make it more difficult for low- to moderate-income households to become homeowners, as larger down payments and other financing requirements effectively lock these households out of the housing market. Second, and related to one of the Federal Reserve's monetary policy goals, rising home prices and rents raise the cost of housing. Because housing costs are a large share of living expenses for most people, these increases are adding to current inflationary pressures in the economy. Indeed, we are already seeing sizable increases in rent and owners' equivalent rent in many parts of the country.
emphasis added
Seven High Frequency Indicators for the Economy
by Calculated Risk on 11/08/2021 08:28:00 AM
These indicators are mostly for travel and entertainment. It will interesting to watch these sectors recover as the pandemic subsides.
The TSA is providing daily travel numbers.
This data is as of November 7th.
 Click on graph for larger image.
This data shows the 7-day average of daily total traveler throughput from the TSA for 2019 (Light Blue), 2020 (Blue) and 2021 (Red).
The dashed line is the percent of 2019 for the seven day average.
The 7-day average is down 20.2% from the same day in 2019 (79.8% of 2019). (Dashed line)
Overall, air travel has been off about 20% relative to 2019 for the last four months (with some ups and downs).
The second graph shows the 7-day average of the year-over-year change in diners as tabulated by OpenTable for the US and several selected cities.
IMPORTANT: OpenTable notes: "we’ve updated the data including downloadable dataset from January 1, 2021 onward to compare seated diners from 2021 to 2019, as opposed to year over year." Thanks!
 Thanks to OpenTable for providing this restaurant data:
This data is updated through November 6, 2021.
This data is "a sample of restaurants on the OpenTable network across all channels: online reservations, phone reservations, and walk-ins. For year-over-year comparisons by day, we compare to the same day of the week from the same week in the previous year."
Note that this data is for "only the restaurants that have chosen to reopen in a given market". Since some restaurants have not reopened, the actual year-over-year decline is worse than shown.
Dining picked up for the Labor Day weekend, but declined after the holiday - and appears to be declining again. The 7-day average for the US is down 14% compared to 2019.
 This data shows domestic box office for each week and the median for the years 2016 through 2019 (dashed light blue).
 Blue is 2020 and Red is 2021.
The data is from BoxOfficeMojo through November 4th.
Note that the data is usually noisy week-to-week and depends on when blockbusters are released.
Movie ticket sales were at $88 million last week, down about 50% from the median for the week.
Note that the data is usually noisy week-to-week and depends on when blockbusters are released.
Movie ticket sales were at $88 million last week, down about 50% from the median for the week.
 This graph shows the seasonal pattern for the hotel occupancy rate using the four week average.
 The red line is for 2021, black is 2020, blue is the median, dashed purple is 2019, and dashed light blue is for 2009 (the worst year on record for hotels prior to 2020).
This data is through October 30th. The occupancy rate was down 5.7% compared to the same week in 2019.
Notes: Y-axis doesn't start at zero to better show the seasonal change.
The occupancy rate will now decline seasonally into the new year.
 This graph, based on weekly data from the U.S. Energy Information Administration (EIA), shows gasoline supplied compared to the same week of 2019.
Blue is for 2020. Red is for 2021.
As of October 29th, gasoline supplied was up 3.9% compared to the same week in 2019.
This was the eighth week so far this year when gasoline supplied was up compared to the same week in 2019 - and consumption is running close to 2019 levels now.
This graph is from Apple mobility. From Apple: "This data is generated by counting the number of requests made to Apple Maps for directions in select countries/regions, sub-regions, and cities." This is just a general guide - people that regularly commute probably don't ask for directions.
There is also some great data on mobility from the Dallas Fed Mobility and Engagement Index. However the index is set "relative to its weekday-specific average over January–February", and is not seasonally adjusted, so we can't tell if an increase in mobility is due to recovery or just the normal increase in the Spring and Summer.
 This data is through November 6th
 for the United States and several selected cities.
The graph is the running 7-day average to remove the impact of weekends.
IMPORTANT: All data is relative to January 13, 2020. This data is NOT Seasonally Adjusted. People walk and drive more when the weather is nice, so I'm just using the transit data.
According to the Apple data directions requests, public transit in the 7 day average for the US is at 111% of the January 2020 level.
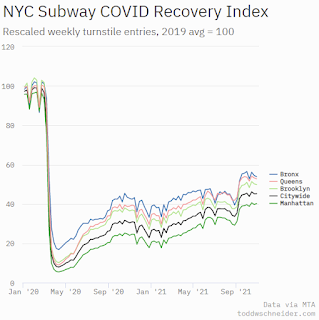
New York City is doing well by this metric, but subway usage in NYC is down sharply (next graph).
----- New York City Subway Usage -----
Here is some interesting data on New York subway usage (HT BR).
 This graph is from Todd W Schneider.
Here is some interesting data on New York subway usage (HT BR).
 This graph is from Todd W Schneider.
 This graph shows how much MTA traffic has recovered in each borough (Graph starts at first week in January 2020 and 100 = 2019 average).
This data is through Friday, November 5th.
He notes: "Data updates weekly from the MTA’s public turnstile data, usually on Saturday mornings".
This data is through Friday, November 5th.
He notes: "Data updates weekly from the MTA’s public turnstile data, usually on Saturday mornings".
Sunday, November 07, 2021
Sunday Night Futures
by Calculated Risk on 11/07/2021 06:13:00 PM
Weekend:
• Schedule for Week of November 7, 2021
Monday:
• At 12:00 PM ET, Speech, Fed Governor Michelle Bowman, The U.S. Housing Market, At the Women in Housing and Finance Public Policy Luncheon, Washington, D.C.
• At 2:00 PM, Senior Loan Officer Opinion Survey on Bank Lending Practices for October.
From CNBC: Pre-Market Data and Bloomberg futures S&P 500 and DOW futures are mostly unchanged (fair value).
Oil prices were down over the last week with WTI futures at $81.27 per barrel and Brent at $82.74 per barrel. A year ago, WTI was at $37, and Brent was at $38 - so WTI oil prices are up more than double year-over-year.
Here is a graph from Gasbuddy.com for nationwide gasoline prices. Nationally prices are at $3.40 per gallon. A year ago prices were at $2.09 per gallon, so gasoline prices are up $1.31 per gallon year-over-year.
A Zillow Flip that Flopped
by Calculated Risk on 11/07/2021 01:49:00 PM
Today, in the Real Estate Newsletter: A Zillow Flip that Flopped
Excerpt:
Here is an example flop from Zillow.You can subscribe at https://calculatedrisk.substack.com/ (Currently all content is available for free, but please subscribe).
This home is at 271 Capella Ave in La Habra California. It is list by Active Realty (that seems to be associated with Zillow). This is a single story home in a decent area (California prices are always crazy compared to most of the US).
...
So my guess is Zillow lost north of $10,000 on this one flop.

UPDATE: I left out the fee Zillow charges when they purchase the house, so their loss as not as bad as I initially thought (although I left out some expenses too).
Saturday, November 06, 2021
Real Estate Newsletter Articles this Week
by Calculated Risk on 11/06/2021 02:11:00 PM
At the Calculated Risk Real Estate Newsletter this week:
• 1st Look at Local Housing Markets in October "Extreme bidding wars are less common"
• The Market Impact of the Closure of Zillow Offers
• The Rapid Increase in Rents Continues
• 2022 Housing Forecasts: First Look Optimism on New Home Sales in 2022
This will usually be published several times a week, and will provide more in-depth analysis of the housing market.
The blog will continue as always!
You can subscribe at https://calculatedrisk.substack.com/ Currently all content is available for free - and some will always be free - but please subscribe!.
You can subscribe at https://calculatedrisk.substack.com/ Currently all content is available for free - and some will always be free - but please subscribe!.
Schedule for Week of November 7, 2021
by Calculated Risk on 11/06/2021 08:11:00 AM
The key economic report this week is October CPI.
12:00 PM: Speech, Fed Governor Michelle Bowman, The U.S. Housing Market, At the Women in Housing and Finance Public Policy Luncheon, Washington, D.C.
2:00 PM: Senior Loan Officer Opinion Survey on Bank Lending Practices for October.
6:00 AM: NFIB Small Business Optimism Index for October.
8:30 AM: The Producer Price Index for October from the BLS. The consensus is for a 0.6% increase in PPI, and a 0.5% increase in core PPI.
11:00 AM: NY Fed: Q3 Quarterly Report on Household Debt and Credit
7:00 AM ET: The Mortgage Bankers Association (MBA) will release the results for the mortgage purchase applications index.
8:30 AM: The Consumer Price Index for October from the BLS. The consensus is for a 0.6% increase in CPI, and a 0.4% increase in core CPI.
8:30 AM: The initial weekly unemployment claims report will be released. The consensus is for 260 thousand initial claims, down from 269 thousand last week.
Veterans Day Holiday: Most banks will be closed in observance of Veterans Day. The stock market will be open.
 10:00 AM ET: Job Openings and Labor Turnover Survey for September from the BLS.
 This graph shows job openings (yellow line), hires (purple), Layoff, Discharges and other (red column), and Quits (light blue column) from the JOLTS.
Jobs openings decreased in August to 10.439 million from 11.098 million in July.
10:00 AM: University of Michigan's Consumer sentiment index (Preliminary for November).
Friday, November 05, 2021
Black Knight: Number of Mortgages in Forbearance Declines
by Calculated Risk on 11/05/2021 04:10:00 PM
Note: Both Black Knight and the MBA (Mortgage Bankers Association) are putting out weekly estimates of mortgages in forbearance.
This data is as of November 2nd.
From Andy Walden at Black Knight: October Forbearance Exits Pick Up Pace in Final Week of Month
Improvement in the number of active COVID-19 forbearance plans continued this week as early entrants bumped against final expirations.
According to our McDash Flash daily mortgage performance dataset, the number of loans in active forbearance fell 85,000 (-6.9%). The week’s strongest declines were seen in FHA/VA plans, which marked a 42,000 (-9%) plan reduction. Strong improvement was also observed among GSE plans, which declined by 22,000 (-6%), as well as those held in bank portfolios or private label securities, (-21,000, -5.3%).
As of Nov. 2, 1.14 million mortgage holders remain in COVID-19 related forbearance plans, representing 2.1% of all active mortgages, including 1.2% of GSE, 3.5% FHA/VA and 2.8% of portfolio/PLS loans.
Click on graph for larger image.
Active plans are now down 332,000 (-23%) from the same time last month, as the first wave of forbearance entrants continue to reach their final expirations. Further improvement is likely next week as well, given the 129,000 reviews still scheduled for October, 75% of which are expected to be final expirations.
Finally, forbearance plan starts decreased 8% this week, with plan restart activity falling to its lowest level since early October.
emphasis added

November 5th COVID-19: "Path of the economy continues to depend on the course of the virus"
by Calculated Risk on 11/05/2021 04:03:00 PM
The CDC is the source for all data.
According to the CDC, on Vaccinations. Total doses administered: 426,728,092, as of a week ago 419,020,753, or 1.10 million doses per day.
| COVID Metrics | ||||
|---|---|---|---|---|
| Today | Week Ago | Goal | ||
| Percent fully Vaccinated | 58.2% | 57.8% | ≥70.0%1 | |
| Fully Vaccinated (millions) | 193.2 | 192.0 | ≥2321 | |
| New Cases per Day3🚩 | 71,241 | 69,805 | ≤5,0002 | |
| Hospitalized3 | 41,162 | 45,274 | ≤3,0002 | |
| Deaths per Day3 | 1,102 | 1,211 | ≤502 | |
| 1 Minimum to achieve "herd immunity" (estimated between 70% and 85%). 2my goals to stop daily posts, 37 day average for Cases, Currently Hospitalized, and Deaths 🚩 Increasing 7 day average week-over-week for Cases, Hospitalized, and Deaths ✅ Goal met. | ||||
IMPORTANT: For "herd immunity" most experts believe we need 70% to 85% of the total population fully vaccinated (or already had COVID). Note: COVID will probably stay endemic (at least for some time).
KUDOS to the residents of the 4 states that have achieved 70% of total population fully vaccinated: Vermont at 71.5%, Rhode Island, Connecticut, and Maine at 70.9% .
KUDOS also to the residents of the 16 states and D.C. that have achieved 60% of total population fully vaccinated: Massachusetts at 69.9%, New York, New Jersey, Maryland, New Mexico, New Hampshire, Washington, Oregon, Virginia, District of Columbia, Colorado, California, Pennsylvania, Illinois, Delaware, Minnesota and Hawaii at 60.0%.
The following 20 states have between 50% and 59.9% fully vaccinated: Florida at 59.9%, Wisconsin, Nebraska, Iowa, Illinois, Michigan, Kentucky, South Dakota, Texas, Arizona, Kansas, Nevada, Alaska, Utah, North Carolina, Ohio, Montana, Oklahoma, South Carolina and Indiana at 50.0%.
Next up (total population, fully vaccinated according to CDC) are Missouri at 49.9%, Georgia at 48.5%, Arkansas at 48.2%, and Tennessee at 47.9%.
 Click on graph for larger image.
This graph shows the daily (columns) and 7 day average (line) of positive tests reported.
AAR: October Rail Carloads Down Compared to 2019
by Calculated Risk on 11/05/2021 03:21:00 PM
From the Association of American Railroads (AAR) Rail Time Indicators. Graphs and excerpts reprinted with permission.
U.S. rail volumes continue to be impacted by supply chain issues and an economy that isn’t yet what it could be.
Total U.S. carloads rose 3.8% in October 2021 over October 2020 as year-over-year gains in coal, chemicals, and crushed stone and sand, among others, exceeded declines in motor vehicles, grain, and petroleum products. October was the eighth straight month in which total carloads were higher than the same month in 2020, but the 3.8% gain in October was the lowest gain in those eight months. ...
Supply chain problems (especially shortages of dray trucks, drivers, and warehouse space) kept U.S. intermodal volume down in October — it fell 7.9% from October 2020, its third straight year-over-year decline.
emphasis added
 Click on graph for larger image.
This graph from the Rail Time Indicators report shows the six week average of U.S. Carloads in 2019, 2020 and 2021:
Total U.S. carload traffic has risen slightly but perceptibly over the past two months. At the end of October, the 6-week moving average for total carloads originated was 237,999. That’s the most since mid-June. ... Total carloads in October 2021 were down 3.1% from October 2019. In each month so far in 2021, total carloads in 2021 have been below the comparable month in 2019.
 The second graph shows the six week average (not monthly) of U.S. intermodal in 2019, 2020 and 2021: (using intermodal or shipping containers):
[I]ntermodal volumes continue to be driven down by supply chain problems — especially shortages of dray trucks, drivers, and warehouse space — that are preventing rail customers from clearing their freight from rail terminals as quickly as they and railroads would like. Intermodal in October 2021 was down 7.9% from October 2020, its third straight year-over-year decline. October 202o was at the time the best intermodal month ever.
1st Look at Local Housing Markets in October
by Calculated Risk on 11/05/2021 11:45:00 AM
Today, in the Real Estate Newsletter: 1st Look at Local Housing Markets in October
Excerpt:
This is the first look at local markets in October. I’m tracking about 30 local housing markets in the US. Some of the 30 markets are states, and some are metropolitan areas. I’ll update these tables throughout the month as additional data is released.You can subscribe at https://calculatedrisk.substack.com/ (Currently all content is available for free, but please subscribe).
My view is that if the housing market is slowing, it will show up in inventory (not yet!).
...
Inventory almost always declines seasonally in October, so the MoM decline is not a surprise. Last month, these three markets were down 24% YoY, so the YoY decline in October is larger than in September. This isn’t indicating a slowing market (but this is just 3 early reporting markets).


