 RSS Feed
 by Calculated Risk on 7/19/2021 11:11:00 AM
Monday, July 19, 2021
Housing Inventory July 19th Update: Inventory Increased 5% Week-over-week, Up 27% from Low in early April
Tracking existing home inventory will be very important this year.
 Click on graph for larger image in graph gallery.
This inventory graph is courtesy of Altos Research.
As of July 16th, inventory was at 391 thousand (7 day average), compared to 647 thousand the same week a year ago. That is a decline of 39.6%.
A week ago, inventory was at 373 thousand, and was down 43.0% YoY.
Seasonally, inventory has bottomed. Inventory was about 27.4% above the record low in early April.
Mike Simonsen discusses this data regularly on Youtube. Altos Research has also seen a significant pickup in price decreases, although still well below a normal rate for July.
NAHB: Builder Confidence Declined to 80 in July
by Calculated Risk on 7/19/2021 10:06:00 AM
The National Association of Home Builders (NAHB) reported the housing market index (HMI) was at 80, down from 81 in June. Any number above 50 indicates that more builders view sales conditions as good than poor.
From the NAHB: Builder Confidence Edges Lower as Material Challenges Persist
Atrong buyer demand helped to offset supply-side challenges relating to building materials, regulation and labor as builder confidence in the market for newly built single-family homes inched down one point to 80 in July, according to the NAHB/Wells Fargo Housing Market Index (HMI) released today.
“Builders continue to grapple with elevated building material prices and supply shortages, particularly the price of oriented strand board, which has skyrocketed more than 500 percent above its January 2020 level,” said NAHB Chairman Chuck Fowke. “We are grateful that the White House heeded our urgent plea to hold a building materials meeting with interested stakeholders on July 16 to seek solutions to end production bottlenecks that have harmed housing affordability.”
“Builders are contending with shortages of building materials, buildable lots and skilled labor as well as a challenging regulatory environment. This is putting upward pressure on home prices and sidelining many prospective home buyers even as demand remains strong in a low-inventory environment,” said NAHB Chief Economist Robert Dietz.
...
The three major HMI indices were mixed in June. The HMI index gauging current sales conditions fell one point to 86, the component measuring traffic of prospective buyers dropped six points to 65 and the gauge charting sales expectations in the next six months posted a two-point gain to 81.
Looking at the three-month moving averages for regional HMI scores, the Northeast fell four points to 75, the Midwest moved one-point lower to 71 and the West posted a two-point decline to 87. The South held steady at 85.
 Click on graph for larger image.
This graph show the NAHB index since Jan 1985.
This was below the consensus forecast, but still a very strong reading - and lumber prices have continued to decline.
Seven High Frequency Indicators for the Economy
by Calculated Risk on 7/19/2021 08:10:00 AM
These indicators are mostly for travel and entertainment. It will interesting to watch these sectors recover as the pandemic subsides.
The TSA is providing daily travel numbers.
This data is as of July 18th.
 Click on graph for larger image.
This data shows the 7-day average of daily total traveler throughput from the TSA for 2019 (Light Blue), 2020 (Blue) and 2021 (Red).
The dashed line is the percent of 2019 for the seven day average.
The 7-day average is down 21.0% from the same day in 2019 (79.0% of 2019). (Dashed line)
There was a slow increase from the bottom - and TSA data has picked up in 2021.
The second graph shows the 7-day average of the year-over-year change in diners as tabulated by OpenTable for the US and several selected cities.
IMPORTANT: OpenTable notes: "we’ve updated the data including downloadable dataset from January 1, 2021 onward to compare seated diners from 2021 to 2019, as opposed to year over year." Thanks!
 Thanks to OpenTable for providing this restaurant data:
This data is updated through July 17th, 2021.
This data is "a sample of restaurants on the OpenTable network across all channels: online reservations, phone reservations, and walk-ins. For year-over-year comparisons by day, we compare to the same day of the week from the same week in the previous year."
Note that this data is for "only the restaurants that have chosen to reopen in a given market". Since some restaurants have not reopened, the actual year-over-year decline is worse than shown.
Dining picked up during the holidays, then slumped with the huge winter surge in cases. Dining is generally picking up, but was down 6% in the US (7-day average compared to 2019). Florida and Texas are above 2019 levels.
----- Movie Tickets: Box Office Mojo -----
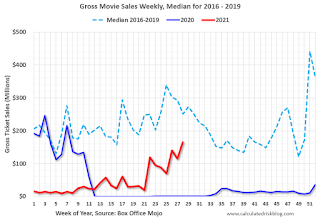 This data shows domestic box office for each week and the median for the years 2016 through 2019 (dashed light blue).
 Thanks to OpenTable for providing this restaurant data:
This data is updated through July 17th, 2021.
This data is "a sample of restaurants on the OpenTable network across all channels: online reservations, phone reservations, and walk-ins. For year-over-year comparisons by day, we compare to the same day of the week from the same week in the previous year."
Note that this data is for "only the restaurants that have chosen to reopen in a given market". Since some restaurants have not reopened, the actual year-over-year decline is worse than shown.
Dining picked up during the holidays, then slumped with the huge winter surge in cases. Dining is generally picking up, but was down 6% in the US (7-day average compared to 2019). Florida and Texas are above 2019 levels.
 This data shows domestic box office for each week and the median for the years 2016 through 2019 (dashed light blue).
 Blue is 2020 and Red is 2021.
The data is from BoxOfficeMojo through July 15th.
Note that the data is usually noisy week-to-week and depends on when blockbusters are released.
Movie ticket sales were at $165 million last week, down about 34% from the median for the week.
Note that the data is usually noisy week-to-week and depends on when blockbusters are released.
Movie ticket sales were at $165 million last week, down about 34% from the median for the week.
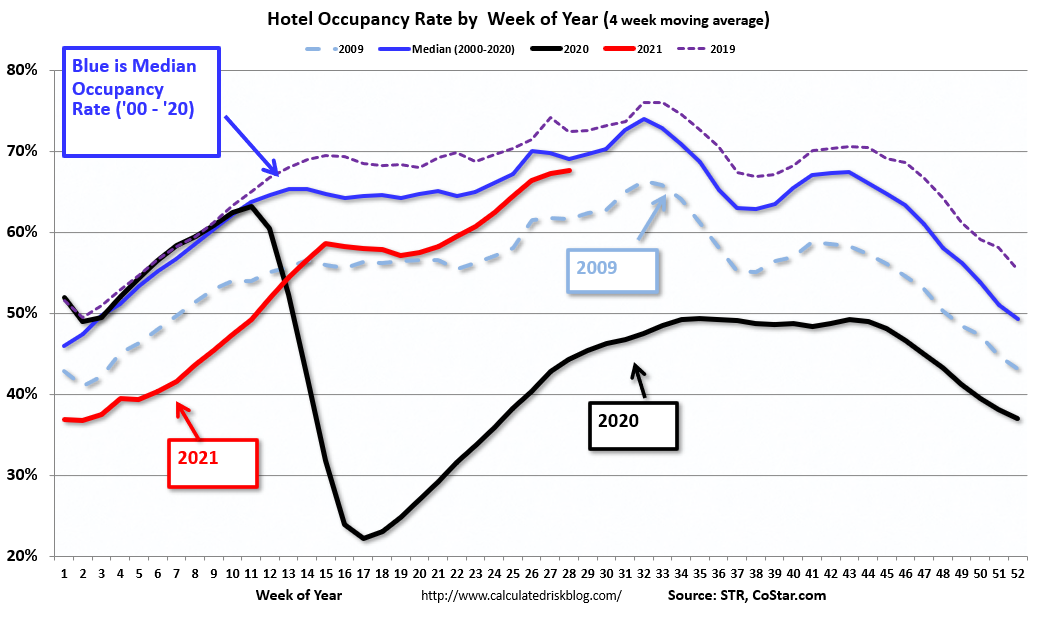 This graph shows the seasonal pattern for the hotel occupancy rate using the four week average.
 The red line is for 2021, black is 2020, blue is the median, dashed purple is 2019, and dashed light blue is for 2009 (the worst year on record for hotels prior to 2020).
Occupancy is now above the horrible 2009 levels and weekend occupancy (leisure) has been solid.
This data is through July 10th. The occupancy rate is down 9.3% compared to the same week in 2019.. Note: Occupancy was up year-over-year, since occupancy declined sharply at the onset of the pandemic. However, the 4-week average occupancy is still down from normal levels.
Notes: Y-axis doesn't start at zero to better show the seasonal change.
 This graph, based on weekly data from the U.S. Energy Information Administration (EIA), shows gasoline supplied compared to the same week of 2019.
Blue is for 2020. Red is for 2021.
As of July 9th, gasoline supplied was up 0.7% compared to the same week in 2019.
This is the third week this year when gasoline supplied was up compared to the same week in 2019.
This graph is from Apple mobility. From Apple: "This data is generated by counting the number of requests made to Apple Maps for directions in select countries/regions, sub-regions, and cities." This is just a general guide - people that regularly commute probably don't ask for directions.
There is also some great data on mobility from the Dallas Fed Mobility and Engagement Index. However the index is set "relative to its weekday-specific average over January–February", and is not seasonally adjusted, so we can't tell if an increase in mobility is due to recovery or just the normal increase in the Spring and Summer.
 This data is through July 17th for the United States and several selected cities.
The graph is the running 7-day average to remove the impact of weekends.
IMPORTANT: All data is relative to January 13, 2020. This data is NOT Seasonally Adjusted. People walk and drive more when the weather is nice, so I'm just using the transit data.
According to the Apple data directions requests, public transit in the 7 day average for the US is at 100% of the January 2020 level.
Here is some interesting data on New York subway usage (HT BR).
 This graph is from Todd W Schneider. This is weekly data since 2015.
 Most weeks are between 30 and 35 million entries, and currently there are over 12 million subway turnstile entries per week - and generally increasing.
This data is through Friday, July 16th.
Schneider has graphs for each borough, and links to all the data sources.
He notes: "Data updates weekly from the MTA’s public turnstile data, usually on Saturday mornings".
This data is through Friday, July 16th.
Schneider has graphs for each borough, and links to all the data sources.
He notes: "Data updates weekly from the MTA’s public turnstile data, usually on Saturday mornings".
Sunday, July 18, 2021
Monday: Homebuilder Survey
by Calculated Risk on 7/18/2021 06:31:00 PM
Weekend:
• Schedule for Week of July 18, 2021
Monday:
• At 10:00 AM ET, the July NAHB homebuilder survey. The consensus is for a reading of 82, up from 81. Any number above 50 indicates that more builders view sales conditions as good than poor.
From CNBC: Pre-Market Data and Bloomberg futures S&P 500 are down 5 and DOW futures are down 65 (fair value).
Oil prices were down over the last week with WTI futures at $71.61 per barrel and Brent at $73.27 per barrel. A year ago, WTI was at $41, and Brent was at $43 - so WTI oil prices are UP about 75% year-over-year (oil prices collapsed at the beginning of the pandemic).
Here is a graph from Gasbuddy.com for nationwide gasoline prices. Nationally prices are at $3.17 per gallon. A year ago prices were at $2.19 per gallon, so gasoline prices are up $0.98 per gallon year-over-year.
July 18th COVID-19, New Cases, Hospitalizations, Vaccinations
by Calculated Risk on 7/18/2021 05:47:00 PM
Note: Cases and Deaths not updated on Sundays.
The 7-day average cases is the highest since May 17th.
The 7-day average hospitalizations is the highest since June 5th.
This data is from the CDC.
According to the CDC, on Vaccinations.
Total doses administered: 337,740,358, as of a week ago 334,151,648. Average doses last week: 0.51 million per day.
KUDOS to the residents of the 20 states and D.C. that have already achieved the 70% goal (percent over 18 with at least one dose): Vermont, Hawaii, Massachusetts and Connecticut are at 80%+, and Maine, New Mexico, New Jersey, Rhode Island, Pennsylvania, California, Maryland, Washington, New Hampshire, New York, Illinois, Virginia, Delaware, Minnesota, Oregon, Colorado and D.C. are all over 70%.
According to the CDC, on Vaccinations.
Total doses administered: 337,740,358, as of a week ago 334,151,648. Average doses last week: 0.51 million per day.
| COVID Metrics | ||||
|---|---|---|---|---|
| Today | Yesterday | Week Ago | Goal | |
| Percent over 18, One Dose | 68.2% | 68.1% | 67.6% | ≥70.0%1,2 |
| Fully Vaccinated✅ (millions) | 161.2 | 161.0 | 159.3 | ≥1601 |
| New Cases per Day3🚩 | 29,604 | 27,932 | 18,642 | ≤5,0002 |
| Hospitalized3🚩 | 17,168 | 16,865 | 13,273 | ≤3,0002 |
| Deaths per Day3🚩 | 238 | 223 | 161 | ≤502 |
| 1 America's Short Term Goals, 2my goals to stop daily posts, 37 day average for Cases, Hospitalized, and Deaths 🚩 Increasing 7 day average week-over-week for Cases, Hospitalized, and Deaths ✅ Goal met (even if late). | ||||
KUDOS to the residents of the 20 states and D.C. that have already achieved the 70% goal (percent over 18 with at least one dose): Vermont, Hawaii, Massachusetts and Connecticut are at 80%+, and Maine, New Mexico, New Jersey, Rhode Island, Pennsylvania, California, Maryland, Washington, New Hampshire, New York, Illinois, Virginia, Delaware, Minnesota, Oregon, Colorado and D.C. are all over 70%.
Next up are Utah at 66.5%, Wisconsin at 66.4%, Florida at 66.4%, Nebraska at 66.1%, South Dakota at 65.1%, and Iowa at 64.7%.
 Click on graph for larger image.
This graph shows the daily (columns) and 7 day average (line) of positive tests reported.
This data is from the CDC.
Charlotte Region Real Estate in June: Sales Up 12% YoY, Inventory Down 52% YoY
by Calculated Risk on 7/18/2021 08:12:00 AM
Note: I'm tracking data for many local markets around the U.S. I think it is especially important to watch inventory this year.
For the Charlotte Region:
Closed sales in June 2021 were 6,148, up 12.0% from 5,487 in June 2020.
Active Listings in June 2021 were 3,462, down 51.8% from 7,182 in June 2020.
Inventory in June was up 11.5% from last month, and up 26.7% from the record low in March 2021.
Months of Supply was 0.7 Months in June 2021, compared to 1.6 Months in June 2020.
Saturday, July 17, 2021
July 17th COVID-19, New Cases, Hospitalizations, Vaccinations
by Calculated Risk on 7/17/2021 05:31:00 PM
The 7-day average cases is the highest since May 17th.
The 7-day average hospitalizations is the highest since June 6th.
This data is from the CDC.
According to the CDC, on Vaccinations.
Total doses administered: 337,239,448, as of a week ago 333,565,404. Average doses last week: 0.52 million per day.
KUDOS to the residents of the 20 states and D.C. that have already achieved the 70% goal (percent over 18 with at least one dose): Vermont, Hawaii, Massachusetts and Connecticut are at 80%+, and Maine, New Mexico, New Jersey, Rhode Island, Pennsylvania, California, Maryland, Washington, New Hampshire, New York, Illinois, Virginia, Delaware, Minnesota, Oregon, Colorado and D.C. are all over 70%.
According to the CDC, on Vaccinations.
Total doses administered: 337,239,448, as of a week ago 333,565,404. Average doses last week: 0.52 million per day.
| COVID Metrics | ||||
|---|---|---|---|---|
| Today | Yesterday | Week Ago | Goal | |
| Percent over 18, One Dose | 68.1% | 68.0% | 67.5% | ≥70.0%1,2 |
| Fully Vaccinated✅ (millions) | 161.0 | 160.7 | 159.0 | ≥1601 |
| New Cases per Day3🚩 | 29,604 | 27,932 | 18,642 | ≤5,0002 |
| Hospitalized3🚩 | 16,865 | 16,241 | 13,270 | ≤3,0002 |
| Deaths per Day3🚩 | 238 | 223 | 161 | ≤502 |
| 1 America's Short Term Goals, 2my goals to stop daily posts, 37 day average for Cases, Hospitalized, and Deaths 🚩 Increasing 7 day average week-over-week for Cases, Hospitalized, and Deaths ✅ Goal met (even if late). | ||||
KUDOS to the residents of the 20 states and D.C. that have already achieved the 70% goal (percent over 18 with at least one dose): Vermont, Hawaii, Massachusetts and Connecticut are at 80%+, and Maine, New Mexico, New Jersey, Rhode Island, Pennsylvania, California, Maryland, Washington, New Hampshire, New York, Illinois, Virginia, Delaware, Minnesota, Oregon, Colorado and D.C. are all over 70%.
Next up are Utah at 66.5%, Wisconsin at 66.3%, Florida at 66.3%, Nebraska at 66.1%, South Dakota at 65.1%, and Iowa at 64.7%.
Click on graph for larger image.This graph shows the daily (columns) and 7 day average (line) of positive tests reported.
This data is from the CDC.
Schedule for Week of July 18, 2021
by Calculated Risk on 7/17/2021 08:11:00 AM
The key reports this week are June Housing Starts and Existing Home Sales.
10:00 AM: The July NAHB homebuilder survey. The consensus is for a reading of 82, up from 81. Any number above 50 indicates that more builders view sales conditions as good than poor.
 8:30 AM ET: Housing Starts for June.
 This graph shows single and total housing starts since 1968.
The consensus is for 1.592 million SAAR, up from 1.572 million SAAR in May.
7:00 AM ET: The Mortgage Bankers Association (MBA) will release the results for the mortgage purchase applications index.
During the day: The AIA's Architecture Billings Index for June (a leading indicator for commercial real estate).
8:30 AM: The initial weekly unemployment claims report will be released. The consensus is for a decrease to 348 thousand from 360 thousand last week.
8:30 AM ET: Chicago Fed National Activity Index for June. This is a composite index of other data.
 10:00 AM: Existing Home Sales for June from the National Association of Realtors (NAR). The consensus is for 5.90 million SAAR, up from 5.80 million last month.
The graph shows existing home sales from 1994 through the report last month.
Housing economist Tom Lawler expects the NAR to report 5.79 million SAAR.
11:00 AM: the Kansas City Fed manufacturing survey for July.
No major economic releases scheduled.
Friday, July 16, 2021
California June Housing: Sales up 28% YoY, "Market momentum appears to be moderating"
by Calculated Risk on 7/16/2021 06:14:00 PM
The CAR reported: Despite a new record price, growth slowed and pending sales dipped for first time since May 2020, C.A.R. reports
Despite an impressive performance in the first six months of the year, the market momentum appears to be moderating with existing home sales dipping for the second month in a row, the CALIFORNIA ASSOCIATION OF REALTORS® (C.A.R.) said today.Note that inventory was up 15.4% from May to June.
Closed escrow sales of existing, single-family detached homes in California totaled a seasonally adjusted annualized rate of 436,020 in June, according to information collected by C.A.R. from more than 90 local REALTOR® associations and MLSs statewide. The statewide annualized sales figure represents what would be the total number of homes sold during 2021 if sales maintained the June pace throughout the year. It is adjusted to account for seasonal factors that typically influence home sales.
June home sales dipped 2.2 percent on a monthly basis from 445,660 in May but were up 28.3% percent from a year ago, when 339,910 homes were sold on an annualized basis. With strong sales growth in June, the state housing market ended the first half of the year with a year-to-date increase of 33.6 percent. Higher-priced markets continued to do well while sales of lower-priced properties remained below last year’s levels.
“We’re starting to see what a difference just a slight uptick in inventory and listings can do to help lessen the buying frenzy and create a sense of normalcy,” said C.A.R. President Dave Walsh. “The market is still extremely competitive, with 70 percent of homes selling above list price; however, the number of new listings increased in June, and both the share of listings with a reduced price and median reduction amount increased, giving buyers more opportunities to purchase.”
...
The state housing supply condition continued to improve with active listings reaching the highest level since last October. The number of for sale properties increased 15.4 percent in June from the prior month as more homes were being listed on the market. New active listings, while still down 12.3 percent from two years ago, increased both month-over-month and year-over-year by around 8 percent in June 2021. Housing supply typically climbs during this time of the year and remains on an upward trend until late July/early August.
emphasis added
Lawler: Early Read on Existing Home Sales in June
by Calculated Risk on 7/16/2021 03:52:00 PM
From housing economist Tom Lawler (see important comments on inventory):
Based on publicly-available local realtor/MLS reports released across the country through today, I project that existing home sales as estimated by the National Association of Realtors ran at a seasonally adjusted annual rate of 5.79 million in June, down 0.2% from May’s preliminary pace and up 21.4% from last June’s seasonally adjusted pace.
Local realtor reports, as well as reports from national inventory trackers, suggest that while the inventory of existing homes for sale remained very low last month, inventories on the month increased by significantly more than the seasonal norm, and the YOY decline in June was significantly less than in May. What this means for the NAR’s inventory estimate for June, however, in unclear. As I’ve noted before, the inventory measure in most publicly-released local realtor/MLS reports excludes listings with pending contracts, but that is not the case for most of the reports sent to the NAR (referred to as the “NAR Report!”), Since the middle of last Spring inventory measures excluding pending listings have fallen much more sharply than inventory measures including such listings, and this latter inventory measure understates the decline in the effective inventory of homes for sale over the last several months. Having said that, however, it appears as if seasonally adjusted inventories are now on the rise.
Finally, local realtor/MLS reports suggest the median existing single-family home sales price last month was up by about 21% from last June.
CR Note: The National Association of Realtors (NAR) is scheduled to release June existing home sales on Thursday, July 22, 2021 at 10:00 AM ET. The consensus is for 5.90 million SAAR.


