 RSS Feed
 by Calculated Risk on 7/05/2021 02:27:00 PM
Monday, July 05, 2021
Homebuilder Comments in June: “It’s not fun to be a builder anymore.”
Some twitter comments from Rick Palacios Jr., Director of Research at John Burns Real Estate Consulting:
Analyzing June new home sales & pricing figures from our monthly builder survey. As one builder noted: “It’s not fun to be a builder anymore.” Lumber relief is nice but pick your poison on other issues. Market commentary from across the country to follow...
#Richmond builder: “It's not fun to be a builder anymore. Cost pressure is killing us. Not only will builders like myself who take 12-24 months to build a house lose margin from increases, but the affordability is becoming a major issue.”
#Atlanta builder: “Costs have driven up prices & we’re no longer preselling. We will not sell a home until frame stage, so our sales numbers are off for June while awaiting framing stage.”
#Jacksonville builder: “Home buyers are more sophisticated than in years past, watching & understanding commodity prices. Some buyers have paused their house searches waiting for the decreases in hopes builders in turn lower prices.”
#Sarasota builder: “We are feeling some buyer hesitancy because of significant price increases & timing. We can't start a new buyer's home until February 2022.”
#WestPalmBeach builder: “Cost increases are still coming in daily. Materials continue to be delayed coming on site. Cycle times are increasing as much as 50%. Windows & trusses remain the biggest issue.”
#Chicago builder: “Haven’t bid a new project this year as cost increases are too great to be competitive in the infill spec market. Doing remodeling work until things settle down.”
#Indianapolis builder: “Major concern is ability to develop enough lots to supply the market. Pipe shortage & labor shortages by development contractors are creating a bottleneck.”
#Charlotte builder: “We would not let our sales team sell during the month of June. We needed to take a "pause" from mid-May to the end of June to let our design and construction teams get caught up.”
#Wilmington builder: “Sales slow as we are not offering product for sale until we have our costs set. Delivery times for trusses are now 15 weeks. Drop in lumber prices could be partially due to truss availability. Builders can't purchase lumber until trusses delivered.”
#Knoxville builder: “Only reason we have such a slow sales rate in June is we have nothing to sell. We are no longer listing any new starts for sale until drywall is in.”
#Nashville builder: “Lumber supply including Truss joists, I-joists, glue lam beams, & oriented strand board are restricting starts & sales.”
#Sacramento builder: “Severely disrupted supply chain & supply shortages are causing us to change specs to more expensive products.”
#RiversideSanBernardino builder: “Shortages are creating many "go backs." Subs have caught on and are increasing labor to cover "go backs." It's hell right now to finish a home in a proper manner. Subs have reached capitulation.”
#Portland builder: “Lumber theft is a big deal. Thieves are now stealing staged material on 2nd floors of homes under construction.”
#Bend builder: “Sherwin Williams told us they are out of exterior base paint until later in July. Appliances must be ordered 6-9 months in advance. Seeing signs of price ceiling, namely upper end of market.”
#Philadelphia builder: “Cost increases are out of control. Scary to think delays will keep our houses sitting waiting for trusses/lumber & siding. Windows just got extended to 15-17 weeks out. Short staffing of contractors is a problem too.”
#Austin builder: “Might have seen a peak in lumber but labor is going to explode & create huge bottlenecks due to all the starts over the last month. Skilled labor is going to be a huge issue.”
#Dallas builder: “Hard to get lumber, windows, air conditioning coils, etc. Air conditioning coils are in short supply and many are backordered, causing delays in getting inspections.”
#FortWorth builder: “Experiencing windows, brick, & now paint shortages. Some prospective buyers have put off purchasing to see if prices will come down.”
#Houston builder: “We’ve seen roughly $8-10K on average of cost increases each month for the past 4-5 months. Lumber has been the key cost driver, but plumbing, electrical, insulation, & virtually every other component has also increased much faster than historical levels.”
#SanAntonio builder: “Sales rate dropped only because we cut off new sales. We are selling too fast & burning through our lots. As of now, we are only selling spec homes. Otherwise, our sales pace would still be increasing month over month.”
#ColoradoSprings builder: “In addition to higher costs, we have had delays in construction & are questioning our ability to hit our closing numbers, despite strong sales.”
#Denver builder: “While lumber is beginning to come down, we anticipate a number of increases in other product categories. Starts exceed sales because we’re waiting to release homes until we have at least ordered lumber & know the cost.”
#SaltLakeCity builder: “Our cameras see theft almost every other night. Getting price increase letters at least weekly. Everyone is taking advantage of every crisis they can. Plumbing supplier said COVID has caused a 75% decrease in production because of being short staffed."
#Phoenix builder: “Appliance back orders through General Electric are still a major issue at closings. Cost of plywood still out of control. Shortage of labor, & especially qualified workers is getting worse. HVAC is the farthest behind labor & material trade.” END
Housing Inventory July 5th Update: Inventory Increased Week-over-week
by Calculated Risk on 7/05/2021 12:10:00 PM
Tracking existing home inventory will be very important this year.
 Click on graph for larger image in graph gallery.
This inventory graph is courtesy of Altos Research.
As of July 2nd, inventory was at 373 thousand (7 day average), compared to 666 thousand the same week a year ago. That is a decline of 44.0%.
A week ago, inventory was at 359 thousand, and was down 46.9% YoY.
Seasonally, inventory has bottomed. Inventory was about 21.8% above the record low in early April.
Mike Simonsen discusses this data regularly on Youtube. Altos Research has also seen a significant pickup in price decreases, although still well below a normal rate for June.
Employment: June Diffusion Indexes
by Calculated Risk on 7/05/2021 09:57:00 AM
The employment diffusion indexes are useful in gauging how widespread job gains are in a given month.
For manufacturing, the diffusion index was at 62.0, down from 63.3 in May.
Think of this as a measure of how widespread job gains or losses are across industries. The further from 50 (above or below), the more widespread the job losses or gains reported by the BLS. From the BLS:
Figures are the percent of industries with employment increasing plus one-half of the industries with unchanged employment, where 50 percent indicates an equal balance between industries with increasing and decreasing employment.
 Click on graph for larger image.
Both indexes declined sharply in March 2020, and collapsed to new record lows in April 2020 due to the impact from COVID-19. Then the indexes increased as the economy bounced back.
Both indexes were solid in June, indicating job growth was widespread across industries.
Sunday, July 04, 2021
July 4th COVID-19 New Cases, Vaccinations, Hospitalizations
by Calculated Risk on 7/04/2021 04:44:00 PM
Note: According to the CDC, "In observance of Independence Day, the COVID Data Tracker will not update on Monday, July 5th, 2021. Updates will resume on Tuesday, July 6th, 2021."
This data is from the CDC.
According to the CDC, on Vaccinations.
Total doses administered: 330,604,253, as of a week ago 323,327,328. Average doses last week: 1.04 million per day.
KUDOS to the residents of the 20 states and D.C. that have already achieved the 70% goal: Vermont, Hawaii and Massachusetts are at 80%+, and Connecticut, Maine, New Jersey, Rhode Island, Pennsylvania, New Mexico, Maryland, California, Washington, New Hampshire, New York, Illinois, Virginia, Delaware, Minnesota, Colorado, Oregon and D.C. are all over 70%.
Next up are Wisconsin at 65.7%, Nebraska at 65.3%, Florida at 65.1%, Utah at 64.4%, South Dakota at 64.3%, and Iowa at 64.0%.
 Click on graph for larger image.
This graph shows the daily (columns) and 7 day average (line) of positive tests reported.
This data is from the CDC.
According to the CDC, on Vaccinations.
Total doses administered: 330,604,253, as of a week ago 323,327,328. Average doses last week: 1.04 million per day.
| COVID Metrics | ||||
|---|---|---|---|---|
| Today | Yesterday | Week Ago | Goal | |
| Percent over 18, One Dose | 67.1% | 67.0% | 66.0% | ≥70.0%1,2 |
| Fully Vaccinated (millions) | 157.3 | 157.0 | 153.0 | ≥1601 |
| New Cases per Day3🚩 | 13,241 | 12,914 | 11,969 | ≤5,0002 |
| Hospitalized3 | 11,904 | 12,101 | 12,125 | ≤3,0002 |
| Deaths per Day3 | 215 | 213 | 238 | ≤502 |
| 1 America's Short Term Goals, 2my goals to stop daily posts, 37 day average for Cases, Hospitalized, and Deaths 🚩 Increasing week-over-week | ||||
KUDOS to the residents of the 20 states and D.C. that have already achieved the 70% goal: Vermont, Hawaii and Massachusetts are at 80%+, and Connecticut, Maine, New Jersey, Rhode Island, Pennsylvania, New Mexico, Maryland, California, Washington, New Hampshire, New York, Illinois, Virginia, Delaware, Minnesota, Colorado, Oregon and D.C. are all over 70%.
Next up are Wisconsin at 65.7%, Nebraska at 65.3%, Florida at 65.1%, Utah at 64.4%, South Dakota at 64.3%, and Iowa at 64.0%.
 Click on graph for larger image.
This graph shows the daily (columns) and 7 day average (line) of positive tests reported.
This data is from the CDC.
By Request: Public and Private Sector Payroll Jobs During Presidential Terms
by Calculated Risk on 7/04/2021 11:40:00 AM
Note: I used to post this monthly, but I stopped during the COVID-19 pandemic. I've received a number of requests lately to post this again, so here is another update of tracking employment during Presidential terms. We frequently use Presidential terms as time markers - we could use Speaker of the House, Fed Chair, or any other marker.
Important: There are many differences between these periods. Overall employment was smaller in the '80s, however the participation rate was increasing in the '80s (younger population and women joining the labor force), and the participation rate is generally declining now. But these graphs give an overview of employment changes.
The first graph shows the change in private sector payroll jobs from when each president took office until the end of their term(s). Presidents Carter, George H.W. Bush and Trump only served one term.
Mr. G.W. Bush (red) took office following the bursting of the stock market bubble, and left during the bursting of the housing bubble. Mr. Obama (dark blue) took office during the financial crisis and great recession. There was also a significant recession in the early '80s right after Mr. Reagan (dark red) took office.
There was a recession towards the end of President G.H.W. Bush (light purple) term, and Mr. Clinton (light blue) served for eight years without a recession. And there was a pandemic related recession in 2020.
 Click on graph for larger image.
The first graph is for private employment only.
The employment recovery during Mr. G.W. Bush's (red) first term was sluggish, and private employment was down 824,000 jobs at the end of his first term. At the end of Mr. Bush's second term, private employment was collapsing, and there were net 387,000 private sector jobs lost during Mr. Bush's two terms.
Private sector employment increased by 9,039,000 under President Carter (dashed green), by 14,714,000 under President Reagan (dark red), 1,511,000 under President G.H.W. Bush (light purple), 20,970,000 under President Clinton (light blue), and 11,828,000 under President Obama (dark dashed blue). During Trump's term (Orange), the economy lost 2,135,000 private sector jobs.
In the first five months of President Biden's term (Blue), the economy has added 2,750,000 private sector jobs, as the economy recovers from the pandemic.
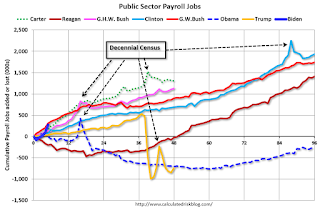 A big difference between the presidencies has been public sector employment. Note: the bumps in public sector employment due to the decennial Census in 1980, 1990, 2000, 2010 and 2020.
The public sector grew during Mr. Carter's term (up 1,304,000), during Mr. Reagan's terms (up 1,414,000), during Mr. G.H.W. Bush's term (up 1,127,000), during Mr. Clinton's terms (up 1,934,000), and during Mr. G.W. Bush's terms (up 1,744,000 jobs). However the public sector declined significantly while Mr. Obama was in office (down 271,000 jobs). During Trump's term, the economy lost 741,000 public sector jobs.
 A big difference between the presidencies has been public sector employment. Note: the bumps in public sector employment due to the decennial Census in 1980, 1990, 2000, 2010 and 2020.
 The public sector grew during Mr. Carter's term (up 1,304,000), during Mr. Reagan's terms (up 1,414,000), during Mr. G.H.W. Bush's term (up 1,127,000), during Mr. Clinton's terms (up 1,934,000), and during Mr. G.W. Bush's terms (up 1,744,000 jobs). However the public sector declined significantly while Mr. Obama was in office (down 271,000 jobs). During Trump's term, the economy lost 741,000 public sector jobs.
In the first five months of President Biden's term, the economy has added 273,000 public sector jobs (mostly education).
Saturday, July 03, 2021
July 3rd COVID-19 New Cases, Vaccinations, Hospitalizations
by Calculated Risk on 7/03/2021 05:38:00 PM
Congratulations to the residents of Colorado and Oregon on joining the 70% club! Go for 80%!!!
This data is from the CDC.
According to the CDC, on Vaccinations.
Total doses administered: 329,970,551, as of a week ago 322,123,103. Average doses last week: 1.12 million per day.
| COVID Metrics | ||||
|---|---|---|---|---|
| Today | Yesterday | Week Ago | Goal | |
| Percent over 18, One Dose | 67.0% | 66.8% | 65.9% | ≥70.0%1,2 |
| Fully Vaccinated (millions) | 157.0 | 156.3 | 152.2 | ≥1601 |
| New Cases per Day3🚩 | 13,241 | 12,914 | 11,969 | ≤5,0002 |
| Hospitalized3 | 12,101 | 12,015 | 12,125 | ≤3,0002 |
| Deaths per Day3 | 215 | 213 | 238 | ≤502 |
| 1 America's Goal by July 4th, 2my goals to stop daily posts, 37 day average for Cases, Hospitalized, and Deaths 🚩 Increasing week-over-week | ||||
KUDOS to the residents of the 20 states and D.C. that have already achieved the 70% goal: Vermont, Hawaii and Massachusetts are at 80%+, and Connecticut, Maine, New Jersey, Rhode Island, Pennsylvania, New Mexico, Maryland, California, Washington, New Hampshire, New York, Illinois, Virginia, Delaware, Minnesota, Colorado, Oregon and D.C. are all over 70%.
Next up are Wisconsin at 65.6%, Nebraska at 65.3%, Florida at 64.8%, South Dakota at 64.3%, and Utah at 64.3%.
Click on graph for larger image.This graph shows the daily (columns) and 7 day average (line) of positive tests reported.
This data is from the CDC.
30 Year Mortgage Rates at 3.16%
by Calculated Risk on 7/03/2021 10:46:00 AM
From Matthew Graham at Mortgage News Daily: Rates Defy Jobs Report (And Other Weekly Highlights)
Rates had a good week, with most lenders at or near their best levels since mid June at the very least. 10yr Treasury yields trickled to their best levels in months by Friday afternoon after managing to break the 1.44% floor that had turned away several recent attempts. [30YR FIXED - 3.16%]
emphasis added
 Click on graph for larger image.
This is a graph from Mortgage News Daily (MND) showing 30 year fixed rates from three sources (MND, MBA, Freddie Mac). Go to MND and you can adjust the graph for different time periods.
30 year mortgage rates are up from the record lows in 2020, but still historically very low.
Schedule for Week of July 4, 2021
by Calculated Risk on 7/03/2021 08:11:00 AM
This will be a light week for economic data.
The focus will be on Job Openings.
All US markets will be closed in observance of Independence Day.
8:00 AM: Corelogic House Price index for May.
10:00 AM: the ISM non-Manufacturing Index for June. The consensus is for a reading of 63.9, down from 64.0.
7:00 AM ET: The Mortgage Bankers Association (MBA) will release the results for the mortgage purchase applications index.
 10:00 AM ET: Job Openings and Labor Turnover Survey for May from the BLS.
 This graph shows job openings (yellow line), hires (purple), Layoff, Discharges and other (red column), and Quits (light blue column) from the JOLTS.
Jobs openings increased in April to a record 9.286 million from 8.288 million in March.
The number of job openings (yellow) were up 100% year-over-year, and Quits were up 88% year-over-year (compared to worst of pandemic).
2:00 PM: FOMC Minutes, Meeting of June 15-16, 2021
8:30 AM: The initial weekly unemployment claims report will be released. The consensus is for a decrease to 350 thousand from 364 thousand last week.
No major economic releases scheduled.
Friday, July 02, 2021
July 2nd COVID-19 New Cases, Vaccinations, Hospitalizations
by Calculated Risk on 7/02/2021 03:47:00 PM
This data is from the CDC.
According to the CDC, on Vaccinations.
Total doses administered: 328,809,470, as of a week ago 321,199,379. Average doses last week: 1.09 million per day.
| COVID Metrics | ||||
|---|---|---|---|---|
| Today | Yesterday | Week Ago | Goal | |
| Percent over 18, One Dose | 66.8% | 66.7% | 65.8% | ≥70.0%1,2 |
| Fully Vaccinated (millions) | 156.3 | 155.9 | 151.6 | ≥1601 |
| New Cases per Day3,4🚩 | 12,878 | 12,528 | 11,733 | ≤5,0002 |
| Hospitalized3 | 12,015 | 11,974 | 12,235 | ≤3,0002 |
| Deaths per Day3,4 | 214 | 205 | 226 | ≤502 |
| 1 America's Goal by July 4th, 2my goals to stop daily posts, 37 day average for Cases, Hospitalized, and Deaths 4Cases and Deaths updated Mon - Fri 🚩 Increasing week-over-week | ||||
KUDOS to the residents of the 18 states and D.C. that have already achieved the 70% goal: Vermont, Hawaii and Massachusetts are at 80%+, and Connecticut, Maine, New Jersey, Rhode Island, Pennsylvania, New Mexico, Maryland, California, Washington, New Hampshire, New York, Illinois, Virginia, Delaware, Minnesota and D.C. are all over 70%.
Next up are Colorado at 69.9%, Oregon at 69.8%, Wisconsin at 65.5%, Nebraska at 65.3%, Florida at 64.7%, South Dakota at 64.3%, and Utah at 64.3%.
 Click on graph for larger image.
This graph shows the daily (columns) and 7 day average (line) of positive tests reported.
This data is from the CDC.
Trade Deficit Increased to $71.2 Billion in May
by Calculated Risk on 7/02/2021 01:59:00 PM
From the Department of Commerce reported:
The U.S. Census Bureau and the U.S. Bureau of Economic Analysis announced today that the goods and services deficit was $71.2 billion in May, up $2.2 billion from $69.1 billion in April, revised.
May exports were $206.0 billion, $1.3 billion more than April exports. May imports were $277.3 billion, $3.5 billion more than April imports.
emphasis added
 Click on graph for larger image.
Exports and imports increased in May.
Exports are up 41% compared to May 2020; imports are up 38% compared to May 2020.
Both imports and exports decreased sharply due to COVID-19, and have now bounced back (imports more than exports),
The second graph shows the U.S. trade deficit, with and without petroleum.
 The blue line is the total deficit, and the black line is the petroleum deficit, and the red line is the trade deficit ex-petroleum products.
Note that net, imports and exports of petroleum products are close to zero.
The trade deficit with China decreased to $26.3 billion in May, from $26.9 billion in May 2020.


