 RSS Feed
 by Calculated Risk on 5/24/2021 03:53:00 PM
Monday, May 24, 2021
May 24th COVID-19 New Cases, Vaccinations; Hospitalizations Finally Below Post-Summer Surge Low
The economy will pick up speed as more and more people get vaccinated!
According to the CDC, on Vaccinations. Total administered: 286,890,900, as of yesterday 285,720,586. Day: 1.17 million. (U.S. Capacity is around 4 million per day)
1) 61.5% of the population over 18 has had at least one dose (70% is the goal by July 4th).
2) 130.6 million Americans are fully vaccinated (160 million goal by July 4th)
Note: I'll stop posting this daily once all four of these criteria are met:
1) 70% of the population over 18 has had at least one dose of vaccine, and
2) new cases are under 5,000 per day, and
3) hospitalizations are below 3,000, and
4) average daily deaths under 50 (currently 500 per day).
And check out COVID Act Now to see how each state is doing.
Over 12,000 US deaths were reported so far in May due to COVID.
 Click on graph for larger image.
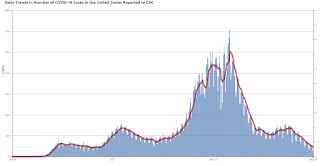
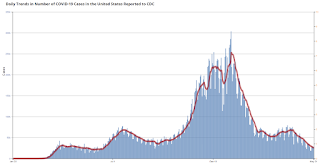
This graph shows the daily (columns) 7 day average (line) of positive tests reported.
This data is from the CDC.
 Click on graph for larger image.
This graph shows the daily (columns) 7 day average (line) of positive tests reported.
This data is from the CDC.
The 7-day average is 22,877, down from 23,834 yesterday, and down sharply from the recent peak of 69,881 on April 13, 2021. This is the lowest since June 14, 2020.
The second graph shows the number of people hospitalized.
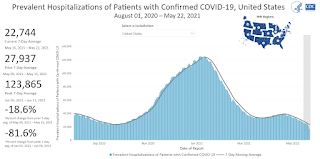 This data is also from the CDC.
The CDC cautions that due to reporting delays, the area in grey will probably increase.
The current 7-day average is 22,744, down from 23,917 reported yesterday, and finally below the post-summer surge low of 23,000.
Housing Inventory May 24th Update: Inventory Increased Week-over-week
by Calculated Risk on 5/24/2021 01:10:00 PM
One of the key questions for 2021 is: Will inventory increase as the pandemic subsides, or will inventory decrease further in 2021?
Tracking inventory will be very important this year.
 Click on graph for larger image in graph gallery.
This inventory graph is courtesy of Altos Research.
As of May 21st, inventory was at 324 thousand (7 day average), compared to 725 thousand the same week a year ago. That is a decline of 55.3%.
A week ago, inventory was at 314 thousand, and was down 57.0% YoY. Seasonally, inventory has probably bottomed. Inventory was about 5.5% above the low in early April.
Mike Simonsen discusses this data regularly on Youtube.
Lawler: Single-Family Rent Trends
by Calculated Risk on 5/24/2021 11:33:00 AM
CR Note: Last week, I posted a brief note from housing economist Tom Lawler: Lawler: Is the “Owners’ Equivalent Rent” Index Set to Accelerate Sharply?.
Here is some more information from Lawler:
Two of the largest institutional holders of single-family rental properties recently reported that demand for single-family rentals has rebounded strongly over the past several quarters, and both reported an acceleration in rental increases.
Invitation Homes owns about 80,330 single-family homes, while American Homes 4 Rent owns about 51,984 single-family homes.
While apartment rents in many large cities fell sharply following the pandemic (though rents have rebounded somewhat recently), the single-family rental market held up much better, as did the apartment rental markets in less-densely-populated (and less expensive) cities.
A recent report from CoreLogic also shows this to be the case. CoreLogic’s Single-Family Rent Index (SFRI), based on repeat-rent analysis of the same rental properties, increased by 4.3% YOY in March, compared to a recent YOY low of 1.4% in June. The SFRI for the “high-price” tier showed a 5.0% YOY gain in March, while the “low-price” tier showed just a 3.2% YOY increase. In terms of property type, the SFRI for SF detached properties increased by 6.9% YOY gain in March (a record high), while the SFRI for SF attached properties showed just a 1.3% YOY rise.
Here is a chart from the report, which is available here: U.S. Single-Family Rents Up 4.3% Year Over Year in March.
 Click on graph for larger image.
From CoreLogic:
Two of the largest institutional holders of single-family rental properties recently reported that demand for single-family rentals has rebounded strongly over the past several quarters, and both reported an acceleration in rental increases.
| Rent Increase, "Same-Store" Homes | |||
|---|---|---|---|
| Invitation Homes | |||
| Renewals | New Leases | Blended | |
| Q1/2020 | 4.2% | 1.8% | 3.4% |
| Q2/2020 | 3.5% | 2.7% | 3.3% |
| Q3/2020 | 3.3% | 5.5% | 4.0% |
| Q4/2020 | 3.8% | 6.9% | 4.9% |
| Q1/2021 | 4.4% | 7.9% | 5.4% |
| Apr-21 | 5.5% | 10.8% | 7.0% |
| American Homes 4 Rent | |||
| Renewals | New Leases | Blended | |
| Q1/2020 | 4.6% | 3.4% | 4.2% |
| Q2/2020 | 1.3% | 4.4% | 2.4% |
| Q3/2020 | 1.1% | 6.0% | 2.8% |
| Q4/2020 | 4.3% | 7.6% | 5.5% |
| Q1/2021 | 5.1% | 10.0% | 6.9% |
| Apr-21 | 11.0% | ||
Invitation Homes owns about 80,330 single-family homes, while American Homes 4 Rent owns about 51,984 single-family homes.
While apartment rents in many large cities fell sharply following the pandemic (though rents have rebounded somewhat recently), the single-family rental market held up much better, as did the apartment rental markets in less-densely-populated (and less expensive) cities.
A recent report from CoreLogic also shows this to be the case. CoreLogic’s Single-Family Rent Index (SFRI), based on repeat-rent analysis of the same rental properties, increased by 4.3% YOY in March, compared to a recent YOY low of 1.4% in June. The SFRI for the “high-price” tier showed a 5.0% YOY gain in March, while the “low-price” tier showed just a 3.2% YOY increase. In terms of property type, the SFRI for SF detached properties increased by 6.9% YOY gain in March (a record high), while the SFRI for SF attached properties showed just a 1.3% YOY rise.
Here is a chart from the report, which is available here: U.S. Single-Family Rents Up 4.3% Year Over Year in March.
 Click on graph for larger image.
From CoreLogic:
Rent prices for the low-end tier, increased 3.2% year over year in March 2021, down from 3.8% in March 2020. Meanwhile, higher-priced rentals increased 5% in March 2021, up from a gain of 2.8% in March 2020. This was the fastest increase in higher-price rents since August 2006.
Seven High Frequency Indicators for the Economy
by Calculated Risk on 5/24/2021 08:49:00 AM
These indicators are mostly for travel and entertainment. It will interesting to watch these sectors recover as the vaccine is distributed.
IMPORTANT: Be safe now - if all goes well, everyone could be vaccinated by June.
----- Airlines: Transportation Security Administration -----
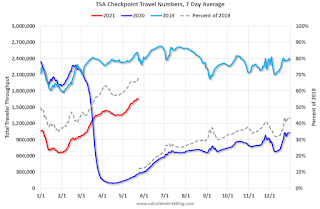
The TSA is providing daily travel numbers.
 Click on graph for larger image.
This data shows the seven day average of daily total traveler throughput from the TSA for 2019 (Light Blue), 2020 (Blue) and 2021 (Red).
The dashed line is the percent of 2019 for the seven day average.
This data is as of May 23rd.
The seven day average is down 32.0% from the same day in 2019 (68.0% of 2019). (Dashed line)
There was a slow increase from the bottom - and TSA data has picked up in 2021.
----- Restaurants: OpenTable -----
The second graph shows the 7 day average of the year-over-year change in diners as tabulated by OpenTable for the US and several selected cities.
----- Hotel Occupancy: STR -----
 This graph shows the seasonal pattern for the hotel occupancy rate using the four week average.
The red line is for 2021, black is 2020, blue is the median, and dashed light blue is for 2009 (the worst year since the Great Depression for hotels - before 2020).
Occupancy is now slightly above the horrible 2009 levels.
This data is through May 15th. Hotel occupancy is currently down 16% compared to same week in 2019). Note: Occupancy was up year-over-year, since occupancy declined sharply at the onset of the pandemic. However, occupancy is still down significantly from normal levels.
Notes: Y-axis doesn't start at zero to better show the seasonal change.
----- Gasoline Supplied: Energy Information Administration -----
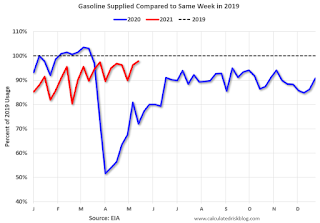 This graph, based on weekly data from the U.S. Energy Information Administration (EIA), shows gasoline supplied compared to the same week of 2019.
Blue is for 2020. Red is for 2021.
As of May 14th, gasoline supplied was off about 2.2% (about 97.8% of the same week in 2019).
Gasoline supplied was up year-over-year, since at one point, gasoline supplied was off almost 50% YoY in 2020.
----- Transit: Apple Mobility -----
This graph is from Apple mobility. From Apple: "This data is generated by counting the number of requests made to Apple Maps for directions in select countries/regions, sub-regions, and cities." This is just a general guide - people that regularly commute probably don't ask for directions.
There is also some great data on mobility from the Dallas Fed Mobility and Engagement Index. However the index is set "relative to its weekday-specific average over January–February", and is not seasonally adjusted, so we can't tell if an increase in mobility is due to recovery or just the normal increase in the Spring and Summer.
 This data is through May 22nd for the United States and several selected cities.
The graph is the running 7 day average to remove the impact of weekends.
IMPORTANT: All data is relative to January 13, 2020. This data is NOT Seasonally Adjusted. People walk and drive more when the weather is nice, so I'm just using the transit data.
According to the Apple data directions requests, public transit in the 7 day average for the US is at 78% of the January 2020 level and moving up.
----- New York City Subway Usage -----
Here is some interesting data on New York subway usage (HT BR).
 This graph is from Todd W Schneider. This is weekly data since 2015.
The TSA is providing daily travel numbers.
 Click on graph for larger image.
This data shows the seven day average of daily total traveler throughput from the TSA for 2019 (Light Blue), 2020 (Blue) and 2021 (Red).
The dashed line is the percent of 2019 for the seven day average.
This data is as of May 23rd.
The seven day average is down 32.0% from the same day in 2019 (68.0% of 2019). (Dashed line)
There was a slow increase from the bottom - and TSA data has picked up in 2021.
The second graph shows the 7 day average of the year-over-year change in diners as tabulated by OpenTable for the US and several selected cities.
IMPORTANT: OpenTable notes: "we’ve updated the data including downloadable dataset from January 1, 2021 onward to compare seated diners from 2021 to 2019, as opposed to year over year." Thanks!
 Thanks to OpenTable for providing this restaurant data:
This data is updated through May 22, 2021.
This data is "a sample of restaurants on the OpenTable network across all channels: online reservations, phone reservations, and walk-ins. For year-over-year comparisons by day, we compare to the same day of the week from the same week in the previous year."
Note that this data is for "only the restaurants that have chosen to reopen in a given market". Since some restaurants have not reopened, the actual year-over-year decline is worse than shown.
Dining picked up during the holidays, then slumped with the huge winter surge in cases. Dining was picking up again. Florida and Texas are above 2019 levels.
----- Movie Tickets: Box Office Mojo -----
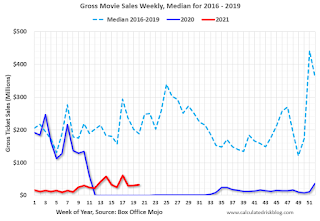 This data shows domestic box office for each week and the median for the years 2016 through 2019 (dashed light blue).
 Thanks to OpenTable for providing this restaurant data:
This data is updated through May 22, 2021.
This data is "a sample of restaurants on the OpenTable network across all channels: online reservations, phone reservations, and walk-ins. For year-over-year comparisons by day, we compare to the same day of the week from the same week in the previous year."
Note that this data is for "only the restaurants that have chosen to reopen in a given market". Since some restaurants have not reopened, the actual year-over-year decline is worse than shown.
Dining picked up during the holidays, then slumped with the huge winter surge in cases. Dining was picking up again. Florida and Texas are above 2019 levels.
 This data shows domestic box office for each week and the median for the years 2016 through 2019 (dashed light blue).
 Blue is 2020 and Red is 2021.
The data is from BoxOfficeMojo through May 20th.
Note that the data is usually noisy week-to-week and depends on when blockbusters are released.
Movie ticket sales were at $32 million last week, down about 83% from the median for the week.
Note that the data is usually noisy week-to-week and depends on when blockbusters are released.
Movie ticket sales were at $32 million last week, down about 83% from the median for the week.
 This graph shows the seasonal pattern for the hotel occupancy rate using the four week average.
 The red line is for 2021, black is 2020, blue is the median, and dashed light blue is for 2009 (the worst year since the Great Depression for hotels - before 2020).
Occupancy is now slightly above the horrible 2009 levels.
This data is through May 15th. Hotel occupancy is currently down 16% compared to same week in 2019). Note: Occupancy was up year-over-year, since occupancy declined sharply at the onset of the pandemic. However, occupancy is still down significantly from normal levels.
Notes: Y-axis doesn't start at zero to better show the seasonal change.
 This graph, based on weekly data from the U.S. Energy Information Administration (EIA), shows gasoline supplied compared to the same week of 2019.
Blue is for 2020. Red is for 2021.
As of May 14th, gasoline supplied was off about 2.2% (about 97.8% of the same week in 2019).
Gasoline supplied was up year-over-year, since at one point, gasoline supplied was off almost 50% YoY in 2020.
This graph is from Apple mobility. From Apple: "This data is generated by counting the number of requests made to Apple Maps for directions in select countries/regions, sub-regions, and cities." This is just a general guide - people that regularly commute probably don't ask for directions.
There is also some great data on mobility from the Dallas Fed Mobility and Engagement Index. However the index is set "relative to its weekday-specific average over January–February", and is not seasonally adjusted, so we can't tell if an increase in mobility is due to recovery or just the normal increase in the Spring and Summer.
 This data is through May 22nd for the United States and several selected cities.
The graph is the running 7 day average to remove the impact of weekends.
IMPORTANT: All data is relative to January 13, 2020. This data is NOT Seasonally Adjusted. People walk and drive more when the weather is nice, so I'm just using the transit data.
According to the Apple data directions requests, public transit in the 7 day average for the US is at 78% of the January 2020 level and moving up.
Here is some interesting data on New York subway usage (HT BR).
 This graph is from Todd W Schneider. This is weekly data since 2015.
 Most weeks are between 30 and 35 million entries, and currently there more than 11 million subway turnstile entries per week - and increasing.
This data is through Friday, May 21st.
Schneider has graphs for each borough, and links to all the data sources.
He notes: "Data updates weekly from the MTA’s public turnstile data, usually on Saturday mornings".
This data is through Friday, May 21st.
Schneider has graphs for each borough, and links to all the data sources.
He notes: "Data updates weekly from the MTA’s public turnstile data, usually on Saturday mornings".
Sunday, May 23, 2021
Sunday Night Futures
by Calculated Risk on 5/23/2021 07:00:00 PM
Weekend:
• Schedule for Week of May 23, 2021
Monday:
• At 8:30 AM ET, Chicago Fed National Activity Index for April. This is a composite index of other data.
From CNBC: Pre-Market Data and Bloomberg futures S&P 500 and DOW futures are mostly unchanged (fair value).
Oil prices were down over the last week with WTI futures at $63.73 per barrel and Brent at $66.55 per barrel. A year ago, WTI was at $33, and Brent was at $34 - so WTI oil prices are UP almost double year-over-year (oil prices collapsed at the beginning of the pandemic).
Here is a graph from Gasbuddy.com for nationwide gasoline prices. Nationally prices are at $3.03 per gallon. A year ago prices were at $1.95 per gallon, so gasoline prices are up $1.08 per gallon year-over-year.
May 23rd COVID-19 New Cases, Hospitalizations, Vaccinations
by Calculated Risk on 5/23/2021 04:27:00 PM
From Dr. Bob Wachter, Chair, UCSF Dept of Medicine today:
In case anyone cares, I've started eating indoors in SF restaurants. It wasn't any one thing; the risk just fell below my personal threshold: 2/3rds of SF adults fully vaxxed; avg 16 new cases/d in SF, asymptomatic test + @UCSF now 0.16% (ie, 1/600). Plus too cold to eat outside.The economy will pick up speed as more and more people get vaccinated!
According to the CDC, on Vaccinations. Total administered: 285,720,586, as of yesterday 283,941,223. Day: 1.78 million. (U.S. Capacity is around 4 million per day)
1) 61.3% of the population over 18 has had at least one dose (70% is the goal by July 4th).
2) 130.0 million Americans are fully vaccinated (160 million goal by July 4th)
Note: I'll stop posting this daily once all four of these criteria are met:
1) 70% of the population over 18 has had at least one dose of vaccine, and
2) new cases are under 5,000 per day, and
3) hospitalizations are below 3,000, and
4) average daily deaths under 50 (currently 510 per day).
And check out COVID Act Now to see how each state is doing.
Almost 12,000 US deaths were reported so far in May due to COVID.
 Click on graph for larger image.
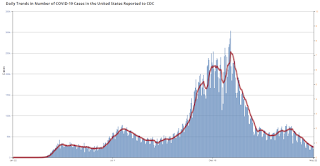
This graph shows the daily (columns) 7 day average (line) of positive tests reported.
This data is from the CDC.
 Click on graph for larger image.
This graph shows the daily (columns) 7 day average (line) of positive tests reported.
This data is from the CDC.
The 7-day average is 24,315, down from 25,315 yesterday, and down sharply from the recent peak of 69,881 on April 13, 2021. This is the lowest since June 15, 2020.
The second graph shows the number of people hospitalized.
 This data is also from the CDC.
The CDC cautions that due to reporting delays, the area in grey will probably increase.
The current 7-day average is 23,917, down from 24,720 reported yesterday, but still above the post-summer surge low of 23,000.
REALTORS® Confidence Index Survey April 2021
by Calculated Risk on 5/23/2021 10:41:00 AM
Some interesting information from the REALTORS® Confidence Index Survey April 2021
Several metrics indicates a very strong buyer market with short supply. The REALTORS® Buyer Traffic Index increased from 79 in March 2021 to 80 (very strong conditions) in April 2021 while the REALTORS® Seller Traffic Index remains below 50 which is “weak” traffic compared to the level one year ago. On average, a home sold had five offers. On average, REALTORS® expect home prices in the next three months to increase nearly 6% from one year ago and sales in the next three months to increase nearly 3% from last year’s sales level.
With little supply in the market, homes typically sold within 17 days (27 days one year ago), as buyer competition heats up.
The share of first-time buyers decreased to 31% (32% in the prior month, 36% one year ago).
emphasis added
 Click on graph for larger image.
This graph, from the NAR report, shows buyer traffic is strong just about everywhere.
DOT: Vehicle Miles Driven Increased Sharply year-over-year in March
by Calculated Risk on 5/23/2021 08:09:00 AM
This will be something to watch as the economy recovers.
The Department of Transportation (DOT) reported:
Travel on all roads and streets changed by 19.0% (42.0 billion vehicle miles) for March 2021 as compared with March 2020. Travel for the month is estimated to be 263.0 billion vehicle miles.
The seasonally adjusted vehicle miles traveled for March 2021 is 261.1 billion miles, an 18.5% (40.7 billion vehicle miles) increase over March 2020. It also represents a 6.2% increase (15.2 billion vehicle miles) compared with February 2021.
Cumulative Travel for 2021 changed by -2.1% (-14.9 billion vehicle miles). The cumulative estimate for the year is 691.5 billion vehicle miles of travel.
emphasis added
 Click on graph for larger image.
This graph shows the monthly total vehicle miles driven, seasonally adjusted.
Miles driven declined sharply in March 2020, and really collapsed in April. After partially recovering fairly quickly, miles driven was mostly flat for 6+ months - but really picked up in March 2021.
Saturday, May 22, 2021
May 22nd COVID-19 New Cases, Hospitalizations, Vaccinations
by Calculated Risk on 5/22/2021 07:04:00 PM
The economic recovery depends on progress against the virus, so I'm tracking the progress.
KUDOS to all who are vaccinated! You are part of the solution and helping the economy. Thank you!
According to the CDC, on Vaccinations. Total administered: 283,941,223, as of yesterday 281,595,351. Day: 2.35 million. (U.S. Capacity is around 4 million per day)
1) 61.1% of the population over 18 has had at least one dose (70% is the goal by July 4th).
2) 129.0 million Americans are fully vaccinated (160 million goal by July 4th)
Note: I'll stop posting this daily once all four of these criteria are met:
1) 70% of the population over 18 has had at least one dose of vaccine, and
2) new cases are under 5,000 per day, and
3) hospitalizations are below 3,000, and
4) average daily deaths under 50 (currently 504 per day).
And check out COVID Act Now to see how each state is doing.
Almost 11,500 US deaths were reported so far in May due to COVID.
 Click on graph for larger image.
This graph shows the daily (columns) 7 day average (line) of positive tests reported.
This data is from the CDC.
 Click on graph for larger image.
This graph shows the daily (columns) 7 day average (line) of positive tests reported.
This data is from the CDC.
The 7-day average is 25,315, down from 26,362 yesterday, and down sharply from the recent peak of 69,881 on April 13, 2021. This is the lowest since June 15, 2020.
The second graph shows the number of people hospitalized.
 This data is also from the CDC.
The CDC cautions that due to reporting delays, the area in grey will probably increase.
The current 7-day average is 24,720, down from 25,313 reported yesterday, but still above the post-summer surge low of 23,000.
Schedule for Week of May 23, 2021
by Calculated Risk on 5/22/2021 08:11:00 AM
The key reports this week are the second estimate of Q1 GDP, April New Home Sales, March Case-Shiller house prices, and Personal Income and Outlays for April.
For manufacturing, the May Richmond and Kansas City Fed manufacturing surveys will be released.
8:30 AM ET: Chicago Fed National Activity Index for April. This is a composite index of other data.
 9:00 AM: S&P/Case-Shiller House Price Index for March.
This graph shows the year-over-year change in the seasonally adjusted National Index, Composite 10 and Composite 20 indexes through the most recent report (the Composite 20 was started in January 2000).
The consensus is for a 12.3% year-over-year increase in the Comp 20 index for March.
9:00 AM: FHFA House Price Index for March 2021. This was originally a GSE only repeat sales, however there is also an expanded index.
 10:00 AM: New Home Sales for April from the Census Bureau.
 This graph shows New Home Sales since 1963. The dashed line is the sales rate for last month.
The consensus is for 975 thousand SAAR, down from 1.021 million SAAR in March.
10:00 AM: Richmond Fed Survey of Manufacturing Activity for May.
7:00 AM ET: The Mortgage Bankers Association (MBA) will release the results for the mortgage purchase applications index.
8:30 AM: The initial weekly unemployment claims report will be released. The consensus is for a decrease to 420 thousand from 444 thousand last week.
8:30 AM: Gross Domestic Product, 1st quarter 2021 (Second estimate). The consensus is that real GDP increased 6.5% annualized in Q1, up from the advance estimate of 6.4%.
8:30 AM: Durable Goods Orders for April from the Census Bureau. The consensus is for a 0.8% increase in durable goods orders.
10:00 AM: Pending Home Sales Index for April. The consensus is for a 1.2% increase in the index.
11:00 AM: the Kansas City Fed manufacturing survey for May.
8:30 AM ET: Personal Income and Outlays, April 2021. The consensus is for a 14.8% decrease in personal income, and for a 0.5% increase in personal spending. And for the Core PCE price index to increase 0.6%.
9:45 AM: Chicago Purchasing Managers Index for May.
10:00 AM: University of Michigan's Consumer sentiment index (Final for May). The consensus is for a reading of 83.0.


