 RSS Feed
 by Calculated Risk on 5/17/2021 10:04:00 AM
Monday, May 17, 2021
NAHB: Builder Confidence Unchanged at 83 in May
The National Association of Home Builders (NAHB) reported the housing market index (HMI) was at 83, unchanged from 83 in April. Any number above 50 indicates that more builders view sales conditions as good than poor.
From the NAHB: Building Materials Top Housing Concerns
Builder confidence held stable in May, despite growing concerns over the price and availability of most building materials, including lumber. The latest NAHB/Wells Fargo Housing Market Index (HMI) released today shows that builder confidence in the market for newly built single-family homes is 83 in May, unchanged from April.
“Builder confidence in the market remains strong due to a lack of resale inventory, low mortgage interest rates, and a growing demographic of prospective home buyers,” said NAHB Chairman Chuck Fowke. “However, first-time and first-generation home buyers are particularly at risk for losing a purchase due to cost hikes associated with increasingly scarce material availability. Policymakers must take note and find ways to increase production of domestic building materials, including lumber and steel, and suspend tariffs on imports of construction materials.”
“Low interest rates are supporting housing affordability in a market where the cost of most materials is rising,” said NAHB Chief Economist Robert Dietz. “In recent months, aggregate residential construction material costs were up 12% year over year, and our surveys suggest those costs are rising further. Some builders are slowing sales to manage their own supply chains, which means growing affordability challenges for a market in critical need of more inventory.”
...
The HMI index gauging current sales conditions held steady at 88, and the gauge charting sales expectations in the next six months rose one point to 81. The component measuring traffic of prospective buyers fell one point to 73.
Looking at the three-month moving averages for regional HMI scores, the South rose one point to 84, and the West held steady at 90. The Northeast fell four points to 82, and the Midwest posted a three-point drop to 75.
 Click on graph for larger image.
This graph show the NAHB index since Jan 1985.
This was at the consensus forecast, and a very strong reading.
Housing and homebuilding have been one of the best performing sectors during the pandemic.
Seven High Frequency Indicators for the Economy
by Calculated Risk on 5/17/2021 08:40:00 AM
These indicators are mostly for travel and entertainment. It will interesting to watch these sectors recover as the vaccine is distributed.
IMPORTANT: Be safe now - if all goes well, everyone could be vaccinated by June.
----- Airlines: Transportation Security Administration -----
The TSA is providing daily travel numbers.
 Click on graph for larger image.
This data shows the seven day average of daily total traveler throughput from the TSA for 2019 (Light Blue), 2020 (Blue) and 2021 (Red).
The dashed line is the percent of 2019 for the seven day average.
This data is as of May 16th.
The seven day average is down 34.5% from the same day in 2019 (65.5% of 2019). (Dashed line)
There was a slow increase from the bottom - and TSA data has picked up in 2021.
----- Restaurants: OpenTable -----
The second graph shows the 7 day average of the year-over-year change in diners as tabulated by OpenTable for the US and several selected cities.
----- Hotel Occupancy: STR -----
 This graph shows the seasonal pattern for the hotel occupancy rate using the four week average.
The red line is for 2021, black is 2020, blue is the median, and dashed light blue is for 2009 (the worst year since the Great Depression for hotels - before 2020).
Occupancy is now slightly above the horrible 2009 levels.
This data is through May 8th. Hotel occupancy is currently down 17% compared to same week in 2019). Note: Occupancy was up year-over-year, since occupancy declined sharply at the onset of the pandemic. However, occupancy is still down significantly from normal levels.
Notes: Y-axis doesn't start at zero to better show the seasonal change.
----- Gasoline Supplied: Energy Information Administration -----
 This graph, based on weekly data from the U.S. Energy Information Administration (EIA), shows gasoline supplied compared to the same week of 2019.
Blue is for 2020. Red is for 2021.
As of May 7th, gasoline supplied was off about 3.8% (about 96.2% of the same week in 2019).
Gasoline supplied was up year-over-year, since at one point, gasoline supplied was off almost 50% YoY in 2020.
----- Transit: Apple Mobility -----
This graph is from Apple mobility. From Apple: "This data is generated by counting the number of requests made to Apple Maps for directions in select countries/regions, sub-regions, and cities." This is just a general guide - people that regularly commute probably don't ask for directions.
There is also some great data on mobility from the Dallas Fed Mobility and Engagement Index. However the index is set "relative to its weekday-specific average over January–February", and is not seasonally adjusted, so we can't tell if an increase in mobility is due to recovery or just the normal increase in the Spring and Summer.
 This data is through May 15th for the United States and several selected cities.
The graph is the running 7 day average to remove the impact of weekends.
IMPORTANT: All data is relative to January 13, 2020. This data is NOT Seasonally Adjusted. People walk and drive more when the weather is nice, so I'm just using the transit data.
According to the Apple data directions requests, public transit in the 7 day average for the US is at 74% of the January 2020 level and moving up.
----- New York City Subway Usage -----
Here is some interesting data on New York subway usage (HT BR).
 This graph is from Todd W Schneider. This is weekly data since 2015.
The TSA is providing daily travel numbers.
 Click on graph for larger image.
This data shows the seven day average of daily total traveler throughput from the TSA for 2019 (Light Blue), 2020 (Blue) and 2021 (Red).
The dashed line is the percent of 2019 for the seven day average.
This data is as of May 16th.
The seven day average is down 34.5% from the same day in 2019 (65.5% of 2019). (Dashed line)
There was a slow increase from the bottom - and TSA data has picked up in 2021.
The second graph shows the 7 day average of the year-over-year change in diners as tabulated by OpenTable for the US and several selected cities.
IMPORTANT: OpenTable notes: "we’ve updated the data including downloadable dataset from January 1, 2021 onward to compare seated diners from 2021 to 2019, as opposed to year over year." Thanks!
 Thanks to OpenTable for providing this restaurant data:
This data is updated through May 15, 2021.
This data is "a sample of restaurants on the OpenTable network across all channels: online reservations, phone reservations, and walk-ins. For year-over-year comparisons by day, we compare to the same day of the week from the same week in the previous year."
Note that this data is for "only the restaurants that have chosen to reopen in a given market". Since some restaurants have not reopened, the actual year-over-year decline is worse than shown.
Dining picked up during the holidays, then slumped with the huge winter surge in cases. Dining was picking up again. Florida and Texas are above 2019 levels.
----- Movie Tickets: Box Office Mojo -----
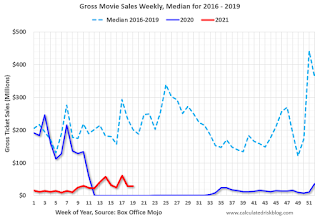 This data shows domestic box office for each week and the median for the years 2016 through 2019 (dashed light blue).
 Thanks to OpenTable for providing this restaurant data:
This data is updated through May 15, 2021.
This data is "a sample of restaurants on the OpenTable network across all channels: online reservations, phone reservations, and walk-ins. For year-over-year comparisons by day, we compare to the same day of the week from the same week in the previous year."
Note that this data is for "only the restaurants that have chosen to reopen in a given market". Since some restaurants have not reopened, the actual year-over-year decline is worse than shown.
Dining picked up during the holidays, then slumped with the huge winter surge in cases. Dining was picking up again. Florida and Texas are above 2019 levels.
 This data shows domestic box office for each week and the median for the years 2016 through 2019 (dashed light blue).
 Blue is 2020 and Red is 2021.
The data is from BoxOfficeMojo through May 13th.
Note that the data is usually noisy week-to-week and depends on when blockbusters are released.
Movie ticket sales were at $30 million last week, down about 85% from the median for the week.
Note that the data is usually noisy week-to-week and depends on when blockbusters are released.
Movie ticket sales were at $30 million last week, down about 85% from the median for the week.
 This graph shows the seasonal pattern for the hotel occupancy rate using the four week average.
 The red line is for 2021, black is 2020, blue is the median, and dashed light blue is for 2009 (the worst year since the Great Depression for hotels - before 2020).
Occupancy is now slightly above the horrible 2009 levels.
This data is through May 8th. Hotel occupancy is currently down 17% compared to same week in 2019). Note: Occupancy was up year-over-year, since occupancy declined sharply at the onset of the pandemic. However, occupancy is still down significantly from normal levels.
Notes: Y-axis doesn't start at zero to better show the seasonal change.
 This graph, based on weekly data from the U.S. Energy Information Administration (EIA), shows gasoline supplied compared to the same week of 2019.
Blue is for 2020. Red is for 2021.
As of May 7th, gasoline supplied was off about 3.8% (about 96.2% of the same week in 2019).
Gasoline supplied was up year-over-year, since at one point, gasoline supplied was off almost 50% YoY in 2020.
This graph is from Apple mobility. From Apple: "This data is generated by counting the number of requests made to Apple Maps for directions in select countries/regions, sub-regions, and cities." This is just a general guide - people that regularly commute probably don't ask for directions.
There is also some great data on mobility from the Dallas Fed Mobility and Engagement Index. However the index is set "relative to its weekday-specific average over January–February", and is not seasonally adjusted, so we can't tell if an increase in mobility is due to recovery or just the normal increase in the Spring and Summer.
 This data is through May 15th for the United States and several selected cities.
The graph is the running 7 day average to remove the impact of weekends.
IMPORTANT: All data is relative to January 13, 2020. This data is NOT Seasonally Adjusted. People walk and drive more when the weather is nice, so I'm just using the transit data.
According to the Apple data directions requests, public transit in the 7 day average for the US is at 74% of the January 2020 level and moving up.
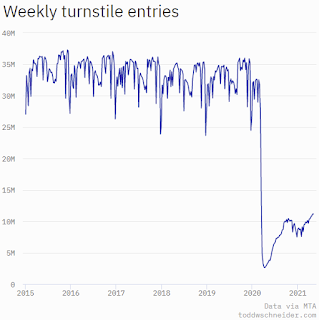
Here is some interesting data on New York subway usage (HT BR).
 This graph is from Todd W Schneider. This is weekly data since 2015.
 Most weeks are between 30 and 35 million entries, and currently there more than 11 million subway turnstile entries per week - and increasing.
This data is through Friday, May 14th.
Schneider has graphs for each borough, and links to all the data sources.
He notes: "Data updates weekly from the MTA’s public turnstile data, usually on Saturday mornings".
This data is through Friday, May 14th.
Schneider has graphs for each borough, and links to all the data sources.
He notes: "Data updates weekly from the MTA’s public turnstile data, usually on Saturday mornings".
Sunday, May 16, 2021
Monday: NY Fed Mfg, Homebuilder Survey
by Calculated Risk on 5/16/2021 11:50:00 PM
Weekend:
• Schedule for Week of May 16, 2021
• The Long and Winding Road
Monday:
• At 8:30 AM ET, The New York Fed Empire State manufacturing survey for May. The consensus is for a reading of 23.9, down from 26.3.
• At 10:00 AM, The May NAHB homebuilder survey. The consensus is for a reading of 83 unchanged from 83 last month . Any number above 50 indicates that more builders view sales conditions as good than poor.
From CNBC: Pre-Market Data and Bloomberg futures S&P 500 are down 10, and DOW futures are down 100 (fair value).
Oil prices were mostly unchanged over the last week with WTI futures at $65.55 per barrel and Brent at $68.88 per barrel. A year ago, WTI was at $29, and Brent was at $31 - so WTI oil prices are UP sharply year-over-year (oil prices collapsed at the beginning of the pandemic).
Here is a graph from Gasbuddy.com for nationwide gasoline prices. Nationally prices are at $3.04 per gallon. A year ago prices were at $1.86 per gallon, so gasoline prices are up $1.17 per gallon year-over-year.
May 16th COVID-19 New Cases, Hospitalizations, Vaccinations
by Calculated Risk on 5/16/2021 03:56:00 PM
Personal comment: At the recent pace of improvement, it is possible to achieve all 3 of my criteria before July 4th. Hopefully everyone is part of the solution and is getting vaccinated!
According to the CDC, on Vaccinations. Total administered: 273,545,207, as of yesterday 270,832,342. Day: 2.71 million. (U.S. Capacity is around 4 million per day)
1) 59.8% of the population over 18 has had at least one dose (70% goal by July 4th).
2) 123.3 million Americans are fully vaccinated (160 million goal by July 4th)
Note: I'll stop posting this daily once all three of these criteria are met:
1) 70% of the population over 18 has had at least one dose of vaccine, and
2) new cases are under 5,000 per day, and
3) hospitalizations are below 3,000.
And check out COVID Act Now to see how each state is doing.
Almost 9,000 US deaths were reported so far in May due to COVID.
 Click on graph for larger image.
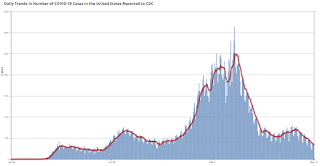
This graph shows the daily (columns) 7 day average (line) of positive tests reported.
This data is from the CDC.
 Click on graph for larger image.
This graph shows the daily (columns) 7 day average (line) of positive tests reported.
This data is from the CDC.
The 7-day average is 31,524, down from 32,888 yesterday, and down sharply from the recent peak of 69,881 on April 13, 2021. This is the lowest since June 23, 2020.
The second graph shows the number of people hospitalized.
 This data is also from the CDC.
The CDC cautions that due to reporting delays, the area in grey will probably increase.
The current 7-day average is 27,992, down from 29,024 reported yesterday, but still above the post-summer surge low of 23,000.
The Long and Winding Road
by Calculated Risk on 5/16/2021 11:34:00 AM
This is the 17th year I've been writing this blog.
Starting in January 2005, I was very bearish on housing - and in early 2007, I predicted a recession.
However in 2009 I became more optimistic. For example, in February 2009, I wrote: Looking for the Sun (Note: that post shocked many readers since I had been very bearish).
A few years later, in early 2012, when many people were still bearish on housing, I called the bottom for housing: The Housing Bottom is Here
Then I spent a number of years arguing against the recession callers, and the new housing bubble calls. A few examples:
In 2015, I wrote The Endless Parade of Recession Calls
And on housing, over three years ago, in January 2018, I was quoted in a Bloomberg article:
For the last 6+ years, there have been an endless parade of incorrect recession calls. The most reported was probably the multiple recession calls from ECRI in 2011 and 2012.And I updated that post several times, most recently in 2019
...
I disagreed with that call in 2011; I wasn't even on recession watch!
And on housing, over three years ago, in January 2018, I was quoted in a Bloomberg article:
Bill McBride, who runs the Calculated Risk blog and also called the crash, doesn’t think home prices are inflated this time around. Unlike in 2005, lenders are acting responsibly and the Wild West of real estate speculation hasn’t returned, he said. There is less to speculate on, too. Compared with the overbuilding that preceded the bust, today’s pace of construction isn’t fast enough, he said.
“Lending standards are still pretty good,” McBride said, and he doesn’t expect mortgage rates to “take off” in the short term.
No big deal, and definitely not a "gigantic" boom in house prices.And last month I wrote: Is there a New Housing Bubble?
The lack of wild speculation doesn't mean house prices can't decline, but it means that we won't see cascading declines in prices like what happened when the housing bubble burst.No one has a crystal ball, but one thing I've learned over the years is to watch housing inventory. And it is my sense that Existing Home Inventory Might Have Bottomed. If inventory has bottomed, then the question will be: How quickly will inventory increase? I don't have an answer yet, but if inventory increases slowly, house prices will continue to rise rapidly, and if inventory increases sharply, house price growth will slow.
...
From a historical perspective, house prices are high. But lending standards have been solid, and we haven't seen significant speculation - so I wouldn't call this a bubble.
Stay tuned!
Saturday, May 15, 2021
May 15th COVID-19 New Cases, Hospitalizations, Vaccinations
by Calculated Risk on 5/15/2021 04:57:00 PM
Personal comment: At the recent pace of improvement, it is possible to achieve all 3 of my criteria before July 4th. Hopefully everyone is part of the solution and is getting vaccinated!
According to the CDC, on Vaccinations. Total administered: 270,832,342, as of yesterday 268,438,666. Day: 2.39 million. (U.S. Capacity is around 4 million per day)
1) 59.4% of the population over 18 has had at least one dose (70% goal by July 4th).
2) 121.8 million Americans are fully vaccinated (160 million goal by July 4th)
Note: I'll stop posting this daily once all three of these criteria are met:
1) 70% of the population over 18 has had at least one dose of vaccine, and
2) new cases are under 5,000 per day, and
3) hospitalizations are below 3,000.
And check out COVID Act Now to see how each state is doing.
Over 8,500 US deaths were reported so far in May due to COVID.
 Click on graph for larger image.
This graph shows the daily (columns) 7 day average (line) of positive tests reported.
This data is from the CDC.
 Click on graph for larger image.
This graph shows the daily (columns) 7 day average (line) of positive tests reported.
This data is from the CDC.
The 7-day average is 33,228, down from 34,396 yesterday, and down sharply from the recent peak of 69,881 on April 13, 2021. This is the lowest since June 24, 2020.
The second graph shows the number of people hospitalized.
 This data is also from the CDC.
The CDC cautions that due to reporting delays, the area in grey will probably increase.
The current 7-day average is 29,024, down from 29,588, reported yesterday, but still above the post-summer surge low of 23,000.
Schedule for Week of May 16, 2021
by Calculated Risk on 5/15/2021 08:11:00 AM
The key reports this week are April Housing Starts and Existing Home Sales.
For manufacturing, the May NY and Philly Fed manufacturing surveys will be released.
8:30 AM: The New York Fed Empire State manufacturing survey for May. The consensus is for a reading of 23.9, down from 26.3.
10:00 AM: The May NAHB homebuilder survey. The consensus is for a reading of 83 unchanged from 83 last month . Any number above 50 indicates that more builders view sales conditions as good than poor.
 8:30 AM ET: Housing Starts for April.
 This graph shows single and total housing starts since 1968.
The consensus is for 1.710 million SAAR, down from 1.739 million SAAR in March.
7:00 AM ET: The Mortgage Bankers Association (MBA) will release the results for the mortgage purchase applications index.
During the day: The AIA's Architecture Billings Index for April (a leading indicator for commercial real estate).
2:00 PM: FOMC Minutes, Meeting of April 27-28, 2021
8:30 AM: The initial weekly unemployment claims report will be released. The consensus is for a decrease to 460 thousand from 473 thousand last week.
8:30 AM: the Philly Fed manufacturing survey for May. The consensus is for a reading of 43.2, down from 50.2.
 10:00 AM: Existing Home Sales for April from the National Association of Realtors (NAR). The consensus is for 6.09 million SAAR, up from 6.01 million.
The graph shows existing home sales from 1994 through the report last month.
10:00 AM: State Employment and Unemployment (Monthly) for April 2021
Friday, May 14, 2021
Fannie and Freddie: REO inventory declined in Q1, Down 58% Year-over-year
by Calculated Risk on 5/14/2021 05:19:00 PM
Fannie and Freddie earlier reported results two weeks ago for Q1 2021. Here is some information on Real Estate Owned (REOs).
Note that COVID is impacting foreclosure activity, from Freddie: "The volume of foreclosures declined significantly, year-over-year, primarily due to the foreclosure moratorium that will remain in effect through June 30, 2021." emphasis added
Freddie Mac reported the number of REO declined to 1,604 at the end of Q1 2021 compared to 4,168 at the end of Q1 2020.
For Freddie, this is down 98% from the 74,897 peak number of REOs in Q3 2010.
Fannie Mae reported the number of REO declined to 6,918 at the end of Q1 2021 compared to 16,289 at the end of Q1 2020.
For Fannie, this is down 96% from the 166,787 peak number of REOs in Q3 2010.
 Click on graph for larger image.
Here is a graph of Fannie and Freddie Real Estate Owned (REO).
REO inventory decreased in Q1 2021, and combined inventory is down 58% year-over-year.
This is well below a normal level of REOs for Fannie and Freddie.
May 14th COVID-19 New Cases, Hospitalizations; 7-Day Average Cases Lowest Since June 25, 2020
by Calculated Risk on 5/14/2021 04:28:00 PM
Personal comment: At the recent pace of improvement, it is possible to achieve all 3 of my criteria before July 4th. Hopefully everyone is part of the solution and is getting vaccinated!
According to the CDC, on Vaccinations. Total administered: 268,438,666, as of yesterday: 266,596,486. Day: 1.84 million. (U.S. Capacity is around 4 million per day)
1) 59.1% of the population over 18 has had at least one dose (70% goal by July 4th).
2) 120.3 million Americans are fully vaccinated (160 million goal by July 4th)
Note: I'll stop posting this daily once all three of these criteria are met:
1) 70% of the population over 18 has had at least one dose of vaccine, and
2) new cases are under 5,000 per day, and
3) hospitalizations are below 3,000.
And check out COVID Act Now to see how each state is doing.
Almost 8,000 US deaths were reported so far in May due to COVID.
 Click on graph for larger image.
This graph shows the daily (columns) 7 day average (line) of positive tests reported.
This data is from the CDC.
 Click on graph for larger image.
This graph shows the daily (columns) 7 day average (line) of positive tests reported.
This data is from the CDC.
The 7-day average is 34,369, down from 35,474 yesterday, and down sharply from the recent peak of 69,881 on April 13, 2021. This is the lowest since June 25, 2020.
The second graph shows the number of people hospitalized.
 This data is also from the CDC.
The CDC cautions that due to reporting delays, the area in grey will probably increase.
The current 7-day average is 29,588, down from 30,244 reported yesterday, but still above the post-summer surge low of 23,000.
LA Area Port Traffic: Strong Imports in April
by Calculated Risk on 5/14/2021 01:33:00 PM
Note1: Import traffic was heavy in February and March - ships were backed up waiting to unload in LA. "some vessels are spending almost as much time at anchor as it takes to traverse the Pacific Ocean." They were still backed up in April!
Note2: The expansion to the Panama Canal was completed in 2016 (As I noted a few years ago), and some of the traffic that used the ports of Los Angeles and Long Beach is probably going through the canal. This might be impacting TEUs on the West Coast.
Container traffic gives us an idea about the volume of goods being exported and imported - and usually some hints about the trade report since LA area ports handle about 40% of the nation's container port traffic.
The following graphs are for inbound and outbound traffic at the ports of Los Angeles and Long Beach in TEUs (TEUs: 20-foot equivalent units or 20-foot-long cargo container).
To remove the strong seasonal component for inbound traffic, the first graph shows the rolling 12 month average.
 Click on graph for larger image.
On a rolling 12 month basis, inbound traffic was up 2.4% in April compared to the rolling 12 months ending in March. Outbound traffic was up 0.2% compared to the rolling 12 months ending the previous month.
The 2nd graph is the monthly data (with a strong seasonal pattern for imports).
 Usually imports peak in the July to October period as retailers import goods for the Christmas holiday, and then decline sharply and bottom in February or March depending on the timing of the Chinese New Year.
2021 has started off incredibly strong for imports.
Imports were up 37% YoY in April (collapsed last year due to pandemic), and exports were up 2.5% YoY.
Imports were up 37% YoY in April (collapsed last year due to pandemic), and exports were up 2.5% YoY.


