 RSS Feed
 by Calculated Risk on 5/14/2021 04:28:00 PM
Friday, May 14, 2021
May 14th COVID-19 New Cases, Hospitalizations; 7-Day Average Cases Lowest Since June 25, 2020
Personal comment: At the recent pace of improvement, it is possible to achieve all 3 of my criteria before July 4th. Hopefully everyone is part of the solution and is getting vaccinated!
According to the CDC, on Vaccinations. Total administered: 268,438,666, as of yesterday: 266,596,486. Day: 1.84 million. (U.S. Capacity is around 4 million per day)
1) 59.1% of the population over 18 has had at least one dose (70% goal by July 4th).
2) 120.3 million Americans are fully vaccinated (160 million goal by July 4th)
Note: I'll stop posting this daily once all three of these criteria are met:
1) 70% of the population over 18 has had at least one dose of vaccine, and
2) new cases are under 5,000 per day, and
3) hospitalizations are below 3,000.
And check out COVID Act Now to see how each state is doing.
Almost 8,000 US deaths were reported so far in May due to COVID.
 Click on graph for larger image.
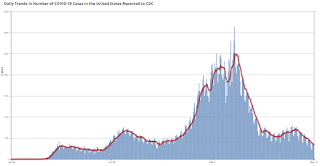
This graph shows the daily (columns) 7 day average (line) of positive tests reported.
This data is from the CDC.
 Click on graph for larger image.
This graph shows the daily (columns) 7 day average (line) of positive tests reported.
This data is from the CDC.
The 7-day average is 34,369, down from 35,474 yesterday, and down sharply from the recent peak of 69,881 on April 13, 2021. This is the lowest since June 25, 2020.
The second graph shows the number of people hospitalized.
 This data is also from the CDC.
The CDC cautions that due to reporting delays, the area in grey will probably increase.
The current 7-day average is 29,588, down from 30,244 reported yesterday, but still above the post-summer surge low of 23,000.
LA Area Port Traffic: Strong Imports in April
by Calculated Risk on 5/14/2021 01:33:00 PM
Note1: Import traffic was heavy in February and March - ships were backed up waiting to unload in LA. "some vessels are spending almost as much time at anchor as it takes to traverse the Pacific Ocean." They were still backed up in April!
Note2: The expansion to the Panama Canal was completed in 2016 (As I noted a few years ago), and some of the traffic that used the ports of Los Angeles and Long Beach is probably going through the canal. This might be impacting TEUs on the West Coast.
Container traffic gives us an idea about the volume of goods being exported and imported - and usually some hints about the trade report since LA area ports handle about 40% of the nation's container port traffic.
The following graphs are for inbound and outbound traffic at the ports of Los Angeles and Long Beach in TEUs (TEUs: 20-foot equivalent units or 20-foot-long cargo container).
To remove the strong seasonal component for inbound traffic, the first graph shows the rolling 12 month average.
 Click on graph for larger image.
On a rolling 12 month basis, inbound traffic was up 2.4% in April compared to the rolling 12 months ending in March. Outbound traffic was up 0.2% compared to the rolling 12 months ending the previous month.
The 2nd graph is the monthly data (with a strong seasonal pattern for imports).
 Usually imports peak in the July to October period as retailers import goods for the Christmas holiday, and then decline sharply and bottom in February or March depending on the timing of the Chinese New Year.
2021 has started off incredibly strong for imports.
Imports were up 37% YoY in April (collapsed last year due to pandemic), and exports were up 2.5% YoY.
Imports were up 37% YoY in April (collapsed last year due to pandemic), and exports were up 2.5% YoY.
Q2 GDP Forecasts: Around 10%
by Calculated Risk on 5/14/2021 12:03:00 PM
From Merrill Lynch:
We look for growth of 10.0% qoq saar in 2Q. [May 14 estimate]From Goldman Sachs:
emphasis added
We left our Q2 GDP tracking estimate unchanged at +10.5% (qoq ar). [May 14 estimate]From the NY Fed Nowcasting Report
The New York Fed Staff Nowcast stands at 4.9% for 2021:Q2. [May 14 estimate]And from the Altanta Fed: GDPNow
The GDPNow model estimate for real GDP growth (seasonally adjusted annual rate) in the second quarter of 2021 is 10.5 percent on May 14, down from 11.0 percent on May 7. [May 14 estimate]
Black Knight: Number of Homeowners in COVID-19-Related Forbearance Plans Decreased
by Calculated Risk on 5/14/2021 10:50:00 AM
Note: Both Black Knight and the MBA (Mortgage Bankers Association) are putting out weekly estimates of mortgages in forbearance.
This data is as of May 11th.
From Black Knight: Forbearance Volumes Continue to Decline
We saw another week of good news in terms of forbearance volumes, which fell by 61,000 (-2.7%), continuing the strong trend of early-in-the-month improvements. Declines were seen across the board this week, with GSE forbearance volumes falling by 13K (-1.9%), FHA/VA plan volumes improving by 19K (-2.1%) and PLS/portfolio forbearances decreasing by 29K (-4.6%). Total plan starts are down 13% month-over-month, and continue to slowly decline.
Click on graph for larger image.
Some 250K plans are still listed with May 2021 expiration dates, which will provide a moderate opportunity for additional improvements over the next few weeks, and more acutely in early June. Another 860K plans are currently slated for review for extension/removal next month, the final quarterly review before early forbearance entrants begin to reach their 18-month plan expirations later this year. Thirty-eight percent of loans reviewed for extension/removal over the past month have been removed from forbearance, the highest such removal rate since mid-February
As of May 11, 2.16 million (4.1% of) homeowners remain in COVID-19 related forbearance plans, including 2.5% of GSE loans, 7.3% of FHA/VA loans, and 4.6% of portfolio/PLS loans.
emphasis added

Industrial Production Increased 0.7 Percent in April
by Calculated Risk on 5/14/2021 09:22:00 AM
From the Fed: Industrial Production and Capacity Utilization
Total industrial production increased 0.7 percent in April. The indexes for mining and utilities increased 0.7 percent and 2.6 percent, respectively; the index for manufacturing rose 0.4 percent despite a drop in motor vehicle assemblies that principally resulted from shortages of semiconductors. An important contributor to the gain in factory output was the return to operation of plants that were damaged by February's severe weather in the south central region of the country and had remained offline in March. The weather-induced drop in total industrial production in February and the subsequent rebound in March are now estimated to have been larger than reported last month.
At 106.3 percent of its 2012 average in April, total industrial production has moved up 16.5 percent from its level in April 2020 (the trough of the pandemic), but it was 2.7 percent below its pre-pandemic (February 2020) level. Capacity utilization for the industrial sector rose 0.5 percentage point in April to 74.9 percent, a rate that is 4.7 percentage points below its long-run (1972–2020) average.
emphasis added
 Click on graph for larger image.
This graph shows Capacity Utilization. This series is up from the record low set in April, but still below the level in February 2020.
Capacity utilization at 74.9% is 4.7% below the average from 1972 to 2020.
Note: y-axis doesn't start at zero to better show the change.
 The second graph shows industrial production since 1967.
Industrial production increased in April to 106.3. This is 2.7% below the February 2020 level.
The change in industrial production was below consensus expectations.
Retail Sales Unchanged in April
by Calculated Risk on 5/14/2021 08:43:00 AM
On a monthly basis, retail sales were unchanged from March to April (seasonally adjusted), and sales were up 51.2 percent from April 2020.
From the Census Bureau report:
Advance estimates of U.S. retail and food services sales for April 2021, adjusted for seasonal variation and holiday and trading-day differences, but not for price changes, were $619.9 billion, virtually unchanged from the previous month, and 51.2 percent above April 2020. ... The February 2021 to March 2021 percent change was revised from up 9.7 percent to up 10.7 percent.
emphasis added
 Click on graph for larger image.
This graph shows retail sales since 1992. This is monthly retail sales and food service, seasonally adjusted (total and ex-gasoline).
Retail sales ex-gasoline were up 0.1% in April.
The stimulus checks boosted retail sales significantly in March and April.
The second graph shows the year-over-year change in retail sales and food service (ex-gasoline) since 1993.
 Retail and Food service sales, ex-gasoline, increased by 49.5% on a YoY basis.
Sales in April were slightly below expectations, however sales in March were revised up (February was revised down).
Thursday, May 13, 2021
Friday: Retail Sales, Industrial Production
by Calculated Risk on 5/13/2021 09:00:00 PM
Friday:
• At 8:30 AM ET, Retail sales for April is scheduled to be released. The consensus is for 1.0% increase in retail sales.
• At 9:15 AM, The Fed will release Industrial Production and Capacity Utilization for April. The consensus is for a 1.2% increase in Industrial Production, and for Capacity Utilization to increase to 75.2%.
• At 10:00 AM, University of Michigan's Consumer sentiment index (Preliminary for May).
May 13th COVID-19 New Cases, Hospitalizations
by Calculated Risk on 5/13/2021 05:27:00 PM
"If you’ve been fully vaccinated: You can resume activities that you did prior to the pandemic. You can resume activities without wearing a mask or staying 6 feet apart, except where required by federal, state, local, tribal, or territorial laws, rules, and regulations, including local business and workplace guidance."Get vaccinated!
According to the CDC, on Vaccinations. Total administered: 266,596,486, as of yesterday: 264,680,844. Day: 1.92 million. (U.S. Capacity is around 4 million per day)
1) 58.9% of the population over 18 has had at least one dose (70% goal by July 4th).
2) 119.0 million Americans are fully vaccinated (160 million goal by July 4th)
Note: I'll stop posting this daily once all three of these criteria are met:
1) 70% of the population over 18 has had at least one dose of vaccine, and
2) new cases are under 5,000 per day, and
3) hospitalizations are below 3,000.
And check out COVID Act Now to see how each state is doing.
Over 7,000 US deaths were reported so far in May due to COVID.
 Click on graph for larger image.
This graph shows the daily (columns) 7 day average (line) of positive tests reported.
This data is from the CDC.
 Click on graph for larger image.
This graph shows the daily (columns) 7 day average (line) of positive tests reported.
This data is from the CDC.
The 7-day average is 35,442, down from 36,853 yesterday, and down sharply from the recent peak of 69,881 on April 13, 2021. This is the lowest since September 13, 2020, but still above the post-summer surge low of 34,668.
The second graph shows the number of people hospitalized.
 This data is also from the CDC.
The CDC cautions that due to reporting delays, the area in grey will probably increase.
The current 7-day average is 30,244, down from 30,718 reported yesterday, but still above the post-summer surge low of 23,000.
Existing Home Inventory Might Have Bottomed
by Calculated Risk on 5/13/2021 04:04:00 PM
I'm gathering existing home data for many local markets, and I'm watching inventory very closely this year.
As I noted in Some thoughts on Housing Inventory
The key for housing in 2021 will be inventory. If inventory stays extremely low, there will be more housing starts and a larger increase in house prices. However, if inventory increases significantly, there will be fewer starts and less price appreciation.The table below shows some early data for April.
Although inventory in these areas is down about 56% year-over-year, inventory is up month-to-month in most areas, and up 3.1% in total compared to March.
It is still early, but existing home inventory might have bottomed in March.
| Existing Home Inventory | |||||
|---|---|---|---|---|---|
| Apr-21 | Mar-21 | Apr-20 | YoY | MoM | |
| Atlanta | 6,964 | 7,418 | 19,697 | -64.6% | -6.1% |
| Boston | 3,788 | 3,201 | 3,467 | 9.3% | 18.3% |
| Colorado | 7,872 | 6,732 | 23,106 | -65.9% | 16.9% |
| Denver | 2,594 | 1,921 | 6,855 | -62.2% | 35.0% |
| Houston | 22,794 | 22,602 | 39,906 | -42.9% | 0.8% |
| Las Vegas | 2,346 | 2,369 | 7,815 | -70.0% | -1.0% |
| Maryland | 7,167 | 6,202 | 18,563 | -61.4% | 15.6% |
| New Hampshire | 1,852 | 1,576 | 4,295 | -56.9% | 17.5% |
| North Texas | 8,084 | 8,123 | 23,046 | -64.9% | -0.5% |
| Portland | 2,222 | 1,943 | 4,757 | -53.3% | 14.4% |
| Sacramento | 1,006 | 918 | 1,823 | -44.8% | 9.6% |
| South Carolina | 12,019 | 12,754 | 27,024 | -55.5% | -5.8% |
| Total1 | 76,114 | 73,838 | 173,499 | -56.1% | 3.1% |
| 1excluding Denver (included in Colorado) | |||||
Sacramento Real Estate in April: Sales up 52% YoY, Active Inventory down 45% YoY
by Calculated Risk on 5/13/2021 01:03:00 PM
Note: I'm tracking data for many local markets around the U.S. I think it is especially important to watch inventory this year. Remember sales were weak in April 2020 due to the pandemic, so the YoY sales comparison is easy.
From SacRealtor.org: County median sales price nears $490,000, sales volume up 19%
April ended with 1,540 sales, up 19.2% from the 1,292 sales in March. Compared to one year ago (1,013), the current figure is up 52%.
...
The Active Listing Inventory increased 9.6% from March to April, from 918 units to 1,006 units. Compared with April 2020 (1,823), inventory is down 44.8%. The Months of Inventory remained at .7 Months.
...
The Median DOM (days on market) remained at 6 and the Average DOM decreased from 13 to 11. “Days on market” represents the days between the initial listing of the home as “active” and the day it goes “pending.” Of the 1,540 sales this month, 93.4% (1,439) were on the market for 30 days or less and 97.2% (1,498) were on the market for 60 days or less.
emphasis added
 Click on graph for larger image.
This graph from the Sacramento Association of REALTORS® shows single family sales and inventory since March 2018. Usually inventory (red) was higher than sales (blue), but now there are more sales each month than inventory. Inventory declined sharply during the pandemic.
Note that inventory in April was up 9.6% from last month.


