 RSS Feed
 by Calculated Risk on 4/21/2021 04:20:00 PM
Wednesday, April 21, 2021
April 21st COVID-19 Vaccinations, New Cases, Hospitalizations
Note: I'm looking forward to not posting this daily! I've been posting this data daily for over a year, and I'll stop once all three of these criteria are met:
1) 70% of the population over 18 has had at least one dose of vaccine,
2) new cases are under 5,000 per day, and
3) hospitalizations are below 3,000.
According to the CDC, 216.0 million doses have been administered. 33.8% of the population over 18 is fully vaccinated, and 51.5% of the population over 18 has had at least one dose (133.0 million people over 18 have had at least one dose).
And check out COVID Act Now to see how each state is doing.
Almost 13,500 US deaths were reported so far in April due to COVID.
 Click on graph for larger image.
This graph shows the daily (columns) 7 day average (line) of positive tests reported.
Note: The ups and downs during the Winter surge were related to reporting delays due to the Thanksgiving and Christmas holidays.
This data is from the CDC.
 Click on graph for larger image.
This graph shows the daily (columns) 7 day average (line) of positive tests reported.
Note: The ups and downs during the Winter surge were related to reporting delays due to the Thanksgiving and Christmas holidays.
This data is from the CDC.
The 7-day average is 64,144, down from 66,824 yesterday, and below the summer surge peak of 67,337 on July 23, 2020.
The second graph shows the number of people hospitalized.
 This data is also from the CDC.
The CDC cautions that due to reporting delays, the area in grey will probably increase.
The second graph shows the number of people hospitalized.
 This data is also from the CDC.
The CDC cautions that due to reporting delays, the area in grey will probably increase.
The current 7-day average is 38,414, up from 38,185, reported yesterday, and well above the post-summer surge low of 23,000.
Philly Fed: State Coincident Indexes Increased in 49 States in March
by Calculated Risk on 4/21/2021 02:36:00 PM
From the Philly Fed:
The Federal Reserve Bank of Philadelphia has released the coincident indexes for the 50 states for March 2021. Over the past three months, the indexes increased in 49 states and decreased in one state, for a three-month diffusion index of 96. Additionally, in the past month, the indexes increased in 49 states and decreased in one state, for a one-month diffusion index of 96. For comparison purposes, the Philadelphia Fed has also developed a similar coincident index for the entire United States. The Philadelphia Fed’s U.S. index increased 1.6 percent over the past three months and 0.6 percent in March. .Note: These are coincident indexes constructed from state employment data. An explanation from the Philly Fed:
emphasis added
The coincident indexes combine four state-level indicators to summarize current economic conditions in a single statistic. The four state-level variables in each coincident index are nonfarm payroll employment, average hours worked in manufacturing by production workers, the unemployment rate, and wage and salary disbursements deflated by the consumer price index (U.S. city average). The trend for each state’s index is set to the trend of its gross domestic product (GDP), so long-term growth in the state’s index matches long-term growth in its GDP.
 Click on map for larger image.
Here is a map of the three month change in the Philly Fed state coincident indicators. This map was all red during the worst of the Pandemic and also at the worst of the Great Recession.
The map is almost all positive on a three month basis.
Source: Philly Fed.
 And here is a graph is of the number of states with one month increasing activity according to the Philly Fed.
 This graph includes states with minor increases (the Philly Fed lists as unchanged).
In March, 49 states had increasing activity.
In March, 49 states had increasing activity.
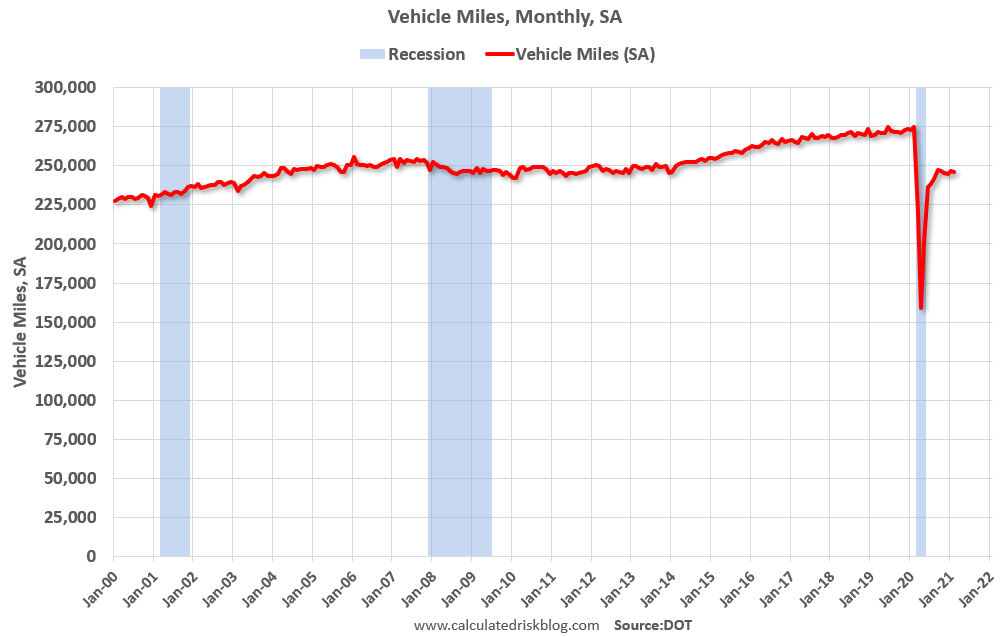
DOT: Vehicle Miles Driven decreased 10.6% year-over-year in February
by Calculated Risk on 4/21/2021 12:23:00 PM
This will be something to watch as the economy recovers.
The Department of Transportation (DOT) reported:
Travel on all roads and streets changed by -12.1% (-28.3 billion vehicle miles) for February 2021 as compared with February 2020. Travel for the month is estimated to be 205.4 billion vehicle miles.
The seasonally adjusted vehicle miles traveled for February 2021 is 245.9 billion miles, a -10.6% (-29.1 billion vehicle miles) decline from February 2020. It also represents -0.4% decline (-1.1 billion vehicle miles) compared with January 2021.
Cumulative Travel for 2021 changed by -11.7% (-56.7 billion vehicle miles). The cumulative estimate for the year is 428.7 billion vehicle miles of travel.
emphasis added
 Click on graph for larger image.
This graph shows the monthly total vehicle miles driven, seasonally adjusted.
Miles driven declined during the great recession, and the rolling 12 months stayed below the previous peak for a record 85 months.
Miles driven declined sharply in March, and really collapsed in April. After partially recovering fairly quickly, miles driven have been mostly flat for the last 6+ months.
AIA: "Demand for Architecture design services continues to rapidly escalate" in March
by Calculated Risk on 4/21/2021 10:37:00 AM
Note: This index is a leading indicator primarily for new Commercial Real Estate (CRE) investment.
From the AIA: Demand for design services continues to rapidly escalate
Strengthening to a score not seen since pre-Great Recession, the Architecture Billings Index (ABI) logged its second positive mark since the beginning of the pandemic, according to a new report today from The American Institute of Architects (AIA).
AIA’s ABI score for March rose to 55.6 compared to 53.3 in February (any score above 50 indicates an increase in billings). Scores for both new projects inquiries and new design contracts strengthened to 66.9 and 55.7 respectively. March also marked the first time in three years all building sectors and regions posted positive scores.
“As business activity at architecture firms moves sharply toward recovery, it is very encouraging to simultaneously see such positive indicators of future project work increasing in the pipeline,” said AIA Chief Economist, Kermit Baker, Hon. AIA, PhD. “The activity architecture firms are seeing is a positive bellwether not only for the construction outlook, but also for the larger economy.”
...
• Regional averages: Midwest (56.5); South (55.8); West (52.8); Northeast (50.8)
• Sector index breakdown: commercial/industrial (57.0); mixed practice (54.9); institutional (54.4); multi-family residential (52.6)
emphasis added
 Click on graph for larger image.
This graph shows the Architecture Billings Index since 1996. The index was at 55.6 in March, up from 53.3 in February. Anything above 50 indicates expansion in demand for architects' services.
Note: This includes commercial and industrial facilities like hotels and office buildings, multi-family residential, as well as schools, hospitals and other institutions.
This index had been below 50 for eleven consecutive months, but has been solidly positive for the last two months.
The eleven months of decline represented a significant decrease in design services, and suggests a decline in CRE investment through most of 2021 (This usually leads CRE investment by 9 to 12 months), however we might see a pickup in CRE investment towards the end of the 2021.
MBA: Mortgage Applications Increase in Latest Weekly Survey
by Calculated Risk on 4/21/2021 07:00:00 AM
From the MBA: Mortgage Applications Increase in Latest MBA Weekly Survey
Mortgage applications increased 8.6 percent from one week earlier, according to data from the Mortgage Bankers Association’s (MBA) Weekly Mortgage Applications Survey for the week ending April 16, 2021.
... The Refinance Index increased 10 percent from the previous week and was 23 percent lower than the same week one year ago. The seasonally adjusted Purchase Index increased 6 percent from one week earlier. The unadjusted Purchase Index increased 7 percent compared with the previous week and was 57 percent higher than the same week one year ago.
“Mortgage rates dropped to their lowest levels in around two months, prompting a small resurgence in refinance activity after six weeks of declines. Borrowers acted on the decrease in rates for most loan types, with both conventional and government refinance applications showing gains,” said Joel Kan, MBA’s Associate Vice President of Economic and Industry Forecasting. “The spring housing market also saw a boost from lower rates, with purchase applications – driven by a jump in conventional applications – increasing over 5 percent. MBA expects the purchase market to remain strong, with the recovering job market and supportive demographics fueling housing demand in the months ahead.”
Added Kan, “The average loan size for purchase applications increased after a few weeks of declines, as fewer homes available for sale make for a competitive buying market that is accelerating home-price growth.”
...
The average contract interest rate for 30-year fixed-rate mortgages with conforming loan balances ($548,250 or less) decreased to 3.20 percent from 3.27 percent, with points increasing to 0.36 from 0.33 (including the origination fee) for 80 percent loan-to-value ratio (LTV) loans.
emphasis added
 Click on graph for larger image.
The first graph shows the refinance index since 1990.
With low rates, the index remains elevated, but below recent levels since mortgage rates have moved up from the record lows.
The second graph shows the MBA mortgage purchase index
 According to the MBA, purchase activity is up 57% year-over-year unadjusted.
Note: Until the 2nd half of May, the MBA index will be up sharply year-over-year since purchase activity collapsed in late March 2020 in the early weeks of the pandemic.
Note: Red is a four-week average (blue is weekly).
Tuesday, April 20, 2021
April 20th COVID-19 Vaccinations, New Cases, Hospitalizations
by Calculated Risk on 4/20/2021 07:38:00 PM
Note: I'm looking forward to not posting this daily! I've been posting this data daily for over a year, and I'll stop once all three of these criteria are met:
1) 70% of the population over 18 has had at least one dose of vaccine,
2) new cases are under 5,000 per day, and
3) hospitalizations are below 3,000.
According to the CDC, 213.4 million doses have been administered. 33.3% of the population over 18 is fully vaccinated, and 51.1% of the population over 18 has had at least one dose (131.9 million people over 18 have had at least one dose).
And check out COVID Act Now to see how each state is doing.
Almost 13,000 US deaths were reported so far in April due to COVID.
 Click on graph for larger image.
This graph shows the daily (columns) 7 day average (line) of positive tests reported.
Note: The ups and downs during the Winter surge were related to reporting delays due to the Thanksgiving and Christmas holidays.
This data is from the CDC.
 Click on graph for larger image.
This graph shows the daily (columns) 7 day average (line) of positive tests reported.
Note: The ups and downs during the Winter surge were related to reporting delays due to the Thanksgiving and Christmas holidays.
This data is from the CDC.
The 7-day average is 66,687, down from 68,602 yesterday, and close to the summer surge peak of 67,337 on July 23, 2020.
The second graph shows the number of people hospitalized.
 This data is also from the CDC.
The CDC cautions that due to reporting delays, the area in grey will probably increase.
The second graph shows the number of people hospitalized.
 This data is also from the CDC.
The CDC cautions that due to reporting delays, the area in grey will probably increase.
The current 7-day average is 38,185, up from 36,118, reported yesterday, and well above the post-summer surge low of 23,000.
Indiana Real Estate in March: Sales Down 3% YoY, Inventory Down 58% YoY
by Calculated Risk on 4/20/2021 06:48:00 PM
Note: I'm tracking data for many local markets around the U.S. I think it is especially important to watch inventory this year.
For for the entire state Indiana:
Closed sales in March 2021 were 7,181, down 3.0% from 7,401 in March 2020.
Active Listings in March 2021 were 5,898, down 57.6% from 13,916 in March 2020.
Months of Supply was 0.7 Months in March 2021, compared to 1.8 Months in March 2020.
Alabama Real Estate in March: Sales Up 23% YoY, Inventory Down 46% YoY
by Calculated Risk on 4/20/2021 05:57:00 PM
Note: I'm tracking data for many local markets around the U.S. I think it is especially important to watch inventory this year.
For the entire state of Alabama:
Closed sales in March 2021 were 7,024, up 23.4% from 5,690 in March 2020.
Active Listings in March 2021 were 9,721, down 46.4% from 18,122 in March 2020.
Months of Supply was 1.4 Months in March 2021, compared to 3.2 Months in March 2020.
The Upward Slope of Real House Prices
by Calculated Risk on 4/20/2021 12:52:00 PM
Many years ago, I wrote: The upward slope of Real House Prices. I argued that real house prices (adjusted for inflation) had typically increased about 1.0% to 1.5% per year (much higher than Professor Shiller's estimate of 0.2%).
In 2012, housing economist Tom Lawler dug through some data and calculated that real prices increased 0.83% per year (See: Lawler: On the upward trend in Real House Prices)
In my previous posts, I tracked the bottom of real prices over time. This graph shows the peaks over time (the trend lines are 0.83% and 1.1%).
 Click on graph for larger image.
This graph shows there have been four surges in real prices since the early '70s. One in the late '70s, one in the late '80s, the housing bubble, and the current surge in prices.
It is important to note that nationally nominal house prices did not decline following the surges in the '70s and '80s. However, there were regional declines.
Since homeowners are concerned about nominal prices (not real prices), I wasn't concerned in December 2018, when Professor Shiller wrote in the NY Times: The Housing Boom Is Already Gigantic. How Long Can It Last?
Here were my comments on Shiller's article in 2018:
Since I wrote that post in 2018, house prices have increased 16% nationally (from November 2018 to January 2021) according to the Case-Shiller index. Prices in Phoenix are up 25%, and in Seattle and San Diego, up about 20% since that Shiller article was written.During the housing bubble, the difference between a slight upward slope in real prices (0.2% per year according to Shiller's index) and a slightly larger increase in real prices using other indexes (probably between 1% and 1.5% per year) didn't make any difference; there was obviously a huge bubble in house prices. But when comparing price "booms" over time, there is a huge difference.
If we use 1.5% per year for real price increases, the current "boom" in prices would be the fourth largest since the 1970s (and only about half the size of the late '70s and late '80s price boom), and if we use a 1.0% real increase, the current "boom" is on the same order as the late '70s and '80s price booms.
No big deal, and definitely not a "gigantic" boom in house prices.
And prices have increased quickly over the last few months.
Now, I'd argue house prices are too high based on historical real prices. Prices are also too high based on price-to-rent measures, and price-to-income.
I wouldn't call this a "bubble" because of the lack of both speculation and loose lending (see: Is there a New Housing Bubble?). But I am becoming concerned about fundamentals:
Maybe prices are too high based on fundamentals (due to extremely low supply and record low mortgage rates), but there is very little evidence of speculation (not like the loose lending of the housing bubble).
...
The lack of wild speculation doesn't mean house prices can't decline, but it means that we won't see cascading declines in prices like what happened when the housing bubble burst.
...
We might see some price declines, especially in some 2nd home areas that saw a surge in demand at the onset of the pandemic, but the recent buyers are all well qualified, and some price declines will not lead to forced selling. So there is no threat to the financial system with widespread defaults.
CoreLogic: Mortgage Application Fraud Risk Index increased in Q1
by Calculated Risk on 4/20/2021 10:38:00 AM
A few excerpts from CoreLogic: Q1 2021 Mortgage Fraud Brief
The CoreLogic® National Mortgage Application Fraud Risk Index (Index) increased by 11.9% for the first quarter of 2021—from 110 to 122. The year-over-year trend is up 7.7% from Q1 2020 (at 113).CR Note: This is still low, but something to watch.
Last quarter we noted an uptick in income reasonability alerts for both purchases and refinances and that trend continued in Q1. Valuation alerts increased for all transactions, due to rapid home price increases as demand exceeds supply. We observed a slight increase in occupancy alerts for refinances, along with a decrease in flipping alerts for purchases.
We expect fraud risk to continue to rise in 2021, fueled by an insufficient supply of affordable housing and rising interest rates that will change the purchase/refinance mix. New guidelines on GSE financing for investment and second homes, including a 7% cap and stricter underwriting guidelines have the potential to heighten occupancy misrep motivations.
emphasis added


