 RSS Feed
 by Calculated Risk on 3/21/2021 08:19:00 PM
Sunday, March 21, 2021
Monday: Existing Home Sales
Weekend:
• Schedule for Week of March 21, 2021
• Housing: Active Inventory down around 50% YoY
• Lawler: Update on the Dismal Demographics of 2020; "Smallest Population increase since 1918"
Monday:
• At 8:30 AM ET, Chicago Fed National Activity Index for February. This is a composite index of other data.
• At 9:00 AM, Discussion, Fed Chair Powell, How Can Central Banks Innovate in the Digital Age?, At the Bank for International Settlements Innovation Summit
• At 10:00 AM, Existing Home Sales for February from the National Association of Realtors (NAR). The consensus is for 6.50 million SAAR, down from 6.69 million. Housing economist Tom Lawler expects the NAR to report sales of 6.29 million SAAR for February.
From CNBC: Pre-Market Data and Bloomberg futures S&P 500 futures are down 5 and DOW futures are down 45 (fair value).
Oil prices were down over the last week with WTI futures at $60.87 per barrel and Brent at $63.98 per barrel. A year ago, WTI was at $19, and Brent was at $26 - so WTI oil prices are UP sharply year-over-year (oil prices collapsed at the beginning of the pandemic).
Here is a graph from Gasbuddy.com for nationwide gasoline prices. Nationally prices are at $2.87 per gallon. A year ago prices were at $2.08 per gallon, so gasoline prices are up $0.79 per gallon year-over-year.
March 21 COVID-19 Test Results and Vaccinations
by Calculated Risk on 3/21/2021 04:22:00 PM
According to the CDC, 124.5 million doses have been administered. 17.1% of the population over 18 is fully vaccinated, and 31.5 of the population over 18 has had at least one dose.
And check out COVID Act Now to see how each state is doing. (updated link to new site)
Over 27,000 US deaths have been reported in March due to COVID.
 Click on graph for larger image.
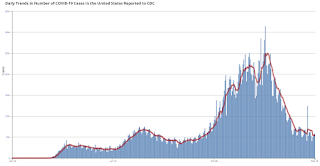
This graph shows the daily (columns) 7 day average (line) of positive tests reported.
This data is from the CDC.
 Click on graph for larger image.
This graph shows the daily (columns) 7 day average (line) of positive tests reported.
This data is from the CDC.
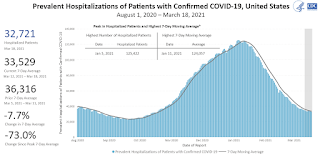
The 7-day average is 54,369, well above the low following the summer surge of 35,000.
The second graph shows the number of people hospitalized.
 This data is also from the CDC.
The CDC cautions that due to reporting delays, the area in grey will probably increase.
The second graph shows the number of people hospitalized.
 This data is also from the CDC.
The CDC cautions that due to reporting delays, the area in grey will probably increase.
The current 7-day average is 33,062 well above the post-summer surge low of 23,000.
Lawler: Update on the Dismal Demographics of 2020; "Smallest Population increase since 1918"
by Calculated Risk on 3/21/2021 08:11:00 AM
CR Note: Back in November, housing economist Tom Lawler wrote The Dismal Demographics of 2020.
Here is an update from Tom Lawler:
Updated provisional data released by the CDC indicates that the US “demographics” in 2020 was even more dismal that what I indicated in my November report of last year. Provisional data through this week show that there were over 3.36 million deaths in 2020.
Deaths: US deaths last year were up by 17.8% from 2019. Given reporting lags in some states the total death count for last year will be somewhat higher than that shown in the table below, these number will probably be pretty close to the total.
| US Deaths by Selected Age Groups | ||||
|---|---|---|---|---|
| 2019 | 2020 | Change | % Change | |
| TOTAL | 2,854,838 | 3,364,312 | 509,474 | 17.8% |
| <1 | 20,921 | 19,182 | -1,739 | -8.3% |
| 1 to 4 | 3,676 | 3,474 | -202 | -5.5% |
| 5 to 14 | 5,497 | 5,570 | 73 | 1.3% |
| 15 to 24 | 29,771 | 35,646 | 5,875 | 19.7% |
| 25 to 34 | 59,178 | 73,030 | 13,852 | 23.4% |
| 35 to 44 | 82,986 | 103,822 | 20,836 | 25.1% |
| 45 to 54 | 160,393 | 190,155 | 29,762 | 18.6% |
| 55 to 64 | 374,937 | 438,193 | 63,256 | 16.9% |
| 65 to 74 | 555,559 | 670,543 | 114,984 | 20.7% |
| 75 to 84 | 688,027 | 817,063 | 129,036 | 18.8% |
| 85+ | 873,746 | 1,007,461 | 133,715 | 15.3% |
| Not Stated | 147 | 173 | 26 | 17.7% |
| Source: CDC; "Not Stated" for 2020 assumed to grow by same amount as total | ||||
While Covid-19 deaths were obviously the major reason for the spike in deaths last year, deaths not directly attributable to Covid-19 also increased significantly last year, especially (in % terms) for the 15-44 year old age groups. This increase may reflect Covid-related deaths not identified as such, the effect of some people not seeking medical help because of the pandemic, and a sharp rise in deaths related to drug overdoses.
On the latter point, provisional CDC data (adjusted for estimated underreporting) show that there were an estimated 88,295 drug overdose deaths in the 12-month period ending August 2020, up 26.8% from drug overdose deaths in the 12-month period ending August 2019.
| US Deaths Not Directly Attributable to Covid-19 | ||||
|---|---|---|---|---|
| 2019 | 2020 | Change | % Change | |
| TOTAL | 2,854,691 | 2,985,526 | 130,835 | 4.6% |
| <1 | 20,921 | 19,139 | -1,782 | -8.5% |
| 1 to 4 | 3,676 | 3,450 | -226 | -6.1% |
| 5 to 14 | 5,497 | 5,503 | 6 | 0.1% |
| 15 to 24 | 29,771 | 35,058 | 5,287 | 17.8% |
| 25 to 34 | 59,178 | 70,495 | 11,317 | 19.1% |
| 35 to 44 | 82,986 | 97,187 | 14,201 | 17.1% |
| 45 to 54 | 160,393 | 172,197 | 11,804 | 7.4% |
| 55 to 64 | 374,937 | 393,395 | 18,458 | 4.9% |
| 65 to 74 | 555,559 | 589,712 | 34,153 | 6.1% |
| 75 to 84 | 688,027 | 712,663 | 24,636 | 3.6% |
| 85+ | 873,746 | 886,727 | 12,981 | 1.5% |
| Source: CDC; Excludes "Not Stated" | ||||
Births: Provisional CDC data through September 2020 suggest that the multi-year downtrend in US births accelerated last year. According to these data, there were an estimated 2.729 million US births from January to September of last year, down 3.1% from the comparable period of 2019. If full year births for 2020 are down by the same Percentage from 2019, then US births for 2020 will total just 3.632 million, the lowest number of births since 1981.
“Natural” Increase: Based on these death and birth data, the so-called “natural” increase in the US population (births minus deaths) totaled just 267,894 last year, the lowest such increase in what I believe is over a century.
| Population Change, ex-Migration | |||
|---|---|---|---|
| Year | Births | Deaths | Births - Deaths |
| 2020 (est) | 3,632,206 | 3,364,312 | 267,894 |
| 2019 | 3,745,450 | 2,854,838 | 890,612 |
| 2018 | 3,791,792 | 2,839,205 | 952,587 |
| 2017 | 3,855,500 | 2,813,503 | 1,041,997 |
| 2016 | 3,945,875 | 2,744,248 | 1,201,627 |
| 2015 | 3,978,497 | 2,712,630 | 1,265,867 |
| 2014 | 3,988,976 | 2,626,418 | 1,362,558 |
| 2013 | 3,932,181 | 2,596,993 | 1,335,188 |
| 2012 | 3,952,841 | 2,543,279 | 1,409,562 |
| 2011 | 3,953,590 | 2,515,458 | 1,438,132 |
| 2010 | 3,999,386 | 2,468,435 | 1,530,951 |
| 2009 | 4,130,665 | 2,437,163 | 1,693,502 |
| 2008 | 4,247,694 | 2,471,984 | 1,775,710 |
Net International Migration: While there is little doubt that combination of the pandemic and Trump administration policies resulted in a sharp decline in net international migration (immigration minus emigration), from what level to what level is not at all clear. There are not any good, timely data on either immigration or (especially) emigration, and historical data are not very reliable.
However, the State Department issues data on monthly immigrant visas issued, and in calendar year 2020 there were just 165,426 immigrant visas issued, down 64.2% from the previous year.
 Click on graph for larger image.
It would not be too surprising if net international migration last year totaled only around 250,000. If that were the case, then the US population in 2020 increased by just 517,894 (or about 0.16%), the smallest increase since 1918, when war and a pandemic resulted in a small population decline.
Saturday, March 20, 2021
March 20 COVID-19 Test Results and Vaccinations
by Calculated Risk on 3/20/2021 04:16:00 PM
According to the CDC, 121.4 million doses have been administered. 16.7% of the population over 18 is fully vaccinated, and 30.7% of the population over 18 has had at least one dose.
And check out COVID Act Now to see how each state is doing. (updated link to new site)
Over 26,000 US deaths have been reported in March due to COVID.
 Click on graph for larger image.
This graph shows the daily (columns) 7 day average (line) of positive tests reported.
This data is from the CDC.
 Click on graph for larger image.
This graph shows the daily (columns) 7 day average (line) of positive tests reported.
This data is from the CDC.
The 7-day average is 53,248, well above the low following the summer surge of 35,000.
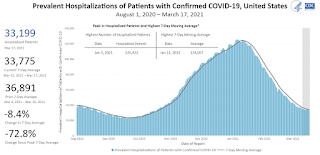
The second graph shows the number of people hospitalized.
 This data is also from the CDC.
The CDC cautions that due to reporting delays, the area in grey will probably increase.
The second graph shows the number of people hospitalized.
 This data is also from the CDC.
The CDC cautions that due to reporting delays, the area in grey will probably increase.
The current 7-day average is 33,529 well above the post-summer surge low of 23,000.
Housing: Active Inventory down around 50% YoY
by Calculated Risk on 3/20/2021 01:24:00 PM
Yesterday I posted Some thoughts on Housing Inventory. I noted:
"It is likely the NAR [National Association of Realtors®] is overstating inventory since many MLSs include pending in the number of listings (as opposed to just active listings)."Housing economist Tom Lawler sent me the following graph.
This shows the YoY change in inventory for Realtor.com (with and without pending sales), and the YoY change in inventory from the NAR.
 Click on graph for larger image.
This shows that the NAR report is similar to Realtor.com including pending sales.
While the NAR is reporting inventory was down 25.7% in January, other measures - that track active inventory - show inventory is down around 50% year-over-year.
Las Vegas Visitor Authority: No Convention Attendance, Visitor Traffic Down 64% YoY in January
by Calculated Risk on 3/20/2021 10:03:00 AM
From the Las Vegas Visitor Authority: January 2021 Las Vegas Visitor Statistics
Continued COVID impacts and the resulting absence of conventions and major tradeshows such as CES, World of Concrete, etc., translated to significant YoY declines in Jan visitation, occupancy and ADR. Las Vegas hosted roughly 1.3M visitors in Jan 2021, down -63.5% YoY.
Total occupancy for Jan improved MoM to 31.6% from 30.9% in Dec but was down from 85.9% in Jan 2020. While Weekend occupancy (48.3%) improved slightly MoM over Dec 2020, the temporarily dormant convention segment resulted in Midweek occupancy at 22.5%, down -61.3 pts YoY.
Average daily rates among open properties reached $90.71 (down -40.9% YoY) while RevPAR came in at approx. $28.66, down -78% vs. Jan 2020.
 Click on graph for larger image.
 The first graph shows visitor traffic for 2019 (blue), 2020 (orange) and 2021 (red).
Visitor traffic was down 63.5% year-over-year.
The casinos started to reopen on June 4th (it appears about 97% of rooms have now opened).
Convention traffic was non-existent again in January, and was down 100% compared to January 2020.
There has been no convention traffic since March 2020.
I'll add a graph of convention traffic once conventions start to reopen.
Schedule for Week of March 21, 2021
by Calculated Risk on 3/20/2021 08:11:00 AM
The key reports this week are the third estimate of Q4 GDP, February New and Existing Home Sales, and February Personal Income and Outlays.
For manufacturing, the March Richmond and Kansas City manufacturing surveys will be released.
Also Fed Chair Powell testifies on the Coronavirus Aid, Relief, and Economic Security Act.
8:30 AM ET: Chicago Fed National Activity Index for February. This is a composite index of other data.
9:00 AM: Discussion, Fed Chair Powell, How Can Central Banks Innovate in the Digital Age?, At the Bank for International Settlements Innovation Summit
 10:00 AM: Existing Home Sales for February from the National Association of Realtors (NAR). The consensus is for 6.50 million SAAR, down from 6.69 million.
The graph shows existing home sales from 1994 through the report last month.
Housing economist Tom Lawler expects the NAR to report sales of 6.29 million SAAR for February.
 10:00 AM: New Home Sales for February from the Census Bureau.
 This graph shows New Home Sales since 1963. The dashed line is the sales rate for last month.
The consensus is for 885 thousand SAAR, down from 923 thousand in January.
10:00 AM: Richmond Fed Survey of Manufacturing Activity for March.
12:00 PM: Testimony, Fed Chair Powell, Coronavirus Aid, Relief, and Economic Security Act, Before the Committee on Financial Services, U.S. House of Representatives
7:00 AM ET: The Mortgage Bankers Association (MBA) will release the results for the mortgage purchase applications index.
8:30 AM: Durable Goods Orders for February from the Census Bureau. The consensus is for a 0.8% increase in durable goods orders.
10:00 AM: Testimony, Fed Chair Powell, Coronavirus Aid, Relief, and Economic Security Act, Before the Committee on Banking, Housing, and Urban Affairs, U.S. Senate
During the day: The AIA's Architecture Billings Index for February (a leading indicator for commercial real estate).
8:30 AM: The initial weekly unemployment claims report will be released. The consensus is for a decrease to 740 thousand from 770 thousand last week.
8:30 AM: Gross Domestic Product, 4th quarter 2020 (Third estimate). The consensus is that real GDP increased 4.1% annualized in Q4, the same as the second estimate of 4.1%.
11:00 AM: the Kansas City Fed manufacturing survey for March.
8:30 AM ET: Personal Income and Outlays, February. The consensus is for a 7.0% decrease in personal income, and for a 0.6% decrease in personal spending. And for the Core PCE price index to increase 0.1%.
10:00 AM: University of Michigan's Consumer sentiment index (Final for March). The consensus is for a reading of 83.5.
10:00 AM: State Employment and Unemployment (Monthly), February 2021
Friday, March 19, 2021
March 19 COVID-19 Test Results and Vaccinations
by Calculated Risk on 3/19/2021 08:06:00 PM
According to the CDC, 118.3 million doses have been administered. 16.2% of the population over 18 is fully vaccinated, and 29.8% of the population over 18 has had at least one dose.
And check out COVID Act Now to see how each state is doing. (updated link to new site)
Almost 25,000 US deaths reported in March due to COVID.
 Click on graph for larger image.
This graph shows the daily (columns) 7 day average (line) of positive tests reported.
This data is from the CDC.
 Click on graph for larger image.
This graph shows the daily (columns) 7 day average (line) of positive tests reported.
This data is from the CDC.
The 7-day average is 53,463, well above the low following the summer surge of 35,000.
The second graph shows the number of people hospitalized.
 This data is also from the CDC.
The CDC cautions that due to reporting delays, the area in grey will probably increase.
The second graph shows the number of people hospitalized.
 This data is also from the CDC.
The CDC cautions that due to reporting delays, the area in grey will probably increase.
The current 7-day average is 33,775 well above the post-summer surge low of 23,000.
Some thoughts on Housing Inventory
by Calculated Risk on 3/19/2021 03:06:00 PM
Last December I wrote Some thoughts on Housing Inventory. We are seeing record low inventory almost everywhere, and here are some updates to that previous post.
The key for housing in 2021 will be inventory. If inventory stays extremely low, there will be more housing starts and a larger increase in house prices. However, if inventory increases significantly, there will be fewer starts and less price appreciation. So what will happen with inventory in 2021?
 Click on graph for larger image.
This graph, based on data from the National Association of Realtors® (NAR), shows nationwide inventory for existing homes.
According to the NAR, inventory was at 1.04 million in January. This was the lowest level on record for the month of January.
Note: It is likely the NAR is overstating inventory since many MLSs include pending in the number of listings (as opposed to just active listings).
Headline inventory is not seasonally adjusted, and inventory usually decreases to the seasonal lows in December and January, and peaks in mid-to-late summer.
Inventory had steadily decreased following the housing bust, and seemed to mostly level out in 2017 through 2019. Then inventory really declined in 2020.
Prior to 2020, two of the key reasons inventory was low:
1) A large number of single family home and condos were converted to rental units. In 2015, housing economist Tom Lawler estimated there were 17.5 million renter occupied single family homes in the U.S., up from 10.7 million in 2000. Many of these houses were purchased by investors. Most of these rental conversions were at the lower end, and that limited the supply for first time buyers.
2) Baby boomers are aging in place (people tend to downsize when they are 75 or 80). The leading edge of the boomers are now turning 77 or so, and the boomers selling will probably gradually increase over the next 10 years.
In 2020, inventory really declined due to a combination of potential sellers keeping their properties off the market during a pandemic, and a pickup in buying due to record low mortgage rates, a move away from multi-family rentals and strong second home buying (to escape the high-density cities).
And at the same time, demographics are now favorable for home buying.
NOTE: This graph is updated using the Vintage 2019 estimates. IMPORTANT NOTE: Housing economist Tom Lawler has pointed out some issues with Census estimates, see: Lawler: The Dismal Demographics of 2020
 See my post Demographics: Renting vs. Owning from a couple of weeks ago.
NOTE: This graph is updated using the Vintage 2019 estimates. IMPORTANT NOTE: Housing economist Tom Lawler has pointed out some issues with Census estimates, see: Lawler: The Dismal Demographics of 2020
 See my post Demographics: Renting vs. Owning from a couple of weeks ago.
This graph shows the longer term trend for three key age groups: 20 to 29, 25 to 34, and 30 to 39 (the groups overlap).
This graph is from 1990 to 2060 (all data from BLS: current to 2060 is projected).
We can see the surge in the 20 to 29 age group (red). Once this group exceeded the peak in earlier periods, there was an increase in apartment construction. This age group peaked in 2018 / 2019 (until the 2030s), and the 25 to 34 age group (orange, dashed) will peak around 2023. This suggests demand for apartments will soften somewhat.
For buying, the 30 to 39 age group (blue) is important (note: see Demographics and Behavior for some reasons for changing behavior). The population in this age group is increasing, and will increase significantly over the next decade.
Demographics are now positive for home buying, and this is a key reason I expected the increase in single family housing starts in 2020.
Note: Based on Lawler's work, I expect some downward revisions to the prime population following the 2020 Census (lower immigration, more prime age deaths). But the general story will remain the same.
Another reason inventory is low, is people are hesitant to put their current home on the market until they find another home to purchase. With record low inventory, this discourages people from selling. When inventory starts to rise, buyers become more patient since they have multiple choices, and the feedback loop works the other way.
So what does this mean for inventory in 2021?
First, making the assumption that the pandemic will be mostly over by mid-2021, we can make a few general predictions:
1. Potential sellers will be more willing to list their homes (and allow strangers into their homes).
2. The move away from dense cities will slow and maybe end. What makes cities attractive (jobs, cultural events and other entertainment), hasn't been available during the pandemic. That will change when the pandemic ends, and cities will be attractive again. Of course, the trends toward remote working, online shopping and home entertainment will likely continue, and this will allow some people to live anywhere.
3. Demographics will be favorable for home buying. The generation moving into the home buying years is much larger than the leading edge of the boomers that will be downsizing - or moving into retirement communities.
4. Mortgage rates have probably bottomed. When rates first start increasing, it is actually an incentive to buy, since people don't want to miss out (if rates rise further).
5. Homebuilders will continue to respond to low inventories, and housing starts will likely increase further in 2021.
The bottom line is inventory will probably increase, especially in the 2nd half of 2021 (with the assumption that the pandemic will be mostly over by mid-year). Currently I'm watching inventory very closely for hints on what will happen later this year.
Rhode Island Real Estate in February: Sales Up 4% YoY, Inventory Down 49% YoY
by Calculated Risk on 3/19/2021 02:36:00 PM
Note: I'm posting data for many local markets around the U.S. The story is the same everywhere ... inventory is at record lows.
For for the entire state Rhode Island:
Closed sales (single family and condos) in February 2021 were 776, up 4.2% from 745 in February 2020.
Active Listings (single family and condos) in February 2021 were 1,569, down 48.5% from 3,046 in February 2020.


