 RSS Feed
 by Calculated Risk on 3/18/2021 06:40:00 PM
Thursday, March 18, 2021
March 18 COVID-19 Test Results and Vaccinations
According to the CDC, 115.7 million doses have been administered. 15.9% of the population over 18 is fully vaccinated, and 29.2% of the population over 18 has had at least one dose.
And check out COVID Act Now to see how each state is doing. (updated link to new site)
Over 23,000 US deaths reported in March due to COVID.
 Click on graph for larger image.
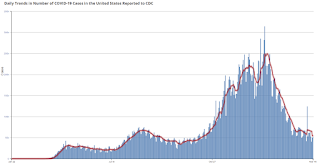
This graph shows the daily (columns) 7 day average (line) of positive tests reported.
This data is from the CDC.
 Click on graph for larger image.
This graph shows the daily (columns) 7 day average (line) of positive tests reported.
This data is from the CDC.
The 7-day average is 53,722, well above the low following the summer surge of 35,000.
The second graph shows the number of people hospitalized.
 This data is also from the CDC.
The CDC cautions that due to reporting delays, the area in grey will probably increase.
The second graph shows the number of people hospitalized.
 This data is also from the CDC.
The CDC cautions that due to reporting delays, the area in grey will probably increase.
The current 7-day average is 34,004 well above the post-summer surge low of 23,000.
Lawler: Early Read on Existing Home Sales in February
by Calculated Risk on 3/18/2021 04:35:00 PM
From housing economist Tom Lawler:
Based on publicly-available local realtor/MLS reports released across the country through today, I project that existing home sales as estimated by the National Association of Realtors ran at a seasonally adjusted annual rate of 6.29 million in February, down 6.0% from January’s preliminary pace but up 10.4% from last February’s seasonally adjusted pace.
Local realtor reports, as well as reports from national inventory trackers, suggest that the YOY decline in the inventory of existing homes for sale last month was significantly larger than the big decline in January. The catalyst for the inventory drop in both months appears to have been very low levels of new listings – almost all realtor reports that include new listings showed a sizable YOY decline.
Finally, local realtor/MLS data suggest that the median existing single-family home sales price last month was up by about 14.5% from last February.
CR Note: The National Association of Realtors (NAR) is scheduled to release February existing home sales on Monday, March 22, 2021 at 10:00 AM ET. The consensus is for 6.51 million SAAR.
Maryland Real Estate in February: Sales Up 12% YoY, Inventory Down 66% YoY
by Calculated Risk on 3/18/2021 03:04:00 PM
Note: I'm posting data for many local markets around the U.S. The story is the same everywhere ... inventory is at record lows.
From the Maryland Realtors for the entire state:
Closed sales in February 2021 were 6,209, up 12.3% from 5,527 in February 2020.
Active Listings in February 2021 were 6,245, down 65.6% from 18,179 in February 2020.
Months of Supply was 0.8 Months in February 2021, compared to 2.4 Months in February 2020.
New Hampshire Real Estate in February: Sales Up 14% YoY, Inventory Down 64% YoY
by Calculated Risk on 3/18/2021 01:53:00 PM
Note: I'm posting data for many local markets around the U.S. The story is the same everywhere ... inventory is at record lows.
From the New Hampshire Realtors for the entire state:
Closed sales Single family and Condos in February 2021 were 1,217, up 13.5% from 1,072 in February 2020.
Active Listings Single family and Condos in February 2021 were 1,514, down 63.8% from 4,178 in February 2020.
Months of Supply for Single family and Condos in February 2021 was 0.7 months, down from 2.1 months in February 2020.
Minnesota Real Estate in February: Sales Up 5% YoY, Inventory Down 52% YoY
by Calculated Risk on 3/18/2021 12:40:00 PM
Note: I'm posting data for many local markets around the U.S. The story is the same just about everywhere ... inventory is at record lows.
From the MNRealtor Homes for sale down. Pending sales flat for first time since May 2020 for the entire state:
Demand remained high in the Minnesota housing market in February as homebuyers competed with multiple offers for diminishing housing stock. Closed sales were up +5.8% over last year, but new listings sank -14.8%. Since last May, pending sales fell flat for the first time and were down -0.8% from February 2020. Adding to the pressure, homes for sale fell 51.6%, the largest decrease in a year. Shrinking inventory defined this seller’s market, pushing the median sales price up +10.6% to $282,000. Days on the market retracted by -25.47% over last year, down to just 47 days. Correspondingly, homes received 99.0% of the original price received, a +2.3% increase over last year.Closed sales in February 2021 were 4,424, up +5.8% from 4,180 in February 2020.
emphasis added
Active Listings in February 2021 were 7,460, down 51.6% from 15,417 in February 2020.
Months of Supply was 0.9 Months in February 2021, compared to 2.1 Months in February 2020.
 Click on graph for larger image.
This graph from the Minnesota Association of REALTORS® shows inventory in Minnesota since 2012. Inventory had been trending down, and then declined significantly during the pandemic.
Hotels: Occupancy Rate Highest in a Year; Down 26% Compared to Same Week in 2019
by Calculated Risk on 3/18/2021 10:33:00 AM
Note: Starting this week, the year-over-year comparisons are easy - since occupancy declined sharply at the onset of the pandemic - but occupancy is still down significantly from normal levels.
The occupancy rate is down 25.8% compared to the same week in 2019. Kelsey Fenerty at CoStar also suggests comparing to 2019: Indexing to 2019 Provides Better Hotel Performance Comparisons
U.S. weekly hotel occupancy reached its highest level in a year, according to STR‘s latest data through March 13.The following graph shows the seasonal pattern for the hotel occupancy rate using the four week average.
March 7-13, 2021 (percentage change from comparable week in 2020):
• Occupancy: 52.1% (-1.4%)
• Average daily rate (ADR): US$102.62 (-14.5%)
• Revenue per available room (RevPAR): US$53.45 (-15.8%)
Year-over-year percentage changes are now more favorable as comparisons have shifted to pandemic-affected weeks from 2020. When indexed against 2019 levels, the U.S. has recaptured between 70-75% of occupancy in recent weeks.
Florida, lifted by Spring Break and Bike Week, was most represented among the leaders in week-to-week occupancy gains.
emphasis added
 Click on graph for larger image.
The red line is for 2021, black is 2020, blue is the median, and dashed light blue is for 2009 (the worst year since the Great Depression for hotels prior to 2020).
Even when occupancy increases to 2009 levels, hotels will still be hurting.
Note: Y-axis doesn't start at zero to better show the seasonal change.
Note: Y-axis doesn't start at zero to better show the seasonal change.
Weekly Initial Unemployment Claims increased to 770,000
by Calculated Risk on 3/18/2021 08:37:00 AM
The DOL reported:
In the week ending March 13, the advance figure for seasonally adjusted initial claims was 770,000, an increase of 45,000 from the previous week's revised level. The previous week's level was revised up by 13,000 from 712,000 to 725,000. The 4-week moving average was 746,250, a decrease of 16,000 from the previous week's revised average. The previous week's average was revised up by 3,250 from 759,000 to 762,250.This does not include the 282,394 initial claims for Pandemic Unemployment Assistance (PUA) that was down from 478,914 the previous week.
emphasis added
The following graph shows the 4-week moving average of weekly claims since 1971.
 Click on graph for larger image.
The dashed line on the graph is the current 4-week average. The four-week average of weekly unemployment claims decreased to 759,000.
The previous week was revised up.
Regular state continued claims decreased to 4,124,000 (SA) from 4,142,000 (SA) the previous week and will likely stay at a high level until the crisis abates.
Note: There are an additional 7,615,386 receiving Pandemic Unemployment Assistance (PUA) that decreased from 8,387,969 the previous week (there are questions about these numbers). This is a special program for business owners, self-employed, independent contractors or gig workers not receiving other unemployment insurance. And an additional 4,815,348 receiving Pandemic Emergency Unemployment Compensation (PEUC) down from 5,456,080.
Weekly claims were higher than the consensus forecast.
Wednesday, March 17, 2021
Thursday: Unemployment Claims, Philly Fed Mfg
by Calculated Risk on 3/17/2021 09:00:00 PM
Thursday:
• At 8:30 AM ET, The initial weekly unemployment claims report will be released. The consensus is for a increase to 715 thousand from 712 thousand last week.
• Also at 8:30 AM, the Philly Fed manufacturing survey for March. The consensus is for a reading of 24.5, up from 23.1.
 Click on graph for larger image.
This graph from MortgageNewsDaily shows the average 30 year fixed rate mortgage rates over the last 10 years.
Mortgage rates at 3.40% are essentially back to the lows of 2012 and 2016.
March 17 COVID-19 Test Results and Vaccinations
by Calculated Risk on 3/17/2021 04:50:00 PM
From Bloomberg on vaccinations as of Mar 17th:
"So far, 113 million doses have been given. In the last week, an average of 2.47 million doses per day were administered."Here is the CDC COVID Data Tracker. This site has data on vaccinations, cases and more.
And check out COVID Act Now to see how each state is doing. (updated link to new site)
There have been over 22,000 US deaths reported in March due to COVID.
 Click on graph for larger image.
This graph shows the daily (columns) 7 day average (line) of positive tests reported.
This data is from the CDC.
 Click on graph for larger image.
This graph shows the daily (columns) 7 day average (line) of positive tests reported.
This data is from the CDC.
The 7-day average is 54,421, well above the low following the summer surge of 35,000.
The second graph shows the number of people hospitalized.
 This data is also from the CDC.
The CDC cautions that due to reporting delays, the area in grey will probably increase.
The second graph shows the number of people hospitalized.
 This data is also from the CDC.
The CDC cautions that due to reporting delays, the area in grey will probably increase.
The current 7-day average is 34,295 well above the post-summer surge low of 23,000.
FOMC Projections and Press Conference
by Calculated Risk on 3/17/2021 02:08:00 PM
Statement here.
Fed Chair Powell press conference video here starting at 2:30 PM ET.
Here are the projections.
Wall Street forecasts are for GDP to increase at a 6% to 8% annual rate in Q1. For the year, from Goldman Sachs "We have raised our GDP forecast to reflect the latest fiscal policy news and now expect 8% growth in 2021 (Q4/Q4) and an unemployment rate of 4% at end-2021"
The FOMC also increased their GDP forecast to 5.8% to 6.6%. GDP for 2023 was revised down.
1 Projections of change in real GDP and inflation are from the fourth quarter of the previous year to the fourth quarter of the year indicated.
The unemployment rate was at 6.2% in February.
| GDP projections of Federal Reserve Governors and Reserve Bank presidents, Change in Real GDP1 | ||||
|---|---|---|---|---|
| Projection Date | 2021 | 2022 | 2023 | |
| Mar 2021 | 5.8 to 6.6 | 3.0 to 3.8 | 2.0 to 2.5 | |
| Dec 2020 | 3.7 to 5.0 | 3.0 to 3.5 | 2.2 to 2.7 | |
The unemployment rate was at 6.2% in February.
Note that the unemployment rate doesn't remotely capture the economic damage to the labor market. Not only are there 10 million people unemployed, but 4.2 million people have left the labor force since January 2020. And millions more are being supported by various provisions of the various disaster relief acts.
The decline in the unemployment rate depends on both job growth, and the participation rate. A strong labor market will probably encourage people to return to the labor force, and the improvements in the unemployment rate might be slower than some expect.
The unemployment rate was revised down for all years.
2 Projections for the unemployment rate are for the average civilian unemployment rate in the fourth quarter of the year indicated.
As of January 2020, PCE inflation was up 1.5% from January 2020.
The projections for inflation were revised up and the FOMC sees inflation above target in 2021.
PCE core inflation was up 1.5% in January year-over-year.
Projections for core inflation were revised up.
The decline in the unemployment rate depends on both job growth, and the participation rate. A strong labor market will probably encourage people to return to the labor force, and the improvements in the unemployment rate might be slower than some expect.
The unemployment rate was revised down for all years.
| Unemployment projections of Federal Reserve Governors and Reserve Bank presidents, Unemployment Rate2 | ||||
|---|---|---|---|---|
| Projection Date | 2021 | 2022 | 2023 | |
| Mar 2021 | 4.2 to 4.7 | 3.6 to 4.0 | 3.2 to 3.8 | |
| Dec 2020 | 4.7 to 5.4 | 3.8 to 4.6 | 3.5 to 4.3 | |
As of January 2020, PCE inflation was up 1.5% from January 2020.
The projections for inflation were revised up and the FOMC sees inflation above target in 2021.
| Inflation projections of Federal Reserve Governors and Reserve Bank presidents, PCE Inflation1 | ||||
|---|---|---|---|---|
| Projection Date | 2021 | 2022 | 2023 | |
| Mar 2021 | 2.2 to 2.4 | 1.8 to 2.1 | 2.0 to 2.2 | |
| Dec 2020 | 1.7 to 1.9 | 1.8 to 2.0 | 1.9 to 2.1 | |
PCE core inflation was up 1.5% in January year-over-year.
Projections for core inflation were revised up.
| Core Inflation projections of Federal Reserve Governors and Reserve Bank presidents, Core Inflation1 | ||||
|---|---|---|---|---|
| Projection Date | 2021 | 2022 | 2023 | |
| Mar 2021 | 2.0 to 2.3 | 1.9 to 2.1 | 2.0 to 2.2 | |
| Dec 2020 | 1.7 to 1.8 | 1.8 to 2.0 | 1.9 to 2.1 | |


