 RSS Feed
 by Calculated Risk on 3/16/2021 10:06:00 AM
Tuesday, March 16, 2021
NAHB: Builder Confidence Decreased to 82 in March
The National Association of Home Builders (NAHB) reported the housing market index (HMI) was at 82, down from 84 in February. Any number above 50 indicates that more builders view sales conditions as good than poor.
From the NAHB: Higher Material Costs, Interest Rates Lower Builder Sentiment
Despite high buyer traffic and strong demand, builder sentiment fell in March as rising lumber and other material prices pushed builder confidence lower. The latest National Association of Home Builders (NAHB)/Wells Fargo Housing Market Index (HMI) shows that builder confidence in the market for newly built single-family homes fell two points to 82 in March.
Though builders continue to see strong buyer traffic, recent increases for material costs and delivery times, particularly for softwood lumber, have depressed builder sentiment this month. Supply shortages and high demand have caused lumber prices to jump about 200 percent since last April.
Builder confidence peaked at a level of 90 last November and has trended lower as supply-side and demand-side factors have trimmed housing affordability. While single-family home building should grow this year, the elevated price of lumber is adding approximately $24,000 to the price of a new home. And mortgage interest rates, while historically low, have increased about 30 basis points over the last month. Nonetheless, the lack of resale inventory means new construction is the only option for some prospective home buyers.
...
The HMI index gauging current sales conditions fell three points to 87 while the component measuring sales expectations in the next six months increased three points to 83. The gauge charting traffic of prospective buyers held firm at 72.
Looking at the three-month moving averages for regional HMI scores, the Northeast rose two points to 80, the Midwest fell one point to 80, the South dropped two points to 82 and the West posted a three-point loss to 90.
 Click on graph for larger image.
This graph show the NAHB index since Jan 1985.
This was slightly below the consensus forecast, but still a very strong reading.
Housing and homebuilding have been one of the best performing sectors during the pandemic.
Industrial Production Decreased 2.2 Percent in February
by Calculated Risk on 3/16/2021 09:22:00 AM
From the Fed: Industrial Production and Capacity Utilization
In February, total industrial production decreased 2.2 percent. Manufacturing output and mining production fell 3.1 percent and 5.4 percent, respectively; the output of utilities increased 7.4 percent.
The severe winter weather in the south central region of the country in mid-February accounted for the bulk of the declines in output for the month. Most notably, some petroleum refineries, petrochemical facilities, and plastic resin plants suffered damage from the deep freeze and were offline for the rest of the month. Excluding the effects of the winter weather would have resulted in an index for manufacturing that fell about 1/2 percent and in an index for mining that rose about 1/2 percent. Both indexes would have remained below their pre-pandemic (February 2020) levels.
At 104.7 percent of its 2012 average, total industrial production in February was 4.2 percent lower than its year-earlier level. Capacity utilization for the industrial sector decreased 1.7 percentage points in February to 73.8 percent, a rate that is 5.8 percentage points below its long-run (1972–2020) average.
emphasis added
 Click on graph for larger image.
This graph shows Capacity Utilization. This series is up from the record low set in April, but still below the level in February 2020.
Capacity utilization at 73.8% is 5.8% below the average from 1972 to 2020.
Note: y-axis doesn't start at zero to better show the change.
 The second graph shows industrial production since 1967.
Industrial production decreased in February to 104.7. This is 4.2% below the February 2020 level.
The change in industrial production was below consensus expectations.
Retail Sales Decreased 3.0% in February
by Calculated Risk on 3/16/2021 08:39:00 AM
On a monthly basis, retail sales decreased 3.0 percent from January to February (seasonally adjusted), and sales were up 6.3 percent from February 2020.
From the Census Bureau report:
Advance estimates of U.S. retail and food services sales for February 2021, adjusted for seasonal variation and holiday and trading-day differences, but not for price changes, were $561.7 billion, a decrease of 3.0 percent from the previous month, and 6.3 percent above February 2020.
emphasis added
 Click on graph for larger image.
This graph shows retail sales since 1992. This is monthly retail sales and food service, seasonally adjusted (total and ex-gasoline).
Retail sales ex-gasoline were down 3.5% in February.
The second graph shows the year-over-year change in retail sales and food service (ex-gasoline) since 1993.
 Retail and Food service sales, ex-gasoline, increased by 7.0% on a YoY basis.
Sales in February were well below expectations, however sales in January were revised up.
Monday, March 15, 2021
Tuesday: Retail Sales, Industrial Production, Homebuilder Survey
by Calculated Risk on 3/15/2021 09:12:00 PM
From Matthew Graham at Mortgage News Daily: MBS RECAP: Fighting Good Fight, Waiting on Fed Day
Coming off a fairly rough Friday at the end of last week, it's mildly reassuring to begin the new week with no additional damage. ... The takeaway is simple: it's a rising rate environment until proven otherwise. If one event has the power to change the trading tone in bonds this week, it's Wednesday's Fed Announcement [30 year fixed 3.33%]Tuesday:
emphasis added
• At 8:30 AM ET, Retail sales for February is scheduled to be released. The consensus is for a 0.5% decrease in retail sales.
• At 9:15 AM, The Fed will release Industrial Production and Capacity Utilization for February. The consensus is for a 0.6% increase in Industrial Production, and for Capacity Utilization to increase to 75.8%.
• At 10:00 AM, The March NAHB homebuilder survey. The consensus is for a reading of 83, down from 84. Any number above 50 indicates that more builders view sales conditions as good than poor.
March 15 COVID-19 Test Results and Vaccinations
by Calculated Risk on 3/15/2021 06:52:00 PM
From Bloomberg on vaccinations as of Mar 15th:
"So far, 109 million doses have been given. In the last week, an average of 2.43 million doses per day were administered."Here is the CDC COVID Data Tracker. This site has data on vaccinations, cases and more.
And check out COVID Act Now to see how each state is doing. (updated link to new site)
There have been over 20,000 US deaths reported in March due to COVID.
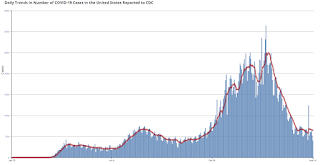 Click on graph for larger image.
This graph shows the daily (columns) 7 day average (line) of positive tests reported.
This data is from the CDC.
 Click on graph for larger image.
This graph shows the daily (columns) 7 day average (line) of positive tests reported.
This data is from the CDC.
The 7-day average is 64,867, well above the low following the summer surge of 35,000.
Note that last week, Missouri reported 81,000 previously unreported cases, and that caused the spike in total cases (and an increase in 7 day average).
Note that last week, Missouri reported 81,000 previously unreported cases, and that caused the spike in total cases (and an increase in 7 day average).
MBA Survey: "Share of Mortgage Loans in Forbearance Decreases to 5.14%"
by Calculated Risk on 3/15/2021 04:00:00 PM
Note: This is as of March 7th.
From the MBA: Share of Mortgage Loans in Forbearance Decreases to 5.14%
The Mortgage Bankers Association’s (MBA) latest Forbearance and Call Volume Survey revealed that the total number of loans now in forbearance decreased by 6 basis points from 5.20% of servicers’ portfolio volume in the prior week to 5.14% as of March 7, 2021. According to MBA’s estimate, 2.6 million homeowners are in forbearance plans.
...
“One year after the onset of the pandemic, many homeowners are approaching 12 months in their forbearance plan. That is likely why call volume to servicers picked up in the prior week to the highest level since last April, and forbearance exits increased to their highest level since January. With new forbearance requests unchanged, the share of loans in forbearance decreased again,” said Mike Fratantoni, MBA’s Senior Vice President and Chief Economist. “Homeowners with federally backed loans have access to up to 18 months of forbearance, but they need to contact their servicer to receive this additional relief.”
Fratantoni added, “The American Rescue Plan provides needed support for homeowners who are continuing to struggle during these challenging times, and stimulus payments are being delivered to households now. We anticipate that this support, along with the improving job market, will help many homeowners to get back on their feet.”
emphasis added
 Click on graph for larger image.
This graph shows the percent of portfolio in forbearance by investor type over time. Most of the increase was in late March and early April, then trended down - and has mostly moved slowly down recently.
The MBA notes: "Total weekly forbearance requests as a percent of servicing portfolio volume (#) remained the same relative to the prior two weeks at 0.07%."
Boston Real Estate in February: Sales Up 7% YoY, Inventory Down 13% YoY
by Calculated Risk on 3/15/2021 03:09:00 PM
Note: I'm posting data for many local markets around the U.S. The story is the same just about everywhere ... inventory is at record lows.
For Boston (single family and condos):
Closed sales in February 2021 were 1,233, up 6.7% from 1,156 in February 2020.
Active Listings in February 2021 were 2,968, down 12.7% from 3,398 in February 2020.
Second Home Market: South Lake Tahoe
by Calculated Risk on 3/15/2021 12:05:00 PM
Last week, from Jann Swanson at MortgageNewsDaily: Fannie Warns Lenders on Investment Properties and 2nd Homes. This action will result in higher interest rates on 2nd home and investment property mortgages.
I'm looking at data for some second home markets - and will track those markets to see if there is an impact from the lending changes.
This graph is for South Lake Tahoe since 2004 through February 2021, and shows inventory (blue), and the year-over-year change in the median price (12 month average).
Note: The median price is distorted by the mix, but this is the available data.
 Click on graph for larger image.
Following the housing bubble, prices declined for several years in South Lake Tahoe, with the median price falling about 50% from the bubble peak.
Note that inventory was high while prices were declining - and significantly lower inventory in 2012 suggested the bust was over. (Tracking inventory helped me call the bottom for housing way back in February 2012, see:The Housing Bottom is Here)
Currently inventory is at a record low, and prices are up sharply. This will be interesting to watch.
Housing Inventory March 15th Update: At Record Lows
by Calculated Risk on 3/15/2021 10:51:00 AM
One of the key questions for 2021 is: Will inventory increase as the pandemic subsides, or will inventory decrease further in 2021?
Tracking inventory will be very important this year.
 Click on graph for larger image in graph gallery.
This inventory graph is courtesy of Altos Research.
As of March 12th, inventory was at 317 thousand (7 day average), compared to 742 thousand the same week a year ago. That is a decline of 57%.
A week ago, inventory was at 318 thousand, and was down 56% YoY. Seasonally inventory should bottom soon.
Mike Simonsen discusses this data regularly on Youtube.
Mike Simonsen discusses this data regularly on Youtube.
BLS: January Unemployment rates down in 33 States
by Calculated Risk on 3/15/2021 10:08:00 AM
From the BLS: Regional and State Employment and Unemployment Summary
Unemployment rates were lower in January in 33 states and the District of Columbia and stable in 17 states, the U.S. Bureau of Labor Statistics reported today. Forty-eight states and the District had jobless rate increases from a year earlier and two states had little change. The national unemployment rate, 6.3 percent, fell by 0.4 percentage point over the month, but was 2.8 points higher than in January 2020.Hawaii is being impacted by the lack of tourism.
Nonfarm payroll employment increased in 20 states, decreased in 2 states, and was essentially unchanged in 28 states and the District of Columbia in January 2021. Over the year, nonfarm payroll employment decreased in 48 states and the District and was essentially unchanged in 2 states.
...
Hawaii and California had the highest unemployment rates in January, 10.2 percent and 9.0 percent, respectively, while South Dakota and Utah had the lowest rates, 3.1 percent each.


