 RSS Feed
 by Calculated Risk on 3/15/2021 08:31:00 AM
Monday, March 15, 2021
Seven High Frequency Indicators for the Economy
These indicators are mostly for travel and entertainment. It will interesting to watch these sectors recover as the vaccine is distributed.
IMPORTANT: Be safe now - if all goes well, we could all be vaccinated by Q2 2021.
----- Airlines: Transportation Security Administration -----
The TSA is providing daily travel numbers.
 Click on graph for larger image.
This data shows the seven day average of daily total traveler throughput from the TSA for 2019 (Light Blue), 2020 (Blue) and 2021 (Red).
The dashed line is the percent of 2019 for the seven day average.
This data is as of March 14th.
The seven day average is down 51.1% from the same week in 2019 (48.9% of last year). (Dashed line)
There was a slow increase from the bottom, with ups and downs due to the holidays - and TSA data has moved up in 2021.
----- Restaurants: OpenTable -----
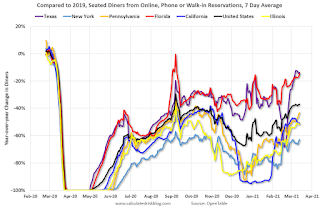
The second graph shows the 7 day average of the year-over-year change in diners as tabulated by OpenTable for the US and several selected cities.
----- Hotel Occupancy: STR -----
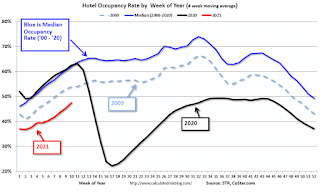 This graph shows the seasonal pattern for the hotel occupancy rate using the four week average.
The red line is for 2021, black is 2020, blue is the median, and dashed light blue is for 2009 (the worst year since the Great Depression for hotels - before 2020).
Even when occupancy increases to 2009 levels, hotels will still be hurting.
This data is through March 6th. Hotel occupancy is currently down 20.5% year-over-year (down 26.7% compared to same week in 2019). Starting next week, the year-over-year comparisons will be easy - since occupancy declined sharply at the onset of the pandemic - but occupancy will still be down significantly from normal levels.
Notes: Y-axis doesn't start at zero to better show the seasonal change.
----- Gasoline Supplied: Energy Information Administration -----
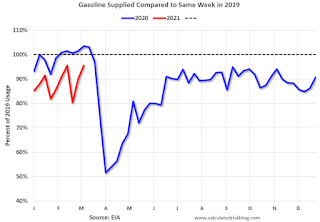 This graph, based on weekly data from the U.S. Energy Information Administration (EIA), shows gasoline supplied compared to the same week of 2019.
Blue is for 2020. Red is for 2021.
As of March 5th, gasoline supplied was off about 4.5% (about 95.5% of the same week in 2019).
Gasoline supplied will be up year-over-year soon, since at one point, gasoline supplied was off almost 50% YoY in 2020.
----- Transit: Apple Mobility -----
This graph is from Apple mobility. From Apple: "This data is generated by counting the number of requests made to Apple Maps for directions in select countries/regions, sub-regions, and cities." This is just a general guide - people that regularly commute probably don't ask for directions.
There is also some great data on mobility from the Dallas Fed Mobility and Engagement Index. However the index is set "relative to its weekday-specific average over January–February", and is not seasonally adjusted, so we can't tell if an increase in mobility is due to recovery or just the normal increase in the Spring and Summer.
 This data is through March 11th for the United States and several selected cities.
The graph is the running 7 day average to remove the impact of weekends.
IMPORTANT: All data is relative to January 13, 2020. This data is NOT Seasonally Adjusted. People walk and drive more when the weather is nice, so I'm just using the transit data.
According to the Apple data directions requests, public transit in the 7 day average for the US is at 56% of the January 2020 level. It is at 50% in Chicago, and 59% in Houston (the dip was a weather related decline) - and moving up recently.
----- New York City Subway Usage -----
Here is some interesting data on New York subway usage (HT BR).
 This graph is from Todd W Schneider. This is weekly data since 2015.
The TSA is providing daily travel numbers.
 Click on graph for larger image.
This data shows the seven day average of daily total traveler throughput from the TSA for 2019 (Light Blue), 2020 (Blue) and 2021 (Red).
The dashed line is the percent of 2019 for the seven day average.
This data is as of March 14th.
The seven day average is down 51.1% from the same week in 2019 (48.9% of last year). (Dashed line)
There was a slow increase from the bottom, with ups and downs due to the holidays - and TSA data has moved up in 2021.
The second graph shows the 7 day average of the year-over-year change in diners as tabulated by OpenTable for the US and several selected cities.
IMPORTANT: OpenTable notes: "we’ve updated the data including downloadable dataset from January 1, 2021 onward to compare seated diners from 2021 to 2019, as opposed to year over year." Thanks!
 Thanks to OpenTable for providing this restaurant data:
This data is updated through March 13, 2021.
This data is "a sample of restaurants on the OpenTable network across all channels: online reservations, phone reservations, and walk-ins. For year-over-year comparisons by day, we compare to the same day of the week from the same week in the previous year."
Note that this data is for "only the restaurants that have chosen to reopen in a given market". Since some restaurants have not reopened, the actual year-over-year decline is worse than shown.
Dining picked up during the holidays, then slumped with the huge winter surge in cases. Dining is picking up again.
----- Movie Tickets: Box Office Mojo -----
 This data shows domestic box office for each week and the median for the years 2016 through 2019 (dashed light blue).
 Thanks to OpenTable for providing this restaurant data:
This data is updated through March 13, 2021.
This data is "a sample of restaurants on the OpenTable network across all channels: online reservations, phone reservations, and walk-ins. For year-over-year comparisons by day, we compare to the same day of the week from the same week in the previous year."
Note that this data is for "only the restaurants that have chosen to reopen in a given market". Since some restaurants have not reopened, the actual year-over-year decline is worse than shown.
Dining picked up during the holidays, then slumped with the huge winter surge in cases. Dining is picking up again.
 This data shows domestic box office for each week and the median for the years 2016 through 2019 (dashed light blue).
 Blue is 2020 and Red is 2021.
The data is from BoxOfficeMojo through Mar 11th.
Note that the data is usually noisy week-to-week and depends on when blockbusters are released.
Movie ticket sales were at $21 million last week, down about 89% from the median for the week.
Note that the data is usually noisy week-to-week and depends on when blockbusters are released.
Movie ticket sales were at $21 million last week, down about 89% from the median for the week.
 This graph shows the seasonal pattern for the hotel occupancy rate using the four week average.
 The red line is for 2021, black is 2020, blue is the median, and dashed light blue is for 2009 (the worst year since the Great Depression for hotels - before 2020).
Even when occupancy increases to 2009 levels, hotels will still be hurting.
This data is through March 6th. Hotel occupancy is currently down 20.5% year-over-year (down 26.7% compared to same week in 2019). Starting next week, the year-over-year comparisons will be easy - since occupancy declined sharply at the onset of the pandemic - but occupancy will still be down significantly from normal levels.
Notes: Y-axis doesn't start at zero to better show the seasonal change.
 This graph, based on weekly data from the U.S. Energy Information Administration (EIA), shows gasoline supplied compared to the same week of 2019.
Blue is for 2020. Red is for 2021.
As of March 5th, gasoline supplied was off about 4.5% (about 95.5% of the same week in 2019).
Gasoline supplied will be up year-over-year soon, since at one point, gasoline supplied was off almost 50% YoY in 2020.
This graph is from Apple mobility. From Apple: "This data is generated by counting the number of requests made to Apple Maps for directions in select countries/regions, sub-regions, and cities." This is just a general guide - people that regularly commute probably don't ask for directions.
There is also some great data on mobility from the Dallas Fed Mobility and Engagement Index. However the index is set "relative to its weekday-specific average over January–February", and is not seasonally adjusted, so we can't tell if an increase in mobility is due to recovery or just the normal increase in the Spring and Summer.
 This data is through March 11th for the United States and several selected cities.
The graph is the running 7 day average to remove the impact of weekends.
IMPORTANT: All data is relative to January 13, 2020. This data is NOT Seasonally Adjusted. People walk and drive more when the weather is nice, so I'm just using the transit data.
According to the Apple data directions requests, public transit in the 7 day average for the US is at 56% of the January 2020 level. It is at 50% in Chicago, and 59% in Houston (the dip was a weather related decline) - and moving up recently.
Here is some interesting data on New York subway usage (HT BR).
 This graph is from Todd W Schneider. This is weekly data since 2015.
 Most weeks are between 30 and 35 million entries, and currently there are under 10 million subway turnstile entries per week.
This data is through Friday, March 12th.
Schneider has graphs for each borough, and links to all the data sources.
He notes: "Data updates weekly from the MTA’s public turnstile data, usually on Saturday mornings".
This data is through Friday, March 12th.
Schneider has graphs for each borough, and links to all the data sources.
He notes: "Data updates weekly from the MTA’s public turnstile data, usually on Saturday mornings".
Sunday, March 14, 2021
Sunday Night Futures
by Calculated Risk on 3/14/2021 08:07:00 PM
Weekend:
• Schedule for Week of March 14, 2021
• FOMC Preview
Monday:
• 8:30 AM ET, The New York Fed Empire State manufacturing survey for March. The consensus is for a reading of 14.5, up from 12.1.
• 10:00 AM, State Employment and Unemployment (Monthly) for January 2021
From CNBC: Pre-Market Data and Bloomberg futures S&P 500 futures are up 4 and DOW futures are up 75 (fair value).
Oil prices were down over the last week with WTI futures at $65.91 per barrel and Brent at $69.48 per barrel. A year ago, WTI was at $29, and Brent was at $28 - so WTI oil prices are UP more than double year-over-year (oil prices collapsed at the beginning of the pandemic).
Here is a graph from Gasbuddy.com for nationwide gasoline prices. Nationally prices are at $2.86 per gallon. A year ago prices were at $2.21 per gallon, so gasoline prices are up $0.65 per gallon year-over-year.
March 14 COVID-19 Test Results and Vaccinations
by Calculated Risk on 3/14/2021 06:55:00 PM
From Bloomberg on vaccinations as of Mar 13th:
"So far, 107 million doses have been given. In the last week, an average of 2.39 million doses per day were administered."Here is the CDC COVID Data Tracker. This site has data on vaccinations, cases and more.
And check out COVID Act Now to see how each state is doing. (updated link to new site)
There have been almost 20,000 US deaths reported in March due to COVID.
 Click on graph for larger image.
This graph shows the daily (columns) 7 day average (line) of positive tests reported.
This data is from the CDC.
 Click on graph for larger image.
This graph shows the daily (columns) 7 day average (line) of positive tests reported.
This data is from the CDC.
The 7-day average is 65,035, well above the low following the summer surge of 35,000.
Note that last week, Missouri reported 81,000 previously unreported cases, and that caused the spike in total cases (and an increase in 7 day average).
The second graph shows the number of people hospitalized.
 This data is also from the CDC.
The CDC cautions that due to reporting delays, the area in grey will probably increase.
The current 7-day average is 35,231 well above the post-summer surge low of 23,000.
FOMC Preview
by Calculated Risk on 3/14/2021 10:53:00 AM
Expectations are there will be no change to rate policy when the FOMC meets on Tuesday and Wednesday this week, but that the FOMC will upgrade their outlook.
Here are some comments from Merrill Lynch economists:
"The FOMC meeting on the 17th will be one of the most critical events for the Fed in some time. We believe Fed Chair Powell will have to strike the right balance between a more upbeat assessment of the outlook and the asymmetric FAIT [flexible average inflation targeting] reaction function. The result will be an acknowledgement that liftoff is earlier than believed back in mid-December but that it is still later than markets currently believe. ...For review, below are the December FOMC projections.
[W]e expect the latest projections to show material upward revisions from the December SEP. We expect growth this year to be revised by at least 1.5ppt to a range of 5.7% - 6.0% 4Q/4Q reflecting the effects of the American Rescue Plan and the improving outlook on the virus situation. ... The unemployment rate is likely to be revised down across the forecast horizon, showing a faster reduction in labor market slack. However, it will be relatively modest compared to the upgrade in growth, suggesting a stronger labor force recovery. This will in turn support modest upward revisions to core PCE inflation such that the 2023 forecast will show an overshoot of the Fed’s target. These ingredients — the unemployment rate at pre-pandemic levels and inflation modestly above target – will be enough to warrant one hike by the Fed in 2023."
emphasis added
| GDP projections of Federal Reserve Governors and Reserve Bank presidents, Change in Real GDP1 | ||||
|---|---|---|---|---|
| Projection Date | 2020 | 2021 | 2022 | 2023 |
| Dec 2020 | -2.5 to -2.2 | 3.7 to 5.0 | 3.0 to 3.5 | 2.2 to 2.7 |
Note that GDP decreased 2.4% Q4-over-Q4 in Q4 2020. That was close to the bottom of the December projections. GDP would have to increase 10.4% in Q1 to return to the pre-recession peak in Q4 2019 (unlikely).
Many forecasters are optimistic about a very strong recovery in 2021, for example, from Goldman Sachs economists this weekend:
"In light of the larger fiscal package just enacted, we now expect slightly higher GDP growth of +6% / +11% / +8.5% / +6.5% in 2021Q1-Q4 which implies +7.0% in 2021 on a full-year basis (vs. +5.5% consensus) and +8.0% on a Q4/Q4 basis (vs. +6.0% consensus)."
We should expect a significant upgrade to the GDP forecast for 2021 and 2022.
The unemployment rate was at 6.2% in February.
Note that the unemployment rate doesn't remotely capture the economic damage to the labor market. Not only are there 10 million people unemployed, but 4.2 million people have left the labor force since January 2020. And millions more are being supported by various provisions of the various disaster relief acts.
Merrill's view is the unemployment rate forecasts will be revised down, but "will be relatively modest compared to the upgrade in growth". The decline in the unemployment rate depends on both job growth, and the participation rate. A strong labor market will probably encourage people to return to the labor force, and the improvements in the unemployment rate might be slower than some expect.
2 Projections for the unemployment rate are for the average civilian unemployment rate in the fourth quarter of the year indicated.
As of January 2020, PCE inflation was up 1.5% from January 2020.
PCE core inflation was up 1.5% in January year-over-year.
My guess is core PCE inflation (year-over-year) will increase in 2021 (from the current 1.5%), but I think too much inflation will NOT be a concern in 2021. Since we saw negative MoM PCE and core PCE readings in March and April, we should ignore a jump in YoY inflation in March, April and May.
Merrill's view is the unemployment rate forecasts will be revised down, but "will be relatively modest compared to the upgrade in growth". The decline in the unemployment rate depends on both job growth, and the participation rate. A strong labor market will probably encourage people to return to the labor force, and the improvements in the unemployment rate might be slower than some expect.
| Unemployment projections of Federal Reserve Governors and Reserve Bank presidents, Unemployment Rate2 | ||||
|---|---|---|---|---|
| Projection Date | 2020 | 2021 | 2022 | 2023 |
| Dec 2020 | 6.7 to 6.8 | 4.7 to 5.4 | 3.8 to 4.6 | 3.5 to 4.3 |
As of January 2020, PCE inflation was up 1.5% from January 2020.
| Inflation projections of Federal Reserve Governors and Reserve Bank presidents, PCE Inflation1 | ||||
|---|---|---|---|---|
| Projection Date | 2020 | 2021 | 2022 | 2023 |
| Dec 2020 | 1.2 | 1.7 to 1.9 | 1.8 to 2.0 | 1.9 to 2.1 |
PCE core inflation was up 1.5% in January year-over-year.
| Core Inflation projections of Federal Reserve Governors and Reserve Bank presidents, Core Inflation1 | ||||
|---|---|---|---|---|
| Projection Date | 2020 | 2021 | 2022 | 2023 |
| Dec 2020 | 1.4 | 1.7 to 1.8 | 1.8 to 2.0 | 1.9 to 2.1 |
My guess is core PCE inflation (year-over-year) will increase in 2021 (from the current 1.5%), but I think too much inflation will NOT be a concern in 2021. Since we saw negative MoM PCE and core PCE readings in March and April, we should ignore a jump in YoY inflation in March, April and May.
It will be interesting to see if the FOMC projects an overshoot in inflation in 2022 or 2023.
Saturday, March 13, 2021
March 13 COVID-19 Test Results and Vaccinations
by Calculated Risk on 3/13/2021 06:16:00 PM
From Bloomberg on vaccinations as of Mar 13th:
"So far, 106 million doses have been given. In the last week, an average of 2.54 million doses per day were administered."Here is the CDC COVID Data Tracker. This site has data on vaccinations, cases and more.
And check out COVID Act Now to see how each state is doing. (updated link to new site)
 Click on graph for larger image.
This graph shows the daily (columns) 7 day average (line) of positive tests reported.
This data is from the CDC.
The 7-day average is 65,800, well above the low following the summer surge of 35,000.
Note that four days ago, Missouri reported 81,000 previously unreported cases, and that caused the spike in total cases (and an increase in 7 day average).
The second graph shows the number of people hospitalized.
 This data is also from the CDC.
The CDC cautions that due to reporting delays, the area in grey will probably increase.
The current 7-day average is 36,198, well above the post-summer surge low of 23,000.
Schedule for Week of March 14, 2021
by Calculated Risk on 3/13/2021 08:11:00 AM
The key reports this week are February Retail Sales and Housing Starts.
For manufacturing, the February Industrial Production report and the March NY and Philly Fed manufacturing surveys will be released.
The FOMC meets this week, and no change to policy is expected.
8:30 AM: The New York Fed Empire State manufacturing survey for March. The consensus is for a reading of 14.5, up from 12.1.
10:00 AM: State Employment and Unemployment (Monthly) for January 2021
 8:30 AM: Retail sales for February is scheduled to be released. The consensus is for a 0.5% decrease in retail sales.
This graph shows the year-over-year change in retail sales and food service (ex-gasoline) since 1993. Retail and Food service sales, ex-gasoline, increased by 8.6% on a YoY basis in January.
 9:15 AM: The Fed will release Industrial Production and Capacity Utilization for February.
This graph shows industrial production since 1967.
The consensus is for a 0.6% increase in Industrial Production, and for Capacity Utilization to increase to 75.8%.
10:00 AM: The March NAHB homebuilder survey. The consensus is for a reading of 83, down from 84. Any number above 50 indicates that more builders view sales conditions as good than poor.
7:00 AM ET: The Mortgage Bankers Association (MBA) will release the results for the mortgage purchase applications index.
 8:30 AM: Housing Starts for February.
 This graph shows single and total housing starts since 1968.
The consensus is for 1.570 million SAAR, down from 1.580 million SAAR.
2:00 PM: FOMC Meeting Announcement. No change to policy is expected at this meeting.
2:00 PM: FOMC Forecasts This will include the Federal Open Market Committee (FOMC) participants' projections of the appropriate target federal funds rate along with the quarterly economic projections.
2:30 PM: Fed Chair Jerome Powell holds a press briefing following the FOMC announcement.
8:30 AM: The initial weekly unemployment claims report will be released. The consensus is for a increase to 715 thousand from 712 thousand last week.
8:30 AM: the Philly Fed manufacturing survey for March. The consensus is for a reading of 24.5, up from 23.1.
No major economic releases scheduled.
Friday, March 12, 2021
March 12 COVID-19 Test Results and Vaccinations; Over 100 Million Doses Administered
by Calculated Risk on 3/12/2021 06:00:00 PM
From Bloomberg on vaccinations as of Mar 12th:
"So far, 101 million doses have been given. In the last week, an average of 2.30 million doses per day were administered."Here is the CDC COVID Data Tracker. This site has data on vaccinations, cases and more.
And check out COVID Act Now to see how each state is doing. (updated link to new site)
 Click on graph for larger image.
This graph shows the daily (columns) 7 day average (line) of positive tests reported.
This data is from the CDC.
The 7-day average is 66,307, well above the low following the summer surge of 35,000.
Note that three days ago, Missouri reported 81,000 previously unreported cases, and that caused the spike in total cases (and an increase in 7 day average).
The second graph shows the number of people hospitalized.
 This data is also from the CDC.
The CDC cautions that due to reporting delays, the area in grey will probably increase.
The current 7-day average is 36,780, well above the post-summer surge low of 23,000.
South Carolina Real Estate in February: Sales Up 13% YoY, Inventory Down 46% YoY
by Calculated Risk on 3/12/2021 02:00:00 PM
Note: I'm posting data for many local markets around the U.S. The story is the same everywhere ... inventory is at record lows.
From the South Carolina Realtors for the entire state:
Closed sales in February 2021 were 7,127, up 13.4% from 6,284 in February 2020.
Active Listings in February 2021 were 14,253, down 46.3% from 26,521 in February 2020.
Months of Supply was 1.6 Months in February 2021, compared to 3.2 Months in February 2020.
MBA: Share of Second Home and Investor Mortgage Applications
by Calculated Risk on 3/12/2021 12:49:00 PM
From the MBA:
This week’s MBA Chart of the Week captures the share of mortgage applications to purchase or refinance a second home or investment property. In February 2021, 10.1 percent of all applications in the retail and consumer direct channels were for a non‐primary residence. This was an increase from 9.5 percent the previous month. 2019 and 2020 saw annual averages of approximately 8 percent. Breaking down the categories, second‐home transactions accounted for 3.6 percent of all applications and investment properties were 6.5 percent, totaling 10.1 percent. Average loan sizes as of February 2021 were $430,000 for second homes and $263,000 for investment properties.
Within purchase mortgages, the second home and investment property share was 14.1 percent of applications in February 2021, an increase from 13.6 percent in January and up from the annual averages of 9 percent in 2019 and 10 percent in 2020. Purchase activity in these property types has been increasing with the start of the spring buying season. Furthermore, demand is rising because of the rise in remote work and the desire to live further away from more densely populated urban areas. Refinancing of second homes and investment properties has also seen an increase – the result of homeowners taking advantage of record‐low mortgage rates.
 Click on graph for larger image.
Recognizing that compositional measures are impacted by the mix of applications, we also examined the year‐over‐year trends in the number of applications for these loan categories. Second home applications were up 37 percent compared to February 2020 and investor applications were up 110.6 percent, while overall applications were up 26.8 percent, which highlights the fact that the pace of growth has been higher for second homes and investment properties.CR Note: The Fannie and Freddie announcement will push up mortgage rates on 2nd homes and investor buying.
Lenders were focused this week on announcements from Fannie Mae and Freddie Mac to limit the share of loans they could sell to the GSEs to 7 percent of their portfolios, well below the run ‐rate in the market at this time.
Q1 GDP Forecasts: Around 5.5% SAAR
by Calculated Risk on 3/12/2021 11:34:00 AM
There was a research note out yesterday that suggested GDP could be back to pre-recession levels by the end of Q1 2021.
Real GDP peaked at $19.254 trillion in Q4 2019 SAAR (Seasonally Adjusted, Annual Rate, 2012 Dollars). In Q4 2020, real GDP was at $18.784 trillion. To increase to the previous peak, real GDP would have to increase at a 10.4% annual rate in Q1 (or upward revisions to previous quarters). That is very unlikely.
From Merrrill Lynch:
We continue to track 5.5% for 1Q GDP. [Mar 12 estimate]From the NY Fed Nowcasting Report
emphasis added
The New York Fed Staff Nowcast stands at 8.6% for 2021:Q1 and 4.0% for 2021:Q2. [Mar 12 estimate]And from the Altanta Fed: GDPNow
The GDPNow model estimate for real GDP growth (seasonally adjusted annual rate) in the first quarter of 2021 is 8.4 percent on March 8, up from 8.3 percent on March 5. [Mar 8 estimate]


