 RSS Feed
 by Calculated Risk on 3/03/2021 07:10:00 PM
Wednesday, March 03, 2021
March 3 COVID-19 Test Results and Vaccinations
SPECIAL NOTE: The Covid Tracking Project will end daily updates on March 7th.
From Bloomberg on vaccinations as of Mar 2nd.
"In the U.S., more Americans have now received at least one dose than have tested positive for the virus since the pandemic began. So far, 80.5 million doses have been given. In the last week, an average of 2.01 million doses per day were administered."Here is the CDC COVID Data Tracker. This site has data on vaccinations, cases and more.
The US has averaged 1.5 million tests per day over the last week. The percent positive over the last 7 days was 4.2%.
Based on the experience of other countries, for adequate test-and-trace (and isolation) to reduce infections, the percent positive needs to below 1%, so the US has far too many daily cases - and percent positive - to do effective test-and-trace.
There were 1,401,364 test results reported over the last 24 hours.
There were 66,836 positive tests.
Almost 5,500 US deaths have been reported in March. See the graph on US Daily Deaths here.
This data is from the COVID Tracking Project.
And check out COVID Act Now to see how each state is doing. (updated link to new site)
 Click on graph for larger image.
This graph shows the 7 day average of positive tests reported and daily hospitalizations.
The dashed line is the post-summer surge low for hospitalizations.
Fed's Beige Book: "Economic activity expanded modestly"
by Calculated Risk on 3/03/2021 02:15:00 PM
Fed's Beige Book "This report was prepared at the Federal Reserve Bank of Atlanta based on information collected on or before February 22nd."
Economic activity expanded modestly from January to mid-February for most Federal Reserve Districts. Most businesses remain optimistic regarding the next 6-12 months as COVID-19 vaccines become more widely distributed. Reports on consumer spending and auto sales were mixed. Although a few Districts reported slight improvements in travel and tourism activity, overall conditions in the leisure and hospitality sector continued to be restrained by ongoing COVID-19 restrictions. Despite challenges from supply chain disruptions, overall manufacturing activity for most Districts increased moderately from the previous report. Among Districts reporting on nonfinancial services, activity was mixed, though most reported modest growth over the reporting period. Some Districts noted that financial institutions experienced declines in loan volumes, but most cited lower delinquency rates and elevated deposit levels. Historically low mortgage interest rates continued to spur robust demand for both new and existing homes in most Districts, and home prices continued to rise in many areas of the U.S. On balance, commercial real estate conditions in the hotel, retail, and office sectors deteriorated somewhat, while activity in the multifamily sector remained steady and the industrial segment continued to strengthen. Districts reporting on energy observed a slight uptick in activity related to oil and gas production and energy consumption. Overall, reports on agricultural conditions were somewhat improved since the previous report. Transportation activity grew modestly for many Districts.CR Note: The pandemic is still depressing activity.
...
Most Districts reported that employment levels rose over the reporting period, albeit slowly. Labor demand varied considerably by industry and by skill level, and many contacts noted continued difficulties attracting and retaining qualified workers. Labor supply shortages were noted by contacts as most acute among low-skill occupations and skilled trade positions. Constraints on labor supply included those related to COVID-19, childcare, and unemployment benefits. Overall, contacts expect modest improvements in employment levels in the near term. Several Districts reported modest wage increases for high-demand positions with many also noting upward pressure on wages to attract and retain employees. On balance, wage increases for many Districts are expected to persist or to pick up somewhat over the next several months.
emphasis added
U.S. Heavy Truck Sales up 9% Year-over-year in February
by Calculated Risk on 3/03/2021 01:05:00 PM
The following graph shows heavy truck sales since 1967 using data from the BEA. The dashed line is the February 2021 seasonally adjusted annual sales rate (SAAR).
Heavy truck sales really collapsed during the great recession, falling to a low of 180 thousand SAAR in May 2009. Then heavy truck sales increased to a new all time high of 575 thousand SAAR in September 2019.
However heavy truck sales started declining in late 2019 due to lower oil prices.
Note: "Heavy trucks - trucks more than 14,000 pounds gross vehicle weight."

Click on graph for larger image.
Heavy truck sales really declined towards the end of March 2020 due to COVID-19 and the collapse in oil prices, falling to a low of 299 thousand SAAR in May 2020, but have since rebounded.
Heavy truck sales were at 489 thousand SAAR in February, down from 530 thousand SAAR in January, but up 9% from 448 thousand SAAR in February 2020.
The year-over-year comparison will be easy for the next several months because of the collapse in sales in the early months of the pandemic.
ISM® Services Index decreased to 55.3% in February
by Calculated Risk on 3/03/2021 10:13:00 AM
(Posted with permission). The February ISM® Services index was at 55.3%, down from 58.7% last month. The employment index decreased to 52.7%, from 55.2%. Note: Above 50 indicates expansion, below 50 contraction.
From the Institute for Supply Management®: February 2021 Services ISM® Report On Business®
Economic activity in the services sector grew in February for the ninth month in a row, say the nation’s purchasing and supply executives in the latest Services ISM® Report On Business®.This was below expectations, and the report showed a decline for the employment index.
The report was issued today by Anthony Nieves, CPSM, C.P.M., A.P.P., CFPM, Chair of the Institute for Supply Management® (ISM®) Services Business Survey Committee: “The Services PMI® registered 55.3 percent, 3.4 percentage points lower than the January reading of 58.7 percent. This reading indicates the ninth straight month of growth for the services sector, which has expanded for all but two of the last 133 months.
emphasis added
February Vehicles Sales decreased to 15.67 Million SAAR
by Calculated Risk on 3/03/2021 08:29:00 AM
The BEA released their estimate of light vehicle sales for February this morning. The BEA estimates sales of 15.67 million SAAR in February 2021 (Seasonally Adjusted Annual Rate), down 5.7% from the January sales rate, and down 6.6% from February 2020.
This was below the consensus estimate of 16.4 million SAAR.
 Click on graph for larger image.
This graph shows light vehicle sales since 2006 from the BEA (blue) and the BEA's estimate for February (red).
The impact of COVID-19 was significant, and April was the worst month.
Since April, sales have increased, but are still down year-over-year,
The second graph shows light vehicle sales since the BEA started keeping data in 1967.
 Note: dashed line is current estimated sales rate of 15.673 million SAAR.
 Click on graph for larger image.
This graph shows light vehicle sales since 2006 from the BEA (blue) and the BEA's estimate for February (red).
The impact of COVID-19 was significant, and April was the worst month.
Since April, sales have increased, but are still down year-over-year,
The second graph shows light vehicle sales since the BEA started keeping data in 1967.
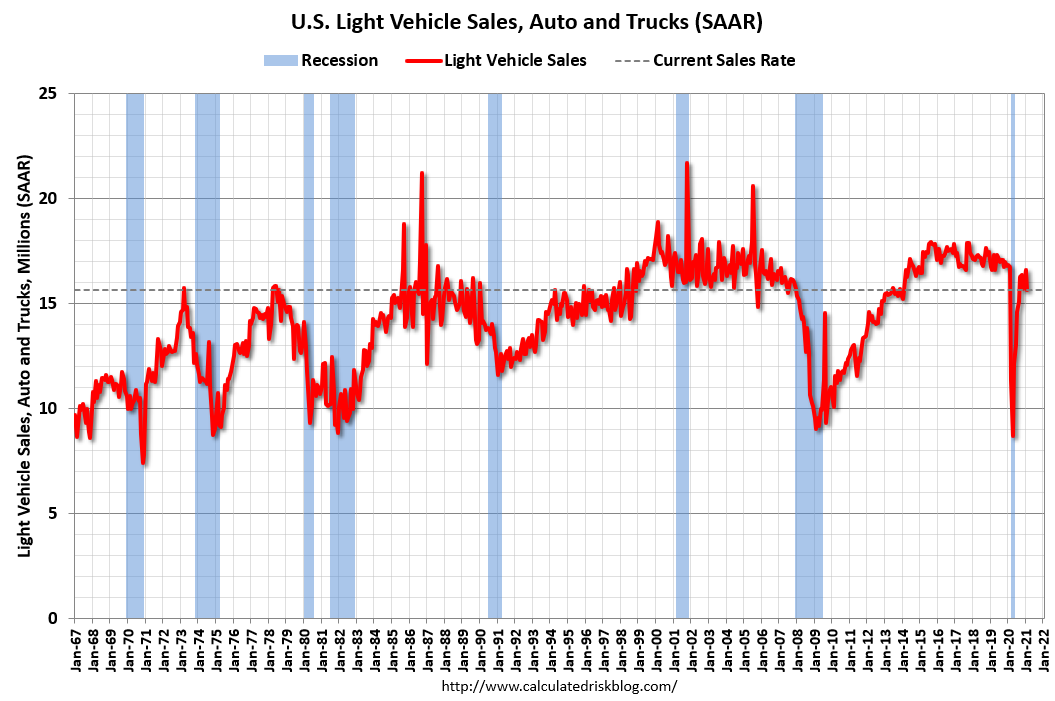 Note: dashed line is current estimated sales rate of 15.673 million SAAR.
Sales in February were probably negatively impacted by the poor weather in many parts of the country.
ADP: Private Employment increased 117,000 in February
by Calculated Risk on 3/03/2021 08:20:00 AM
Private sector employment increased by 117,000 jobs from January to February according to the February ADP® National Employment ReportTM. Broadly distributed to the public each month, free of charge, the ADP National Employment Report is produced by the ADP Research Institute® in collaboration with Moody’s Analytics. The report, which is derived from ADP’s actual payroll data, measures the change in total nonfarm private employment each month on a seasonally-adjusted basis.This was below the consensus forecast of 168,000 for this report.
The labor market continues to post a sluggish recovery across the board,” said Nela Richardson, chief economist, ADP. “We’re seeing large-sized companies increasingly feeling the effects of COVID-19, while job growth in the goods producing sector pauses. With the pandemic still in the driver’s seat, the service sector remains well below its pre-pandemic levels; however, this sector is one that will likely benefit the most over time with reopenings and increased consumer confidence.
emphasis added
The BLS report will be released Friday, and the consensus is for 148 thousand non-farm payroll jobs added in February. The ADP report has not been very useful in predicting the BLS report.
MBA: Mortgage Applications Increase in Latest Weekly Survey
by Calculated Risk on 3/03/2021 07:00:00 AM
From the MBA: Mortgage Applications Increase in Latest MBA Weekly Survey
Mortgage applications increased 0.5 percent from one week earlier, according to data from the Mortgage Bankers Association’s (MBA) Weekly Mortgage Applications Survey for the week ending February 26, 2021.
... The Refinance Index increased 0.1 percent from the previous week and was 7 percent higher than the same week one year ago. The seasonally adjusted Purchase Index increased 2 percent from one week earlier. The unadjusted Purchase Index increased 5 percent compared with the previous week and was 1 percent higher than the same week one year ago.
“Mortgage rates jumped last week on market expectations of stronger economic growth and higher inflation. The 30-year fixed rate experienced its largest single-week increase in almost a year, reaching 3.23 percent – the highest since July 2020,” said Joel Kan, MBA’s Associate Vice President of Economic and Industry Forecasting. “The overall share of refinances declined for the fourth consecutive week, and conventional refinance applications fell more than 2 percent to the lowest level in four months. Government refinance applications historically lag the more rate-sensitive movements of conventional applications, and that was true last week, as both FHA and VA refinancing volumes increased.”
Added Kan, “The housing market is entering the busy spring buying season with strong demand. Purchase applications increased, with a rise in government applications – likely first-time buyers – pulling down the average loan size for the first time in six weeks.”
...
The average contract interest rate for 30-year fixed-rate mortgages with conforming loan balances ($548,250 or less) increased to 3.23 percent from 3.08 percent, with points increasing to 0.48 from 0.46 (including the origination fee) for 80 percent loan-to-value ratio (LTV) loans.
emphasis added
 Click on graph for larger image.
The first graph shows the refinance index since 1990.
The refinance index has been volatile recently depending on rates.
With near record low rates, the index remains up from last year (but will be down year-over-year next week - since rates fell sharply at the beginning of the pandemic).
 The second graph shows the MBA mortgage purchase index
According to the MBA, purchase activity is up 1% year-over-year unadjusted.
Note: Red is a four-week average (blue is weekly).
Tuesday, March 02, 2021
Wednesday: ADP Employment, ISM Services, Beige Book
by Calculated Risk on 3/02/2021 09:00:00 PM
Wednesday:
• At 7:00 AM ET, The Mortgage Bankers Association (MBA) will release the results for the mortgage purchase applications index.
• At 8:15 AM, The ADP Employment Report for February. This report is for private payrolls only (no government). The consensus is for 168,000 payroll jobs added in February, down from 174,000 added in January.
• At 10:00 AM, the ISM Services Index for February.
• At 2:00 PM, the Federal Reserve Beige Book, an informal review by the Federal Reserve Banks of current economic conditions in their Districts.
March 2 COVID-19 Test Results and Vaccinations
by Calculated Risk on 3/02/2021 06:42:00 PM
SPECIAL NOTE: The Covid Tracking Project will end daily updates on March 7th.
From Bloomberg on vaccinations as of Mar 2nd.
"In the U.S., more Americans have now received at least one dose than have tested positive for the virus since the pandemic began. So far, 78.6 million doses have been given. In the last week, an average of 1.94 million doses per day were administered."Here is the CDC COVID Data Tracker. This site has data on vaccinations, cases and more.
The US has averaged 1.5 million tests per day over the last week. The percent positive over the last 7 days was 4.2%.
Based on the experience of other countries, for adequate test-and-trace (and isolation) to reduce infections, the percent positive needs to below 1%, so the US has far too many daily cases - and percent positive - to do effective test-and-trace.
There were 1,349,529 test results reported over the last 24 hours.
There were 54,248 positive tests.
Over 3,100 US deaths have been reported in March. See the graph on US Daily Deaths here.
This data is from the COVID Tracking Project.
And check out COVID Act Now to see how each state is doing. (updated link to new site)
 Click on graph for larger image.
This graph shows the 7 day average of positive tests reported and daily hospitalizations.
The dashed line is the post-summer surge low for hospitalizations.
CFPB: "Over 11 Million Families At Risk Of Losing Housing"
by Calculated Risk on 3/02/2021 01:32:00 PM
From the CFPB: New Report From Consumer Financial Protection Bureau Finds Over 11 Million Families At Risk Of Losing Housing
Today, the Consumer Financial Protection Bureau (CFPB) issued a report that warns of widespread evictions and foreclosures once federal, state, and local pandemic protections come to an end, absent additional public and private action. Over 11 million families are behind on their rent or mortgage payments: 2.1 million families are behind at least three months on mortgage payments, while 8.8 million are behind on rent. Homeowners alone are estimated to owe almost $90 billion in missed payments. The last time this many families were behind on their mortgages was during the Great Recession.Here is the report: Housing insecurity and the COVID-19 pandemic
“We have very little time to prevent millions of families from losing their homes to eviction and foreclosure,” warns CFPB Acting Director Dave Uejio. “At the CFPB, we are working hard to help homeowners and renters as the U.S. begins to turn a painful crisis, caused by the pandemic, into a robust recovery. We know small landlords are struggling, too, with many dipping into savings or using credit cards to make it through the pandemic. We want everyone—homeowners and renters, landlords, and mortgage servicers—to have the tools they need now to avoid unnecessary evictions and foreclosures.”
CR Notes: Most of the homeowners in forbearance will be able to restructure their loans once they are able to return to work, and I do not expect a large number of foreclosures.
However, a large number of renters are at risk of eviction once the moratoriums end.


