 RSS Feed
 by Calculated Risk on 12/04/2020 07:22:00 PM
Friday, December 04, 2020
December 4 COVID-19 Test Results; Record Cases, Hospitalizations
I'm looking forward to not posting this data in a few months. Please stay healthy!
The US is now averaging over 1 million tests per day. Based on the experience of other countries, for adequate test-and-trace (and isolation) to reduce infections, the percent positive needs to be well under 5% (probably close to 1%), so the US still needs to increase the number of tests per day significantly (or take actions to push down the number of new infections).
There were 1,443,932 test results reported over the last 24 hours.
There were 224,831 positive tests.
Almost 10,500 US deaths have been reported so far in December. See the graph on US Daily Deaths here.
 Click on graph for larger image.
This data is from the COVID Tracking Project.
The percent positive over the last 24 hours was 15.6% (red line is 7 day average). The percent positive is calculated by dividing positive results by the sum of negative and positive results (I don't include pending).
And check out COVID Exit Strategy to see how each state is doing.
 The second graph shows the 7 day average of positive tests reported and daily hospitalizations.
The dashed line is the previous hospitalization maximum.
Note that there were very few tests available in March and April, and many cases were missed, so the hospitalizations was higher relative to the 7-day average of positive tests in July.
• Record Hospitalizations (Over 101,000)
• Record 7 Day Average Cases
• Highest 7 Day Average Deaths since April
AAR: November Rail Carloads down 5.8% YoY, Intermodal Up 11.5% YoY
by Calculated Risk on 12/04/2020 04:00:00 PM
From the Association of American Railroads (AAR) Rail Time Indicators. Graphs and excerpts reprinted with permission.
Total U.S. carloads in November 2020 were down 5.8% from November 2019, their smallest year over-year percentage decline since August 2019. (The peak recent decline was 27.7% in May 2020.) In November, 9 of the 20 carload categories the AAR tracks had year-over-year carload gains. Grain and chemicals led the way. In November, U.S. grain carloads were the most since October 2007, while carloads of chemicals were the second most for any November on record. Meanwhile, November 2020 was the sixth-best month ever (in terms of weekly average originations) for U.S. intermodal. It might have been the best month ever if Thanksgiving week hadn’t pulled down November’s weekly average.
emphasis added
 Click on graph for larger image.
This graph from the Rail Time Indicators report shows the six week average of U.S. Carloads in 2018, 2019 and 2020:
Total U.S. carloads (not including intermodal) were 900,194 in November 2020, down 5.8% from November 2019. That’s the smallest year-over-year percentage decline for total carloads since August 2019. The peak decline was 27.7% in May 2020. That said, total carloads averaged 225,049 per week in November 2020, the smallest weekly average for November in our records which begin in 1988.
 The second graph shows the six week average of U.S. intermodal in 2018, 2019 and 2020: (using intermodal or shipping containers):
U.S. railroads originated an average of 284,174 intermodal containers and trailers per week in November 2020 — the most ever for November and the sixth best month overall. Thanksgiving week (246,504 units) pulled down November’s average — the second week of November (295,316 units) and the third week of November (301,129 units) were the fifth-best and thirdbest weeks, respectively, in history for U.S. intermodal.Note that rail traffic was weak prior to the pandemic, and intermodal has come back strong.
U.S. intermodal volume in November 2020 was up 11.5% over November 2019. That’s intermodal’s fourth straight year-over-year monthly gain and the biggest year-over-year percentage gain since February 2016.
Black Knight: Number of Homeowners in COVID-19-Related Forbearance Plans Decreased Slightly
by Calculated Risk on 12/04/2020 01:36:00 PM
Note: Both Black Knight and the MBA (Mortgage Bankers Association) are putting out weekly estimates of mortgages in forbearance.
This data is as of December 1st.
From Black Knight: Forbearances Resume Trend of Improvement
After a two week stretch of – not unexpected – slight increases in the number of active forbearance plans, our weekly snapshot of daily tracking data showed a partial reversal through Tuesday, December 1, continuing the “stairstep” nature of the recovery we’ve come to expect over the last several months.
Over the past seven days, the number of active forbearances saw a modest decline of 39,000, countering more than two thirds of the 57,000 increase over the two weeks prior. The decline was likely driven by a portion of the roughly 200,000 expirations that were scheduled for the end of November.
...
Click on graph for larger image.
Overall, forbearances are now down by 91,000 (-3.2%) month-over-month. While November saw comparatively limited forbearance expiration activity, more than 1 million forbearance plans are scheduled to expire in December, representing nearly 40% of all active forbearance cases.
In total, as of December 1, 2.76 million homeowners remain in active forbearance plans. Together, representing approximately 5.2% of all active mortgages – down from 5.3% from last week – they account for approximately $561 billion in unpaid principal.
...
Of course, COVID-19 cases continue to spike nationwide, and unemployment claims have risen in recent weeks. As such, we will keep a close eye on the possibility of increasing forbearance starts over the coming weeks. Black Knight will continue to monitor the situation and report our findings on this blog.
emphasis added

Trade Deficit Increased to $63.1 Billion in October
by Calculated Risk on 12/04/2020 11:08:00 AM
From the Department of Commerce reported:
The U.S. Census Bureau and the U.S. Bureau of Economic Analysis announced today that the goods and services deficit was $63.1 billion in October, up $1.0 billion from $62.1 billion in September, revised.
October exports were $182.0 billion, $4.0 billion more than September exports. October imports were $245.1 billion, $5.0 billion more than September imports.
emphasis added
 Click on graph for larger image.
Both exports and imports increased in October.
Exports are down 13.5% compared to October 2019; imports are down 3.3% compared to October 2019.
Both imports and exports decreased sharply due to COVID-19, and have now bounced back (imports more than exports),
The second graph shows the U.S. trade deficit, with and without petroleum.
 The blue line is the total deficit, and the black line is the petroleum deficit, and the red line is the trade deficit ex-petroleum products.
Note that the U.S. exported a slight net positive petroleum products in recent months.
Oil imports averaged $36.23 per barrel in October, down from $37.59 per barrel in September, and down from $52.02 in October 2019.
The trade deficit with China decreased to $30.1 billion in October, from $31.3 billion in October 2019.
Comments on November Employment Report
by Calculated Risk on 12/04/2020 09:18:00 AM
The headline jobs number in the November employment report was well below expectations, however employment for the previous two months were revised up slightly, combined.
Government employment declined 99 thousand in November. The job losses at the Federal level were due to letting go temporary decennial workers, however state and local governments lost jobs again. These state and local government job losses could increase sharply in early 2021 if there is no disaster relief for the states.
Leisure and hospitality added another 31 thousand jobs in November, following 4.84 million jobs added in May through October. Leisure and hospitality lost 8.3 million jobs in March and April, so about 59% of those jobs were added back in the May through November period.
Earlier: November Employment Report: 245 Thousand Jobs Added, 6.7% Unemployment Rate
In November, the year-over-year employment change was minus 9.19 million jobs.
Permanent Job Losers
 Click on graph for larger image.
This graph shows permanent job losers as a percent of the pre-recession peak in employment through the November report. (ht Joe Weisenthal at Bloomberg)
This data is only available back to 1994, so there is only data for three recessions.
In November, the number of permanent job losers increased to 3.743 million from 3.684 million in October.
Prime (25 to 54 Years Old) Participation
 Since the overall participation rate has declined due to cyclical (recession) and demographic (aging population, younger people staying in school) reasons, here is the employment-population ratio for the key working age group: 25 to 54 years old.
The prime working age will be key in the eventual recovery.
The 25 to 54 participation rate decreased in November to 80.9% from 81.2% in October, and the 25 to 54 employment population ratio was unchanged at 76.0% from 76.0% in October.
Seasonal Retail Hiring
Typically retail companies start hiring for the holiday season in October, and really increase hiring in November. Here is a graph that shows the historical net retail jobs added for October, November and December by year.
 This graph really shows the collapse in retail hiring in 2008. Since then seasonal hiring had increased back close to more normal levels. Note: I expect the long term trend will be down with more and more internet holiday shopping.
Retailers hired 302 thousand workers (NSA) net in November. Note: this is NSA (Not Seasonally Adjusted). This was a loss of 35 thousand jobs, seasonally adjusted, in November.
This might be distorted this year by a combination of seasonal hiring - and some bounce back in employment from the shutdowns earlier this year.
Part Time for Economic Reasons
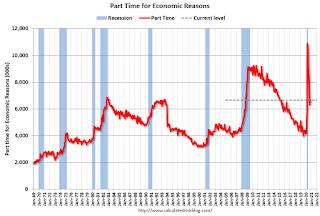 From the BLS report:
These workers are included in the alternate measure of labor underutilization (U-6) that decreased to 12.0% in November. This is down from the record high in April 22.8% for this measure since 1994.
Unemployed over 26 Weeks
 This graph shows the number of workers unemployed for 27 weeks or more.
According to the BLS, there are 3.941 million workers who have been unemployed for more than 26 weeks and still want a job.
This has increased sharply - since the largest number of layoffs were around April - and this will be a key measure to follow during the recovery.
Summary:
The headline monthly jobs number was well below expectations, however the previous two months were revised up 11,000 combined. The headline unemployment rate decreased to 6.7%, but this was due to a decline in the participation rate. Overall this was a disappointing report.
Leisure and hospitality added another 31 thousand jobs in November, following 4.84 million jobs added in May through October. Leisure and hospitality lost 8.3 million jobs in March and April, so about 59% of those jobs were added back in the May through November period.
Earlier: November Employment Report: 245 Thousand Jobs Added, 6.7% Unemployment Rate
In November, the year-over-year employment change was minus 9.19 million jobs.
Permanent Job Losers
 Click on graph for larger image.
This graph shows permanent job losers as a percent of the pre-recession peak in employment through the November report. (ht Joe Weisenthal at Bloomberg)
This data is only available back to 1994, so there is only data for three recessions.
In November, the number of permanent job losers increased to 3.743 million from 3.684 million in October.
Prime (25 to 54 Years Old) Participation
 Since the overall participation rate has declined due to cyclical (recession) and demographic (aging population, younger people staying in school) reasons, here is the employment-population ratio for the key working age group: 25 to 54 years old.
The prime working age will be key in the eventual recovery.
The 25 to 54 participation rate decreased in November to 80.9% from 81.2% in October, and the 25 to 54 employment population ratio was unchanged at 76.0% from 76.0% in October.
Seasonal Retail Hiring
Typically retail companies start hiring for the holiday season in October, and really increase hiring in November. Here is a graph that shows the historical net retail jobs added for October, November and December by year.
 This graph really shows the collapse in retail hiring in 2008. Since then seasonal hiring had increased back close to more normal levels. Note: I expect the long term trend will be down with more and more internet holiday shopping.
Retailers hired 302 thousand workers (NSA) net in November. Note: this is NSA (Not Seasonally Adjusted). This was a loss of 35 thousand jobs, seasonally adjusted, in November.
This might be distorted this year by a combination of seasonal hiring - and some bounce back in employment from the shutdowns earlier this year.
Part Time for Economic Reasons
 From the BLS report:
"The number of persons employed part time for economic reasons was about unchanged over the month at 6.7 million but remains 2.3 million higher than the February level. These individuals, who would have preferred full-time employment, were working part time because their hours had been reduced or they were unable to find full-time jobs."The number of persons working part time for economic reasons decreased slightly in November to 6.660 million from 6.684 million in October.
These workers are included in the alternate measure of labor underutilization (U-6) that decreased to 12.0% in November. This is down from the record high in April 22.8% for this measure since 1994.
Unemployed over 26 Weeks
 This graph shows the number of workers unemployed for 27 weeks or more.
 According to the BLS, there are 3.941 million workers who have been unemployed for more than 26 weeks and still want a job.
This has increased sharply - since the largest number of layoffs were around April - and this will be a key measure to follow during the recovery.
Summary:
The headline monthly jobs number was well below expectations, however the previous two months were revised up 11,000 combined. The headline unemployment rate decreased to 6.7%, but this was due to a decline in the participation rate. Overall this was a disappointing report.
November Employment Report: 245 Thousand Jobs Added, 6.7% Unemployment Rate
by Calculated Risk on 12/04/2020 08:41:00 AM
From the BLS:
Total nonfarm payroll employment rose by 245,000 in November, and the unemployment rate edged down to 6.7 percent, the U.S. Bureau of Labor Statistics reported today. These improvements in the labor market reflect the continued resumption of economic activity that had been curtailed due to the coronavirus (COVID-19) pandemic and efforts to contain it. However, the pace of improvement in the labor market has moderated in recent months. In November, notable job gains occurred in transportation and warehousing, professional and business services, and health care. Employment declined in government and retail trade.
...
In November, the unemployment rate edged down to 6.7 percent. The rate is down by 8.0 percentage points from its recent high in April but is 3.2 percentage points higher than it was in February. The number of unemployed persons, at 10.7 million, continued to trend down in November but is 4.9 million higher than in February.
...
The change in total nonfarm payroll employment for September was revised up by 39,000, from +672,000 to +711,000, and the change for October was revised down by 28,000, from +638,000 to +610,000. With these revisions, employment in September and October combined was 11,000 more than previously reported.
emphasis added
 Click on graph for larger image.
The first graph shows the year-over-year change in total non-farm employment since 1968.
In November, the year-over-year change was negative 9.19 million jobs.
Total payrolls increased by 245 thousand in November. Private payrolls increased by 344 thousand.
Payrolls for September and October were revised up 11 thousand combined.
 The second graph shows the job losses from the start of the employment recession, in percentage terms.
The current employment recession is by far the worst recession since WWII in percentage terms, and is still worse than the worst of the "Great Recession".
The third graph shows the employment population ratio and the participation rate.
 The Labor Force Participation Rate decreased to 61.5% in November. This is the percentage of the working age population in the labor force.
 The Employment-Population ratio decreased to 57.3% (black line).
I'll post the 25 to 54 age group employment-population ratio graph later.
 The fourth graph shows the unemployment rate.
 The unemployment rate decreased in November to 6.7%.
This was well below consensus expectations, however September and October were revised up by 11,000 combined.
I'll have much more later …
Thursday, December 03, 2020
Friday: Employment Report, Trade Deficit
by Calculated Risk on 12/03/2020 09:35:00 PM
My November Employment Preview
Goldman November Payrolls Preview
Friday:
• At 8:30 AM ET.Employment Report for November. The consensus is for 500 thousand jobs added, and for the unemployment rate to decrease to 6.7%.
 Click on graph for larger image.
This graph shows the job losses from the start of the employment recession, in percentage terms through October.
The current employment recession was by far the worst recession since WWII in percentage terms, and the worst in terms of the unemployment rate.
• Also at 8:30 AM: Trade Balance report for October from the Census Bureau. The consensus is the trade deficit to be $64.7 billion. The U.S. trade deficit was at $63.9 billion in September.
December 3 COVID-19 Test Results; Record Cases, Hospitalizations
by Calculated Risk on 12/03/2020 07:34:00 PM
Note: The data was distorted over the holiday weekend.
The US is now averaging over 1 million tests per day. Based on the experience of other countries, for adequate test-and-trace (and isolation) to reduce infections, the percent positive needs to be well under 5% (probably close to 1%), so the US still needs to increase the number of tests per day significantly (or take actions to push down the number of new infections).
There were 1,428,058 test results reported over the last 24 hours.
There were 210,161 positive tests.
Almost 8,000 US deaths have been reported so far in December. See the graph on US Daily Deaths here.
 Click on graph for larger image.
This data is from the COVID Tracking Project.
The percent positive over the last 24 hours was 14.7% (red line is 7 day average). The percent positive is calculated by dividing positive results by the sum of negative and positive results (I don't include pending).
And check out COVID Exit Strategy to see how each state is doing.
 The second graph shows the 7 day average of positive tests reported and daily hospitalizations.
The dashed line is the previous hospitalization maximum.
Note that there were very few tests available in March and April, and many cases were missed, so the hospitalizations was higher relative to the 7-day average of positive tests in July.
• Record Hospitalizations (Over 100,000)
• Record 7 Day Average Cases
Goldman November Payrolls Preview
by Calculated Risk on 12/03/2020 03:33:00 PM
A few brief excerpts from a note by Goldman Sachs economist Spencer Hill:
We estimate nonfarm payrolls rose 450k in November ... The breadth and severity of the virus resurgence suggests a larger labor market impact than during in the second wave ...CR Note: The consensus is for 500 thousand jobs added, and for the unemployment rate to decrease to 6.7%.
We estimate the unemployment rate declined a tenth to 6.8% ... reflecting an increase in household employment and a pause in the labor force participation rebound.
emphasis added
November Employment Preview
by Calculated Risk on 12/03/2020 12:15:00 PM
On Friday at 8:30 AM ET, the BLS will release the employment report for November. The consensus is for 500 thousand jobs added, and for the unemployment rate to decrease to 6.7%.
First, there are a wide range of estimates. For example, from Merrill Lynch economists:
"We look for November jobs report to show nonfarm payroll growth pulled back to 150k following a gain of 638k in October. Private payrolls should add 300k. Lackluster job growth should keep the U-rate unchanged at 6.9%, breaking a 6-mo streak of declines."• Decennial Census: The decennial Census will subtract 93,026 temporary government jobs.
• ADP Report: The ADP employment report showed a gain of 307,000 private sector jobs, below the consensus estimate of 420 thousand jobs. The ADP report hasn't been very useful in predicting the BLS report, but this suggests the BLS report could be weaker than expected.
• ISM Surveys: The ISM manufacturing employment index decreased in November to 48.4%, down from 53.2% in October. This would suggest essentially approximately 30,000 manufacturing jobs lost in November - although ADP showed 8,000 manufacturing jobs added.
The ISM Services employment index increased in November for 51.5% from 50.1% October, and is just above 50. This would suggest around 125,000 service jobs added in November. Combined, the ISM surveys suggest around 75,000 private sector jobs added in November. The ISM surveys haven't been as useful as usual during the pandemic, but this does suggest the report could be weaker than expected.
• Unemployment Claims: The weekly claims report showed a high number of total continuing unemployment claims during the reference week, although this might not be very useful right now. If we did a "Rip Van Winkle", and saw the weekly claims report this morning, we'd think the economy was in a deep recession!
• Homebase, Kronos/UKG: There are other indicators that analysts are looking at - like Homebase hours worked and Kronos (see Ernie Tedeschi comments):
"A slew of recent data is consistent with slow or even negative jobs growth in November. A quick thread."• Seasonal Retail Hiring: Typically retail companies start hiring for the holiday season in October, and really increase hiring in November. Here is a graph that shows the historical net retail jobs added for October, November and December by year.
 Click on graph for larger image.
In 2019, retailers hired 432,000 seasonal employees (NSA) in November. That translated to a loss of 14,000 SA. Brick and Mortar retailers could be more cautious this year, and retail might decline SA in November.
With the larger than expected increase in retail hiring in October (NSA), and the ongoing pandemic, this could negatively impact the November report.
This will be something to watch.
 • Permanent Job Losers: Something to watch in the employment report will be "Permanent job losers". While there has been a strong bounce back in total employment, from the shutdown in March and April, permanent job losers have been increasing (small decrease in October).
This graph shows permanent job losers as a percent of the pre-recession peak in employment through the October report.
This data is only available back to 1994, so there is only data for three recessions. In October, the number of permanent job losers decreased to 3.684 million from 3.756 million in September.
• Conclusion: The employment related data has been all over the place, but most of the indicators suggest a weaker report in November than October. My guess is the report will be lower than the consensus.


