 RSS Feed
 by Calculated Risk on 10/30/2020 01:45:00 PM
Friday, October 30, 2020
Las Vegas Visitor Authority: No Convention Attendance, Visitor Traffic Down 51% YoY in September
From the Las Vegas Visitor Authority: September 2020 Las Vegas Visitor Statistics
Gradual increases continued in September as the destination hosted approx. 1.7M visitors, just under half of last year's estimated tally but up 10.9% from last month.Here is the data from the Las Vegas Convention and Visitors Authority.
While operating at varying capacities, open properties in September represented an inventory of 133,079 rooms.* Total occupancy reached 46.8% for the month as weekend occupancy improved to 66.1% and midweek occupancy reached 38.5%.
Average daily rates among open properties reached $108.13 (+9.0% MoM, -21.1% YoY) while RevPAR came in at roughly $50.60, down -58.2% vs. last September.
* Reflects weighted average of daily room tallies
 Click on graph for larger image.
 The blue and red bars are monthly visitor traffic (left scale) for 2019 and 2020. The dashed blue and orange lines are convention attendance (right scale).
Convention traffic in September was down 100% compared to September 2019.
And visitor traffic was down 51% YoY.
The casinos started to reopen on June 4th (it appears about 89% of rooms have now opened).
Q3 2020 GDP Details on Residential and Commercial Real Estate
by Calculated Risk on 10/30/2020 12:46:00 PM
The BEA has released the underlying details for the Q3 advance GDP report this morning.
The BEA reported that investment in non-residential structures decreased at a 14.6% annual pace in Q3. This is the fourth consecutive quarterly decline (weakness started before the pandemic).
Investment in petroleum and natural gas exploration decreased sharply in Q3 compared to Q2, and was down 60% year-over-year.
 Click on graph for larger image.
The first graph shows investment in offices, malls and lodging as a percent of GDP.
Investment in offices decreased in Q3, but was only down 5.9% year-over-year.
Investment in multimerchandise shopping structures (malls) peaked in 2007 and was down about 24% year-over-year in Q3 - and at a record low as a percent of GDP. The vacancy rate for malls is still very high, so investment will probably stay low for some time.
Lodging investment decreased in Q3, and lodging investment was down 14% year-over-year.
All three sectors - offices, malls, and hotels - are being hurt significantly by the pandemic.
 The second graph is for Residential investment components as a percent of GDP. According to the Bureau of Economic Analysis, RI includes new single family structures, multifamily structures, home improvement, Brokers’ commissions and other ownership transfer costs, and a few minor categories (dormitories, manufactured homes).
Even though investment in single family structures has increased from the bottom, single family investment is still low, and still below the bottom for previous recessions as a percent of GDP. I expect some further increases in single family investment.
Investment in single family structures was $285 billion (SAAR) (about 1.3% of GDP)..
Investment in multi-family structures increased in Q3.
Investment in home improvement was at a $296 billion Seasonally Adjusted Annual Rate (SAAR) in Q3 (about 1.4% of GDP). Home improvement spending has been solid and might hold up during the pandemic.
Note that Brokers' commissions increased sharply as existing home sales picked up in Q3.
Real Personal Income less Transfer Payments
by Calculated Risk on 10/30/2020 09:41:00 AM
Government transfer payments were mostly unchanged in September compared to August, but were still almost $1 trillion (on SAAR basis) above the February level. Most of the increase in transfer payments - compared to the level prior to the crisis - is from unemployment insurance and "other" (CARES ACT).
There was a sharp decline in unemployment insurance in both August and September.
This table shows the amount of unemployment insurance and "Other" transfer payments since February 2020 (pre-crisis level). The increase in "Other" was mostly due to other parts of the CARES Act such as the $1,200 one time payment.
| Selected Transfer Payments Billions of dollars, SAAR | ||
|---|---|---|
| Other | Unemployment Insurance | |
| Feb | $506 | $28 |
| Mar | $515 | $74 |
| Apr | $3,379 | $493 |
| May | $1,360 | $1,356 |
| Jun | $758 | $1,405 |
| Jul | $771 | $1,318 |
| Aug | $716 | $631 |
| Sep | $964 | $365 |
A key measure of the health of the economy (Used by NBER in recession dating) is Real Personal Income less Transfer payments.
 Click on graph for larger image.
This graph shows real personal income less transfer payments since 1990.
This measure of economic activity increased 0.7% in September, compared to August, and was down 2.2% compared to February 2020 (previous peak).
 Another way to look at this data is as a percent of the previous peak.
Real personal income less transfer payments was off 8.3% in April. This was a larger decline than the worst of the great recession.
Currently personal income less transfer payments are still off 2.2% (dashed line).
Black Knight: Number of Homeowners in COVID-19-Related Forbearance Plans Increased Slightly
by Calculated Risk on 10/30/2020 09:16:00 AM
Note: Both Black Knight and the MBA (Mortgage Bankers Association) are putting out weekly estimates of mortgages in forbearance.
This data is as of October 27th.
From Forbearance Numbers Rise Above 3 Million Once Again
In the past week, we saw the number of mortgages in active forbearance rise by 31,000 (a 1% increase). This increase was driven by limited extension and removal activity, along with an increase in forbearance starts. There were 50,000 forbearance removals this week, the lowest of any week during the recovery, while the 89,000 extensions were the fewest we’ve seen in nine weeks. We also saw about 33,000 new forbearance plans begin.
In total, forbearance plan starts are up 15% in October compared to the month prior, with the rise driven by borrowers reactivating previously expired plans. New forbearance activations are down 7% from September, while re-activations are up 50%. This is most likely in reaction to the large volume of plans than were removed early in the month.
As of Oct. 27, the number of active forbearances has ticked back up over 3 million again for the first time since early October, representing approximately 5.7% of all active mortgages, up from 5.6% from last week. Together, they represent $619 billion in unpaid principal.
Click on graph for larger image.
Of the just over 3 million loans still in active forbearance, more than 80% have had their terms extended at some point since March.
With 365,000 forbearance plans still set to expire in October, we could see increased levels of extension and removal activity in the coming weeks, so be sure to continue to monitor this blog for future findings.br /> emphasis added

Personal Income increased 0.9% in September, Spending increased 1.4%
by Calculated Risk on 10/30/2020 08:38:00 AM
The BEA released the Personal Income and Outlays report for September:
Personal income increased $170.3 billion (0.9 percent) in September according to estimates released today by the Bureau of Economic Analysis. Disposable personal income (DPI) increased $150.3 billion (0.9 percent) and personal consumption expenditures (PCE) increased $201.4 billion (1.4 percent).The September PCE price index increased 1.4 percent year-over-year and the September PCE price index, excluding food and energy, increased 1.5 percent year-over-year.
Real DPI increased 0.7 percent in September and Real PCE increased 1.2 percent. The PCE price index increased 0.2 percent (table 9). Excluding food and energy, the PCE price index increased 0.2 percent.
The following graph shows real Personal Consumption Expenditures (PCE) through September 2020 (2012 dollars). Note that the y-axis doesn't start at zero to better show the change.
 Click on graph for larger image.
The dashed red lines are the quarterly levels for real PCE.
Personal income was higher than expected, and the increase in PCE was above expectations.
Note the red line for Q3 (the quarterly level of PCE). This is still 3.3% below the Q4 2019 level for PCE.
Thursday, October 29, 2020
Friday: Personal Income and Outlays
by Calculated Risk on 10/29/2020 09:08:00 PM
Friday:
• At 8:30 AM ET, Personal Income and Outlays for September. The consensus is for a 0.5% increase in personal income, and for a 1.0% increase in personal spending. And for the Core PCE price index to increase 0.2%.
• At 9:45 AM, Chicago Purchasing Managers Index for October. The consensus is for a reading of 59.3, down from 62.4 in September.
• At 10:00 AM, University of Michigan's Consumer sentiment index (Final for October). The consensus is for a reading of 81.2.
October 29 COVID-19 Test Results
by Calculated Risk on 10/29/2020 06:58:00 PM
The US is now averaging close to 1 million tests per day. Based on the experience of other countries, the percent positive needs to be well under 5% to really push down new infections (probably close to 1%), so the US still needs to increase the number of tests per day significantly (or take actions to push down the number of new infections).
There were 1,096,494 test results reported over the last 24 hours.
There were 88,452 positive tests. This is a new record.
Almost 21,500 Americans deaths from COVID have been reported in October. See the graph on US Daily Deaths here.
 Click on graph for larger image.
This data is from the COVID Tracking Project.
The percent positive over the last 24 hours was 8.1% (red line is 7 day average).
For the status of contact tracing by state, check out testandtrace.com.
And check out COVID Exit Strategy to see how each state is doing.
 The second graph shows the 7 day average of positive tests reported.
The dashed line is the July high.
Note that there were very few tests available in March and April, and many cases were missed (the percent positive was very high - see first graph). By June, the percent positive had dropped below 5%.
This is a new record 7-day average for the USA.
Q3 GDP: Investment
by Calculated Risk on 10/29/2020 01:16:00 PM
Investment has been weak for some time, and slumped in Q1, and fell off a cliff in Q2 along with the overall economy. Investment bounced back in Q3, especially for residential investment and investment in equipment - but not for non-residential structures.
The first graph below shows the contribution to GDP from residential investment,
equipment and software, and nonresidential structures (3 quarter trailing
average). This is important to follow because residential investment tends to
lead the economy, equipment and software is generally coincident, and
nonresidential structure investment trails the economy.
In the graph, red is residential, green is equipment and software, and blue is
investment in non-residential structures. So the usual pattern - both into and
out of recessions is - red, green, blue.
Of course - with the sudden economic stop due to COVID-19 - the usual pattern
doesn't apply.
The dashed gray line is the contribution from the change in private
inventories.
 Click on graph for larger image.
Residential investment (RI) increased at a 59.3% annual rate in Q3.
Equipment investment increased at a 70.1% annual rate, and investment in
non-residential structures decreased at a 14.6% annual rate.
The contribution to Q3 GDP from investment in private inventories was 6.6 percentage points.
On a 3 quarter trailing average basis, RI (red) is up solidly, equipment (green) is up, and nonresidential structures (blue) is down sharply.
On a 3 quarter trailing average basis, RI (red) is up solidly, equipment (green) is up, and nonresidential structures (blue) is down sharply.
I'll post more on the components of non-residential investment once the
supplemental data is released.
 The second graph shows residential investment as a percent of GDP.
Residential Investment as a percent of GDP increased in Q3. RI as a percent of GDP is still close to previous lows, and I expected RI to continue to increase further in this cycle.
I'll break down Residential Investment into components after the GDP details are released.
Note: Residential investment (RI) includes new single family structures, multifamily structures, home improvement, broker's commissions, and a few minor categories.
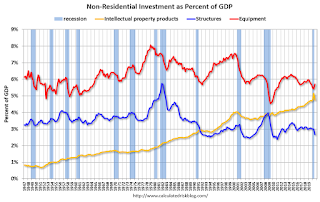 The third graph shows non-residential investment in
structures, equipment and "intellectual property products".
The third graph shows non-residential investment in
structures, equipment and "intellectual property products".
Investment in non-residential structures declined in Q3, and will probably be weak for some time (hotel occupancy is low, office and mall vacancy rates are rising).
Hotels: Occupancy Rate Declined 31.7% Year-over-year
by Calculated Risk on 10/29/2020 10:25:00 AM
From HotelNewsNow.com: STR: US hotel results for week ending 24 October
U.S. weekly hotel occupancy fell back below the 50% mark, according to the latest data from STR through 24 October.Since there is a seasonal pattern to the occupancy rate, we can track the year-over-year change in occupancy to look for any improvement. This table shows the year-over-year change since the week ending Sept 19, 2020:
18-24 October 2020 (percentage change from comparable week in 2019):
• Occupancy: 48.0% (-31.7%)
• Average daily rate (ADR): US$95.49 (-29.4%)
• Revenue per available room (RevPAR): US$45.83 (-51.8%)
emphasis added
| Week Ending | YoY Change, Occupancy Rate |
|---|---|
| 9/19 | -31.9% |
| 9/26 | -31.5% |
| 10/3 | -29.6% |
| 10/10 | -29.2% |
| 10/17 | -30.7% |
| 10/24 | -31.7% |
This suggests no improvement over the last 6 weeks.
The following graph shows the seasonal pattern for the hotel occupancy rate using the four week average.
 Click on graph for larger image.
The red line is for 2020, dash light blue is 2019, blue is the median, and black is for 2009 (the worst year since the Great Depression for hotels - before 2020).
Seasonally we'd expect the occupancy rate to start declining. Note that there was little pickup in business travel that usually happens in the Fall.
Note: Y-axis doesn't start at zero to better show the seasonal change.
NAR: Pending Home Sales Decrease 2.2% in September
by Calculated Risk on 10/29/2020 10:05:00 AM
From the NAR: Pending Home Sales Falter 2.2% in September
The Pending Home Sales Index (PHSI), a forward-looking indicator of home sales based on contract signings, fell 2.2% to 130.0 in September. Year-over-year, contract signings rose 20.5%. An index of 100 is equal to the level of contract activity in 2001.This was below expectations for this index. Note: Contract signings usually lead sales by about 45 to 60 days, so this would usually be for closed sales in October and November.
...
The Northeast PHSI grew 2.0% to 119.4 in September, a 27.7% increase from a year ago. In the Midwest, the index slid 3.2% to 120.5 last month, up 18.5% from September 2019.
Pending home sales in the South decreased 3.0% to an index of 150.1 in September, up 19.6% from September 2019. The index in the West fell 2.6% in September to 116.8, up 19.3% from a year ago.
emphasis added


