 RSS Feed
 by Calculated Risk on 9/10/2020 09:17:00 AM
Thursday, September 10, 2020
Comments on Weekly Unemployment Claims
Earlier: Weekly Initial Unemployment Claims unchanged at 884,000
This was the 25th consecutive week with extraordinarily high initial claims.
More importantly, continued claims are still extremely high (second graph below).
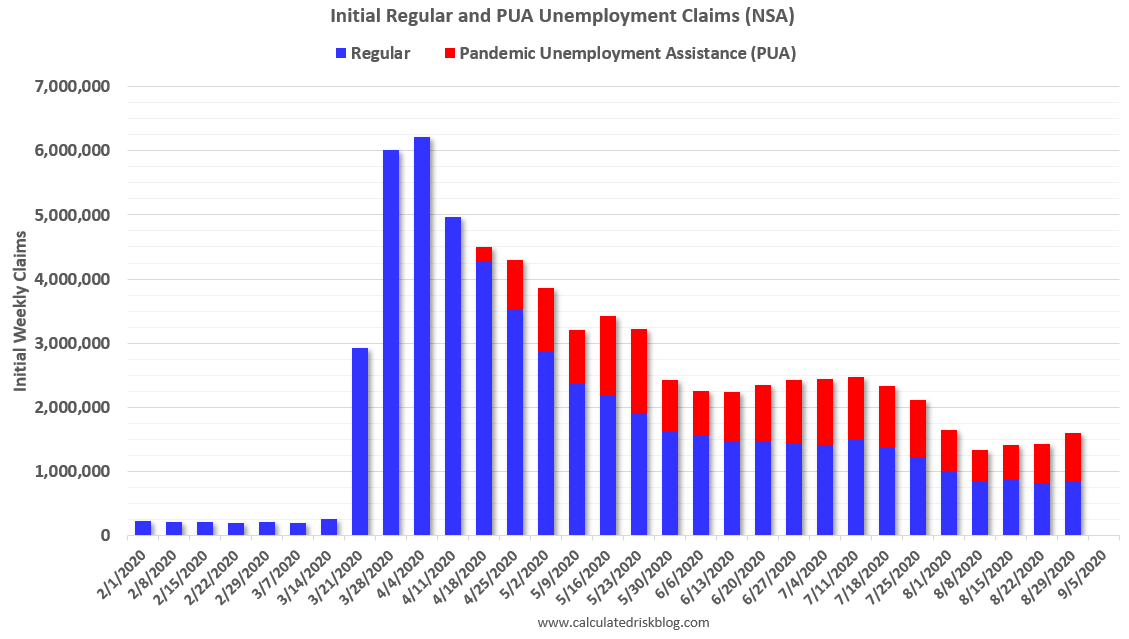
The following graph shows regular initial unemployment claims (blue) and PUA claims (red) since early February (all NSA).
 Click on graph for larger image.
Initial claims, including Pandemic Unemployment Assistance (PUA) are rising, and are close to 1.7 million per week.
The worst week during the great recession was 665,000 (SA). So total initial weekly claims are still more than 1 million higher than the worst week of the great recession!
We are probably seeing some layoffs related to the end of some Payroll Protection Programs (PPP), and possibly due to the fires in the West.
 The second graph shows all person receiving unemployment insurance benefits on all programs. Note that this data is released with a two week lag, and is not seasonally adjusted.
There are typically around 2 million people receiving benefits from the various programs (mostly regular unemployment insurance).
As of the release this morning, there were still almost 30 million people receiving benefits as of August 22nd.
This was a very disappointing weekly report. Initial claims were higher than expected, and there was a further increase in initial claims (regular and PUA), and the total continued claims increased - and remains at a very high level.
Weekly Initial Unemployment Claims unchanged at 884,000
by Calculated Risk on 9/10/2020 08:38:00 AM
The DOL reported:
In the week ending September 5, the advance figure for seasonally adjusted initial claims was 884,000, unchanged from the previous week's revised level. The previous week's level was revised up by 3,000 from 881,000 to 884,000. The 4- week moving average was 970,750, a decrease of 21,750 from the previous week's revised average. The previous week's average was revised up by 750 from 991,750 to 992,500.The previous week was revised up.
emphasis added
This does not include the 838,916 initial claims for Pandemic Unemployment Assistance (PUA) that was up from 747,993 the previous week.
The following graph shows the 4-week moving average of weekly claims since 1971.
 Click on graph for larger image.
The dashed line on the graph is the current 4-week average. The four-week average of weekly unemployment claims decreased to 970,750.
The previous week was revised up.
The second graph shows seasonally adjust continued claims since 1967 (lags initial by one week).
 At the worst of the Great Recession, continued claims peaked at 6.635 million, but then steadily declined.
Continued claims increased to 13,385,000 (SA) from 13,292,000 (SA) last week and will likely stay at a high level until the crisis abates.
Note: There are an additional 14,591,621 receiving Pandemic Unemployment Assistance (PUA) that increased from 13,570,327 the previous week. This is a special program for business owners, self-employed, independent contractors or gig workers not receiving other unemployment insurance.
Wednesday, September 09, 2020
Thursday: Unemployment Claims, PPI
by Calculated Risk on 9/09/2020 09:00:00 PM
Thursday:
• At 8:30 AM ET, The initial weekly unemployment claims report will be released. The consensus is for a 846 thousand initial claims, down from 881 thousand the previous week.
• Also at 8:30 AM, The Producer Price Index for August from the BLS. The consensus is for a 0.2% increase in PPI, and a 0.2% increase in core PPI.
September 9 COVID-19 Test Results
by Calculated Risk on 9/09/2020 07:05:00 PM
The US is now mostly reporting over 700,000 tests per day. Based on the experience of other countries, the percent positive needs to be well under 5% to really push down new infections, so the US still needs to increase the number of tests per day significantly (or take actions to push down the number of new infections).
There were 584,412 test results reported over the last 24 hours.
There were 30,983 positive tests.
See the graph on US Daily Deaths here.
 Click on graph for larger image.
This data is from the COVID Tracking Project.
The percent positive over the last 24 hours was 5.3% (red line).
For the status of contact tracing by state, check out testandtrace.com.
And check out COVID Exit Strategy to see how each state is doing.
 The second graph shows the 7 day average of positive tests reported.
The dashed line is the June low.
Note that there were very few tests available in March and April, and many cases were missed (the percent positive was very high - see first graph).
By June, the percent positive had dropped below 5% (lower than today). If people stay vigilant, the number of cases might drop to the June low by the end of September (that would still be a large number of new cases, but progress).
Las Vegas Real Estate in August: Sales down 9% YoY, Inventory down 36% YoY
by Calculated Risk on 9/09/2020 12:03:00 PM
This report is for closed sales in August; sales are counted at the close of escrow, so the contracts for these homes were mostly signed in June and July.
The Las Vegas Realtors reported Southern Nevada home prices rise again, though fewer homes are selling; LVR housing statistics for August 2020
LVR reported a total of 3,594 existing local homes, condos and townhomes were sold during August. Compared to the same time last year, August sales were down 8.1% for homes and down 10.8% for condos and townhomes.1) Overall sales were down 8.7% year-over-year to 3,594 in August 2020 from 3,935 in August 2019.
...
By the end of August, LVR reported 4,639 single-family homes listed for sale without any sort of offer. That’s down 40.3% from one year ago. For condos and townhomes, the 1,544 properties listed without offers in August represented a 17.0% drop from one year ago.
…
Despite the coronavirus crisis, the number of so-called distressed sales in August remained near historically low levels. The association reported that short sales and foreclosures combined accounted for just 1.2% of all existing local property sales in August. That compares to 2.1% of all sales one year ago, 2.5% two years ago and 6.1% three years ago.
emphasis added
2) Active inventory (single-family and condos) is down from a year ago, from a total of 9,626 in August 2019 to 6,183 in August 2020. Note: Total inventory was down 35.8% year-over-year. And months of inventory is low.
3) Low level of distressed sales.
NMHC: Rent Payment Tracker Shows Decline in Households Paying Rent in September
by Calculated Risk on 9/09/2020 10:18:00 AM
From the NMHC: NMHC Rent Payment Tracker Finds 76.4 Percent of Apartment Households Paid Rent as of September 6
The National Multifamily Housing Council (NMHC)’s Rent Payment Tracker found 76.4 percent of apartment households made a full or partial rent payment by September 6 in its survey of 11.4 million units of professionally managed apartment units across the country.
This is a 4.8-percentage point, or 552,796-household decrease from the share who paid rent through September 6, 2019 and compares to 79.3 percent that had paid by August 6, 2020. These data encompass a wide variety of market-rate rental properties across the United States, which can vary by size, type and average rental price.
“The initial rent payment figures from September have begun to demonstrate the increasing challenges apartment residents are facing. Falling rent payments mean that apartment owners and operators will increasingly have difficulty meeting their mortgages, paying their taxes and utilities and meeting payroll,” said Doug Bibby, NMHC President. “The enactment of a nationwide eviction moratorium last week did nothing to help renters or alleviate the financial distress they are facing. Instead, it only is a stopgap measure that puts the entire housing finance system at jeopardy and saddles apartment residents with untenable levels of debt. Federal policymakers would have been better advised to continue to provide support as they successfully did through the CARES Act."
...
"It is worth noting that the Labor Day weekend, which occurred a week later than in 2019, may have impacted the collections data for the first week of the month, just as our data showed a comparable dip the first week of July because of the Fourth of July holiday,” said Bibby. “Next week’s Rent Payment Tracker numbers will help indicate the degree to which the drop in payments was a result of the holiday weekend or decreased ability of residents to pay their rent.”
emphasis added
 Click on graph for larger image.
This graph from the NMHC Rent Payment Tracker shows the percent of household making full or partial rent payments by the 6th of the month.
CR Note: This is mostly for large, professionally managed properties. It appears fewer people are paying their rent this year compared to last year - down 4.8 percentage points from a year ago - and also down 2.9 percentage points compared to last month at the same point (August 2020). However, this data might be impacted by the timing of Labor Day.
BLS: Job Openings increased to 6.6 Million in July
by Calculated Risk on 9/09/2020 10:06:00 AM
From the BLS: Job Openings and Labor Turnover Summary
The number of job openings increased to 6.6 million on the last business day of July, the U.S. Bureau of Labor Statistics reported today. Hires decreased to 5.8 million in July. Total separations was little changed at 5.0 million. Within separations, the quits rate rose to 2.1 percent while the layoffs and discharges rate decreased to 1.2 percent. These changes in the labor market reflected an ongoing resumption of economic activity that had been curtailed due to the coronavirus (COVID-19) pandemic and efforts to contain it.The following graph shows job openings (yellow line), hires (dark blue), Layoff, Discharges and other (red column), and Quits (light blue column) from the JOLTS.
emphasis added
This series started in December 2000.
Note: The difference between JOLTS hires and separations is similar to the CES (payroll survey) net jobs headline numbers. This report is for July, the most recent employment report was for August.
 Click on graph for larger image.
Note that hires (dark blue) and total separations (red and light blue columns stacked) are usually pretty close each month. This is a measure of labor market turnover. When the blue line is above the two stacked columns, the economy is adding net jobs - when it is below the columns, the economy is losing jobs.
The huge spikes in layoffs and discharges in March and April 2020 are labeled, but off the chart to better show the usual data.
Jobs openings increased in July to 6.618 million from 6.001 million in June.
The number of job openings (yellow) were down 8.5% year-over-year.
Quits were down 18% year-over-year. These are voluntary separations. (see light blue columns at bottom of graph for trend for "quits").
Job openings increased in July, but were still down YoY - and quits are down sharply YoY.
MBA: Mortgage Applications Increase in Latest Weekly Survey
by Calculated Risk on 9/09/2020 07:00:00 AM
From the MBA: Mortgage Applications Increase in Latest MBA Weekly Survey
Mortgage applications increased 2.9 percent from one week earlier, according to data from the Mortgage Bankers Association’s (MBA) Weekly Mortgage Applications Survey for the week ending September 4, 2020. This week’s results are being compared to the week of Labor Day 2019.
... The Refinance Index increased 3 percent from the previous week and was 60 percent higher than the same week one year ago. The seasonally adjusted Purchase Index increased 3 percent from one week earlier. The unadjusted Purchase Index increased 0.2 percent compared with the previous week and was 40 percent higher than the same week one year ago.
“Mortgage rates declined last week, with a noteworthy 5-basis-point decrease in the 15-year fixed rate to a new record low of 2.62 percent. The drop in rates led to a rebound in refinancing activity, driven mainly by borrowers applying for conventional loans,” said Joel Kan, MBA’s Associate Vice President of Economic and Industry Forecasting. “Purchase applications were 40 percent higher than the same week last year, but the increase is skewed higher by being compared to Labor Day 2019. Nevertheless, there continues to be resiliency in the purchase market. Applications were up almost 3 percent on a weekly basis and the average loan size continued to increase, hitting a survey high at $368,600.”
...
The average contract interest rate for 30-year fixed-rate mortgages with conforming loan balances ($510,400 or less) decreased to 3.07 percent from 3.08 percent, with points remaining unchanged at 0.36 (including the origination fee) for 80 percent loan-to-value ratio (LTV) loans.
emphasis added
 Click on graph for larger image.
The first graph shows the refinance index since 1990.
The refinance index has been very volatile recently depending on rates and liquidity.
But with record low rates, the index is up significantly from last year.
 The second graph shows the MBA mortgage purchase index
According to the MBA, purchase activity is up 40% year-over-year unadjusted (this is a comparison to a holiday week last year).
Note: Red is a four-week average (blue is weekly).
Tuesday, September 08, 2020
Wednesday: Job Openings
by Calculated Risk on 9/08/2020 09:00:00 PM
Wednesday:
• At 7:00 AM ET, The Mortgage Bankers Association (MBA) will release the results for the mortgage purchase applications index.
• At 10:00 AM, Job Openings and Labor Turnover Survey for July from the BLS.
September 8 COVID-19 Test Results
by Calculated Risk on 9/08/2020 06:23:00 PM
Note: These are holiday weekend numbers.
The US is now mostly reporting over 700,000 tests per day. Based on the experience of other countries, the percent positive needs to be well under 5% to really push down new infections, so the US still needs to increase the number of tests per day significantly (or take actions to push down the number of new infections).
There were 508,429 test results reported over the last 24 hours.
There were 21,942 positive tests.
See the graph on US Daily Deaths here.
 Click on graph for larger image.
This data is from the COVID Tracking Project.
The percent positive over the last 24 hours was 4.3% (red line).
For the status of contact tracing by state, check out testandtrace.com.
And check out COVID Exit Strategy to see how each state is doing.
 The second graph shows the 7 day average of positive tests reported.
The dashed line is the June low.
Note that there were very few tests available in March and April, and many cases were missed (the percent positive was very high - see first graph).
By June, the percent positive had dropped below 5% (lower than today). If people stay vigilant, the number of cases might drop to the June low by the end of September (that would still be a large number of new cases, but progress).


