 RSS Feed
 by Calculated Risk on 8/20/2020 11:15:00 AM
Thursday, August 20, 2020
Comments on Weekly Unemployment Claims
A few comments:
In normal times, most analysts focus on initial unemployment claims for the BLS reference week of the employment report. For August, the BLS reference week is August 9th through the 15th, and the initial claims report this morning was for the reference week. The increase in initial claims in the report this morning would usually indicate weakness in the labor market.
However, continued claims are probably much more useful now. Continued claims are released with a one week lag, so continued claims for the reference week will be released next week. Continued claims are down 2.1 million from the reference week in July, suggesting an increase in employment in August.
There are an additional 11,224,774 receiving Pandemic Unemployment Assistance (PUA). This is a special program for business owners, self-employed, independent contractors or gig workers not receiving other unemployment insurance.
The following graph shows regular initial unemployment claims (blue) and PUA claims (red) since early February.
 Click on graph for larger image.
This was the 22nd consecutive week with extraordinarily high initial claims.
We are probably seeing some layoffs related to the higher level of COVID cases and also from the end of some Payroll Protection Programs (PPP).
Philly Fed Manufacturing "continued to expand" in August
by Calculated Risk on 8/20/2020 09:14:00 AM
Note: Be careful with diffusion indexes. This shows a rebound off the bottom - some improvement from May to August - but doesn't show the level of activity.
From the Philly Fed: August 2020 Manufacturing Business Outlook Survey
Manufacturing activity in the region continued to expand this month, according to firms responding to the August Manufacturing Business Outlook Survey. The survey’s current indicators for general activity, new orders, and shipments remained positive for the third consecutive month but fell from their readings in July. The employment index also fell from its reading in July but remained in positive territory for the second consecutive month. Most of the future indicators remained elevated, suggesting that the firms expect growth over the next six months.This was below the consensus forecast. Here is a graph comparing the regional Fed surveys and the ISM manufacturing index:
The diffusion index for current activity fell 7 points to 17.2 in August, its third consecutive positive reading after reaching long-term lows in April and May … On balance, the firms reported increases in manufacturing employment for the second consecutive month, but the current employment index fell 11 points to 9.0 this month.
emphasis added
 Click on graph for larger image.
The New York and Philly Fed surveys are averaged together (blue, through August), and five Fed surveys are averaged (yellow, through July) including New York, Philly, Richmond, Dallas and Kansas City. The Institute for Supply Management (ISM) PMI (red) is through July (right axis).
These early reports suggest the ISM manufacturing index will stay positive in August, but will likely not change much from the July level.
Weekly Initial Unemployment Claims increase to 1,106,000
by Calculated Risk on 8/20/2020 08:39:00 AM
The DOL reported:
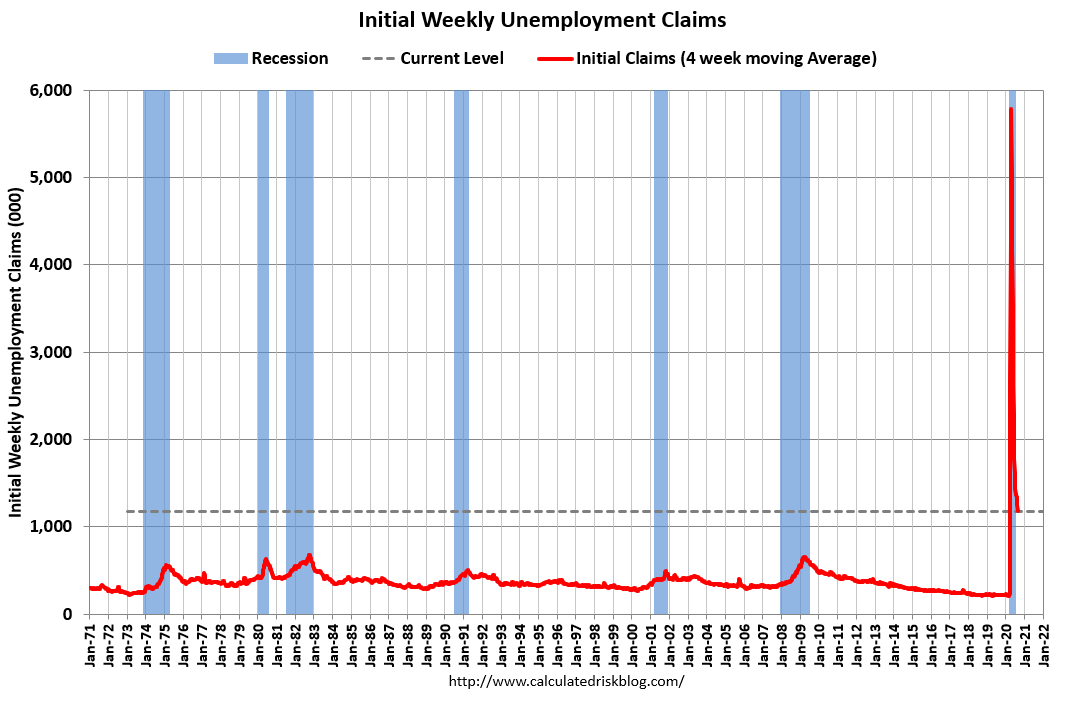
In the week ending August 15, the advance figure for seasonally adjusted initial claims was 1,106,000, an increase of 135,000 from the previous week's revised level. The previous week's level was revised up by 8,000 from 963,000 to 971,000. The 4-week moving average was 1,175,750, a decrease of 79,000 from the previous week's revised average. The previous week's average was revised up by 2,000 from 1,252,750 to 1,254,750.The previous week was revised up.
emphasis added
This does not include the 542,797 initial claims for Pandemic Unemployment Assistance (PUA) that was up from 489,639 the previous week.
The following graph shows the 4-week moving average of weekly claims since 1971.
 Click on graph for larger image.
The dashed line on the graph is the current 4-week average. The four-week average of weekly unemployment claims decreased to 1,252,750.
Initial weekly claims was well above the consensus forecast of 900 thousand initial claims, and the previous week was revised up.
The second graph shows seasonally adjust continued claims since 1967 (lags initial by one week).
 At the worst of the Great Recession, continued claims peaked at 6.635 million, but then steadily declined.
Continued claims decreased to 14,844,000 (SA) from 15,480,000 (SA) last week and will likely stay at a high level until the crisis abates.
Note: There are an additional 11,224,774 receiving Pandemic Unemployment Assistance (PUA) that increased from 10,723,396 the previous week. This is a special program for business owners, self-employed, independent contractors or gig workers not receiving other unemployment insurance.
Wednesday, August 19, 2020
Thursday: Unemployment Claims, Philly Fed Mfg
by Calculated Risk on 8/19/2020 09:28:00 PM
Thursday:
• At 8:30 AM ET, The initial weekly unemployment claims report will be released. The early consensus is for a 900 thousand initial claims, down from 963 thousand the previous week.
• Also at 8:30 AM, the Philly Fed manufacturing survey for August. The consensus is for a reading of 20.5, down from 24.1.
August 19 COVID-19 Test Results
by Calculated Risk on 8/19/2020 06:34:00 PM
The US is now mostly reporting over 700,000 tests per day. Based on the experience of other countries, the percent positive needs to be well under 5% to really push down new infections, so the US still needs to increase the number of tests per day significantly (or take actions to push down the number of new infections).
There were 680,934 test results reported over the last 24 hours.
There were 45,103 positive tests.
There have been 19,600 COVID deaths in the first 19 days of August. See the graph on US Daily Deaths here.
 Click on graph for larger image.
This data is from the COVID Tracking Project.
The percent positive over the last 24 hours was 6.6% (red line).
For the status of contact tracing by state, check out testandtrace.com.
And check out COVID Exit Strategy to see how each state is doing.
FOMC Minutes: "Uncertainty surrounding the economic outlook remained very elevated"
by Calculated Risk on 8/19/2020 02:26:00 PM
From the Fed: Minutes of the Federal Open Market Committee July 28-29, 2020. A few excerpts:
Participants observed that uncertainty surrounding the economic outlook remained very elevated, with the path of the economy highly dependent on the course of the virus and the public sector's response to it. Several risks to the outlook were noted, including the possibility that additional waves of virus outbreaks could result in extended economic disruptions and a protracted period of reduced economic activity. In such scenarios, banks and other lenders could tighten conditions in credit markets appreciably and restrain the availability of credit to households and businesses. Other risks cited included the possibility that fiscal support for households, businesses, and state and local governments might not provide sufficient relief of financial strains in these sectors and that some foreign economies could come under greater pressure than anticipated as a result of the spread of the pandemic abroad. Several participants noted potential longer-run effects of the pandemic associated with possible restructuring in some sectors of the economy that could slow the growth of the economy's productive capacity for some time.
A number of participants commented on various potential risks to financial stability. Banks and other financial institutions could come under significant stress, particularly if one of the more adverse scenarios regarding the spread of the virus and its effects on economic activity was realized. Nonfinancial corporations had carried high levels of indebtedness into the pandemic, increasing their risk of insolvency. There were also concerns that the anticipated increase in Treasury debt over the next few years could have implications for market functioning. There was general agreement that these institutions, activities, and markets should be monitored closely, and a few participants noted that improved data would be helpful for doing so. Several participants observed that the Federal Reserve had recently taken steps to help ensure that banks remain resilient through the pandemic, including by conducting additional sensitivity analysis in conjunction with the most recent bank stress tests and imposing temporary restrictions on shareholder payouts to preserve banks' capital. A couple of participants noted that they believed that restrictions on shareholder payouts should be extended, while another judged that such a step would be premature.
emphasis added
AIA: "July architectural billings remained stalled"
by Calculated Risk on 8/19/2020 12:27:00 PM
Note: This index is a leading indicator primarily for new Commercial Real Estate (CRE) investment.
From the AIA: July architectural billings remained stalled
Architectural billings failed to show any progress during July, and business conditions continued to be soft at firms, according to a new report from the American Institute of Architects (AIA).
The pace of decline during July remained at about the same level as in June with both months posting an ABI score of 40.0 (any score below 50 indicates a decline in firm billings). While firms reported a modest decline for inquiries into new projects—slipping from 49.3 in June to 49.1 in July— newly signed design contracts declined more critically, falling from a June level of 44.0 to 41.7 in July.
“It’s clear the pandemic continued to contribute to uncertainty in business conditions, especially as cases spiked in states across the country,” said AIA Chief Economist Kermit Baker, PhD, Hon. AIA. “While clients expressed interest in exploring new projects, many are hesitant to sign onto new contracts with the exception of the multifamily residential sector, which came close to seeing billings growth in July.”
...
• Regional averages: West (40.9); South (40.7); Midwest (40.1); Northeast (36.8)
• Sector index breakdown: multi-family residential (47.5); mixed practice (44.0); institutional (39.5); commercial/industrial (35.4)
emphasis added
 Click on graph for larger image.
This graph shows the Architecture Billings Index since 1996. The index was at 40.0 in July, unchanged from 40.0 in June.. Anything below 50 indicates contraction in demand for architects' services.
Note: This includes commercial and industrial facilities like hotels and office buildings, multi-family residential, as well as schools, hospitals and other institutions.
This index has been below 50 for five consecutive months. This represents a significant decrease in design services, and suggests a decline in CRE investment in the first half of 2021 (This usually leads CRE investment by 9 to 12 months).
This weakness is not surprising since certain segments of CRE are struggling, especially offices and retail.
Employment: Preliminary annual benchmark revision shows downward adjustment of 173,000 jobs
by Calculated Risk on 8/19/2020 10:36:00 AM
Note: This is mostly before the sharp decline in employment due to COVID.
The BLS released the preliminary annual benchmark revision showing 173,000 fewer payroll jobs as of March 2020. The final revision will be published when the January 2021 employment report is released in February 2021. Usually the preliminary estimate is pretty close to the final benchmark estimate.
The annual revision is benchmarked to state tax records. From the BLS:
In accordance with usual practice, the Bureau of Labor Statistics (BLS) is announcing the preliminary estimate of the upcoming annual benchmark revision to the establishment survey employment series. The final benchmark revision will be issued in February 2021 with the publication of the January 2021 Employment Situation news release.Using the preliminary benchmark estimate, this means that payroll employment in March 2020 was 173,000 lower than originally estimated. In February 2021, the payroll numbers will be revised down to reflect the final estimate. The number is then "wedged back" to the previous revision (March 2019).
Each year, the Current Employment Statistics (CES) survey employment estimates are benchmarked to comprehensive counts of employment for the month of March. These counts are derived from state unemployment insurance (UI) tax records that nearly all employers are required to file. For National CES employment series, the annual benchmark revisions over the last 10 years have averaged plus or minus two-tenths of one percent of total nonfarm employment. The preliminary estimate of the benchmark revision indicates a downward adjustment to March 2020 total nonfarm employment of -173,000 (-0.1 percent).
emphasis added
Construction was revised up by 6,000 jobs, and manufacturing revised down by 70,000 jobs.
This preliminary estimate showed 229,000 fewer private sector jobs, and 56,000 more government jobs (as of March 2020).
Phoenix Real Estate in July: Sales up 12% YoY, Active Inventory Down 42% YoY
by Calculated Risk on 8/19/2020 10:09:00 AM
The Arizona Regional Multiple Listing Service (ARMLS) reports ("Stats Report"):
1) Overall sales were at 10,303 in July, up from 9,508 in June, and up from 9,192 in July 2019. Sales were up 8.4% from June 2020 (last month), and up 12.1% from July 2019.
2) Active inventory was at 8,010, down from 13,737 in July 2019. That is down 42% year-over-year.
3) Months of supply decreased to 1.26 in July, down from 1.51 in June. This is very low.
Sales are reported at the close of escrow, so these sales were mostly signed in May and June. As expected, sales rebounded further in July.
MBA: Mortgage Applications Decrease in Latest Weekly Survey
by Calculated Risk on 8/19/2020 07:00:00 AM
From the MBA: Mortgage Applications Decrease in Latest MBA Weekly Survey
Mortgage applications decreased 3.3 percent from one week earlier, according to data from the Mortgage Bankers Association’s (MBA) Weekly Mortgage Applications Survey for the week ending August 14, 2020.
... The Refinance Index decreased 5 percent from the previous week and was 38 percent higher than the same week one year ago. The seasonally adjusted Purchase Index increased 1 percent from one week earlier. The unadjusted Purchase Index decreased 1 percent compared with the previous week and was 27 percent higher than the same week one year ago.
“Positive economic data reported last week on retail sales, as well as a large U.S. Treasury auction, drove mortgage rates to their highest level in two weeks. The rise in rates dampened refinance activity, but purchase applications continued their strong run and were 27 percent higher than a year ago – the third straight month of year-over-year increases,” said Joel Kan, MBA’s Associate Vice President of Economic and Industry Forecasting. “Conventional purchase applications drove last week’s increase, while applications for government loans decreased. The housing market remains a bright spot in the current economic recovery and these results, combined with July data on housing starts and homebuilder optimism, suggest that housing supply could be increasing to better meet the strong demand for buying a home.”
...
The average contract interest rate for 30-year fixed-rate mortgages with conforming loan balances ($510,400 or less) increased to 3.13 percent from 3.06 percent, with points increasing to 0.36 from 0.33 (including the origination fee) for 80 percent loan-to-value ratio (LTV) loans
emphasis added
 Click on graph for larger image.
The first graph shows the refinance index since 1990.
The refinance index has been very volatile recently depending on rates and liquidity.
But with record low rates, the index is up significantly from last year.
 The second graph shows the MBA mortgage purchase index
According to the MBA, purchase activity is up 27% year-over-year.
Note: Red is a four-week average (blue is weekly).


