 RSS Feed
 by Calculated Risk on 7/28/2020 11:42:00 AM
Tuesday, July 28, 2020
Free Webinar Today: UCI Professor Chris Schwarz Economic and Market Update at 2:30 PM ET
UCI Professor Chris Schwarz and I have presented together before. Always interesting!
He will be offering his thoughts on the economy, Tuesday, July 28th at 11:30 AM PT (2:30 PM ET).
Professor Schwarz writes: "Given the new lockdowns, uncertainty over the stimulus package, Q2 earnings, and financial market conditions, I will host another Economic and Market Update on July 28th at 11:30AM PST. As usual, the event is free."
You can register here.
HVS: Q2 2020 Homeownership and Vacancy Rates
by Calculated Risk on 7/28/2020 10:28:00 AM
The Census Bureau released the Residential Vacancies and Homeownership report for Q2 2020.
It is likely the results of this survey were significantly distorted by the pandemic. See note from Census below.
This report is frequently mentioned by analysts and the media to track household formation, the homeownership rate, and the homeowner and rental vacancy rates. However, there are serious questions about the accuracy of this survey.
This survey might show the trend, but I wouldn't rely on the absolute numbers. he Census Bureau is investigating the differences between the HVS, ACS and decennial Census, and analysts probably shouldn't use the HVS to estimate the excess vacant supply or household formation, or rely on the homeownership rate, except as a guide to the trend.
"National vacancy rates in the second quarter 2020 were 5.7 percent for rental housing and 0.9 percent for homeowner housing. The rental vacancy rate of 5.7 percent was 1.1 percentage points lower than the rate in the second quarter 2019 (6.8 percent) and 0.9 percentage point lower than the rate in the first quarter 2020 (6.6 percent). The homeowner vacancy rate of 0.9 percent was 0.4 percentage points lower than the rate in the second quarter 2019 (1.3 percent) and 0.2 percentage points lower than the rate in the first quarter 2020 (1.1 percent).
The homeownership rate of 67.9 percent was 3.8 percentage points higher than the rate in the second quarter 2019 (64.1 percent) and 2.6 percentage points higher than the rate in the first quarter 2020 (65.3 percent). "
 Click on graph for larger image.
The Red dots are the decennial Census homeownership rates for April 1st 1990, 2000 and 2010. The HVS homeownership rate increased to 67.9% in Q2, from 65.3% in Q1.
I'd put more weight on the decennial Census numbers. It is likely the results in Q2 were distorted by the pandemic.
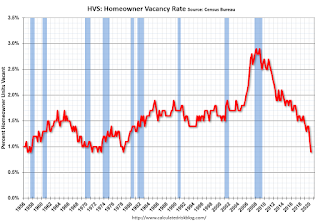 The HVS homeowner vacancy declined to 0.9%.
 Once again - this probably shows the general trend, but I wouldn't rely on the absolute numbers.
From Census:
As a result of the coronavirus pandemic (COVID-19), data collection operations for the CPS/HVS were affected during the second quarter of 2020. In-person interviews were suspended for the duration of the second quarter and replaced with telephone interview attempts when contact information was available. If the Field Representative was unable to get information on the sample unit, the unit was made a Type A non interview (no one home, refusal, etc).
 The rental vacancy rate decreased to 5.7% in Q1.
The quarterly HVS is the most timely survey on households, but there are many questions about the accuracy of this survey.
Richmond Fed: "Manufacturing in the Fifth District showed signs of recovery in July"
by Calculated Risk on 7/28/2020 10:03:00 AM
From the Richmond Fed: Manufacturing in the Fifth District showed signs of recovery in July
Manufacturing in the Fifth District showed signs of recovery in July, according to the most recent survey from the Richmond Fed. The composite index rose from 0 in June to 10 in July, its first positive reading since March, buoyed by increases in all three components. The indexes for shipments and new orders suggested expansion, while the third component index—employment— remained slightly negative. The local business conditions index rose further, suggesting some improvement in sentiment. Survey respondents were optimistic that conditions would improve in the next six months.This was the last of the regional Fed surveys for July.
emphasis added
Here is a graph comparing the regional Fed surveys and the ISM manufacturing index:
 Click on graph for larger image.
The New York and Philly Fed surveys are averaged together (yellow, through July), and five Fed surveys are averaged (blue, through July) including New York, Philly, Richmond, Dallas and Kansas City. The Institute for Supply Management (ISM) PMI (red) is through June (right axis).
The ISM manufacturing index for July will be released on Monday, August 3rd. The early consensus is for the ISM to increase to 53.4, up from 52.6 in June. Based on these regional surveys, the ISM manufacturing index will likely increase in July.
Note that these are diffusion indexes, so returning to 0 (or 50 for ISM) means activity is not declining further (it does not mean that activity is back to pre-crisis levels).
Case-Shiller: National House Price Index increased 4.5% year-over-year in May
by Calculated Risk on 7/28/2020 09:11:00 AM
S&P/Case-Shiller released the monthly Home Price Indices for May ("May" is a 3 month average of March, April and May prices).
This release includes prices for 20 individual cities, two composite indices (for 10 cities and 20 cities) and the monthly National index.
From S&P: S&P CoreLogic Case-Shiller Index Reports 4.5% Annual Home Price Gain in May
The S&P CoreLogic Case-Shiller U.S. National Home Price NSA Index, covering all nine U.S. census divisions, reported a 4.5% annual gain in May, down from 4.6% in the previous month. The 10-City Composite annual increase came in at 3.1%, down from 3.3% in the previous month. The 20-City Composite posted a 3.7% year-over-year gain, down from 3.9% in the previous month.
Phoenix, Seattle and Tampa reported the highest year-over-year gains among the 19 cities (excluding Detroit) in May. Phoenix led the way with a 9.0% year-over-year price increase, followed by Seattle with a 6.8% increase and Tampa with a 6.0% increase. Three of the 19 cities reported higher price increases in the year ending May 2020 versus the year ending April 2020.
...
The National Index posted a 0.7% month-over-month increase, while the 10-City and 20-City Composites posted increases of 0.3% and 0.4% respectively before seasonal adjustment in May. After seasonal adjustment, the National Index posted a month-over-month increase of 0.1%, while the 10- City and 20-City Composites did not post any gains. In May, 17 of 19 cities (excluding Detroit) reported increases before seasonal adjustment, while 11 of the 19 cities reported increases after seasonal adjustment.
“May’s housing price data were stable,” says Craig J. Lazzara, Managing Director and Global Head of Index Investment Strategy at S&P Dow Jones Indices. “The National Composite Index rose by 4.5% in May 2020, with comparable growth in the 10- and 20-City Composites (up 3.1% and 3.7%, respectively). In contrast with the past eight months, May’s gains were less than April’s. Although prices increased in May, in other words, they did so at a decelerating rate. We observed an analogous development at the city level: prices increased in all 19 cities for which we have data, but accelerated in only 3 of them (in contrast with 12 cities last month and 18 the month before that).
“More data will obviously be required in order to know whether May’s report represents a reversal of the previous path of accelerating prices or merely a slight deviation from an otherwise intact trend. Even if prices continue to decelerate, that is quite different from an environment in which prices actually decline.
emphasis added
 Click on graph for larger image.
 The first graph shows the nominal seasonally adjusted Composite 10, Composite 20 and National indices (the Composite 20 was started in January 2000).
The Composite 10 index is up 4.1% from the bubble peak, and unchanged in May (SA) from April.
The Composite 20 index is 8.3% above the bubble peak, and unchanged (SA) in May.
The National index is 18.1% above the bubble peak (SA), and up 0.1% (SA) in May. The National index is up 60% from the post-bubble low set in December 2011 (SA).
 The second graph shows the Year over year change in all three indices.
The Composite 10 SA is up 3.1% compared to May 2019. The Composite 20 SA is up 3.7% year-over-year.
The National index SA is up 4.5% year-over-year.
Note: According to the data, prices increased in 13 of 20 cities month-over-month seasonally adjusted.
I'll have more later.
Monday, July 27, 2020
Tuesday: Case-Shiller House Prices, Richmond Fed Mfg
by Calculated Risk on 7/27/2020 09:18:00 PM
From Matthew Graham at Mortgage News Daily: Mortgage Rates Edge Slightly Higher Again
Mortgage rates have been falling so much and with such regularity in 2020 that there's scarcely been a reason (or even an opportunity) to talk about anything else. Now suddenly, we have 2 straight business days with the average lender's rates getting modestly worse. Is this the beginning of the end?Tuesday:
Maybe... Probably not, but that's not the point. The point I will continue to make about this record-breaking run into the lowest rate range ever is that it will come to an end at some point. [Top Tier Scenarios 30YR FIXED: 2.92%]
emphasis added
• At 9:00 AM ET, S&P/Case-Shiller House Price Index for May. The consensus is for a 4.0% year-over-year increase in the Comp 20 index for May.
• At 10:00 AM, Richmond Fed Survey of Manufacturing Activity for July. This is the last of the regional surveys for July.
• At 10:00 AM, The Q2 2019 Housing Vacancies and Homeownership report from the Census Bureau.
July 27 COVID-19 Test Results
by Calculated Risk on 7/27/2020 06:04:00 PM
The US is now reporting over 700,000 tests per day. Based on the experience of other countries, the percent positive needs to be well under 5% to really push down new infections, so the US still needs to increase the number of tests per day significantly (or take actions to push down the number of new infections).
There were 760,840 test results reported over the last 24 hours.
There were 55,134 positive tests.
The seven day average of daily deaths has moved higher for the 12th consecutive day to over 1,000 per day. See the graph on US Daily Deaths here.
 Click on graph for larger image.
This data is from the COVID Tracking Project.
The percent positive over the last 24 hours was 7.2% (red line).
For the status of contact tracing by state, check out testandtrace.com.
And check out COVID Exit Strategy to see how each state is doing.
Freddie Mac: Mortgage Serious Delinquency Rate increased sharply in June, Highest in 7 Years
by Calculated Risk on 7/27/2020 04:41:00 PM
Freddie Mac reported that the Single-Family serious delinquency rate in June was 2.48%, up from 0.81% in May. Freddie's rate is up from 0.63% in June 2019.
This is the highest serious delinquency rate since October 2013.
Freddie's serious delinquency rate peaked in February 2010 at 4.20%.
These are mortgage loans that are "three monthly payments or more past due or in foreclosure".
 Click on graph for larger image
With COVID-19, this rate will increase significantly again in July (it takes time since these are mortgages three months or more past due).
Mortgages in forbearance are being counted as delinquent in this monthly report, but they will not be reported to the credit bureaus.
This is very different from the increase in delinquencies following the housing bubble. Lending standards have been fairly solid over the last decade, and most of these homeowners have equity in their homes - and they will be able to restructure their loans once they are employed.
Note: Fannie Mae will report for June soon.
MBA Survey: "Share of Mortgage Loans in Forbearance Decreases for Sixth Straight Week to 7.74%" of Portfolio Volume
by Calculated Risk on 7/27/2020 04:00:00 PM
Note: To put these numbers in perspective, the MBA notes "For the week of March 2, only 0.25% of all loans were in forbearance."
From the MBA: Share of Mortgage Loans in Forbearance Decreases for Sixth Straight Week to 7.74%
The Mortgage Bankers Association’s (MBA) latest Forbearance and Call Volume Survey revealed that the total number of loans now in forbearance decreased by 6 basis points from 7.80% of servicers’ portfolio volume in the prior week to 7.74% as of July 19, 2020. According to MBA’s estimate, 3.9 million homeowners are in forbearance plans.
...
“The share of loans in forbearance declined by a smaller amount than in previous weeks, as the pace of borrowers exiting forbearance slowed,” said Mike Fratantoni, MBA’s Senior Vice President and Chief Economist. “Although the GSE portfolio of loans in forbearance should continue to improve, Ginnie Mae’s portfolio saw an uptick of both loans in forbearance and borrowers requesting forbearance. The high level of unemployment claims in recent weeks may be playing a role, as weakness would likely impact Ginnie Mae’s portfolio first.”
Added Fratantoni, “As a result of large buyouts from Ginnie Mae pools in recent weeks, many FHA and VA loans are now being held as portfolio loans by bank servicers. That is why the share of portfolio loans in forbearance has increased and is now typically at a higher level than that for Ginnie Mae loans.”
emphasis added
 Click on graph for larger image.
This graph shows the percent of portfolio in forbearance by investor type over time. Most of the increase was in late March and early April, and has been trending down for the last six weeks.
The MBA notes: "Total weekly forbearance requests as a percent of servicing portfolio volume (#) remained flat relative to the prior week at 0.13%. "
Where to Look for Initial Economic Damage if Disaster Relief is Inadequate
by Calculated Risk on 7/27/2020 12:55:00 PM
The GOP is scheduled to release their proposed Disaster Relief plan this afternoon. Based on early reports, their proposed package will be grossly insufficient. However, there will be further negotiations with the House, and the eventual package might be somewhat adequate.
If the package is inadequate, I’d expect the initial negative impact to be on retail sales and housing. In addition, I’d expect to see significant state and local layoffs over the next few months.
Retail sales for August will not be released until September 16th, but there are several high frequency releases on housing that I’ll be tracking.
1). National Multifamily Housing Council (NMHC) Rent Tracker.

Click on graph for larger image.
The NMHC has been releasing this data at several points during the month.
Note that this is a "survey of 11.1 million units of professionally managed apartment units across the country". Smaller apartment owners are certainly performing worse.
We might see a significant decline in rents paid in August or September, especially if the extra Federal Unemployment benefit is cut substantially.
2) Weekly Forbearance Activity from the MBA and Black Knight.
 The MBA forbearance data is released every Monday, and the Black Knight forbearance data is released every Friday.
This graph is from Black Knight.
There was a surge in forbearance activity in late March and early April, but the number of mortgages in forbearance have declined slightly.
If the Disaster Relief package is inadequate, we might see another increase in forbearance plans.
3) Weekly Census Household Pulse Survey.
The Household Pulse Survey is scheduled to end this week, on July 29th, but hopefully the survey will be extended.
 The most recent release of the Pulse Survey, for the period of between July 9th through July 14th, showed that 26.4% of households reported they missed last month's rent or mortgage payment (or little confidence in making this month's payment). This has increased from a low of 22.1% in the survey of June 4th - June 9th.
This will be a key number to watch.
In addition, I'll be watching the High Frequency Indicators for the Economy that I've been posting every Monday.
Also, I’ll be looking for reports on credit card spending to get a hint about retail sales.
Dallas Fed: "Texas Manufacturing Recovery Continues" in July
by Calculated Risk on 7/27/2020 10:37:00 AM
From the Dallas Fed: Texas Manufacturing Recovery Continues
Texas factory activity continued to expand in July following a record contraction in the spring, according to business executives responding to the Texas Manufacturing Outlook Survey. The production index, a key measure of state manufacturing conditions, inched up from 13.6 to 16.1, suggesting a slight pickup in the pace of output growth.This is the fifth consecutive month with the general business activity index below zero in the Dallas region.
Other measures of manufacturing activity also pointed to slightly accelerating growth this month. The new orders index advanced four points to 6.9. The growth rate of orders index turned positive in July, coming in at 1.3, after spending four months in negative territory. The capacity utilization and shipments indexes pushed up to 14.0 and 17.3, respectively, their highest readings in nearly a year.
Perceptions of broader business conditions were mixed in July. The general business activity index remained slightly negative, edging up from -6.1 to -3.0. The company outlook index registered a second consecutive positive reading, increasing three points to 5.9. The index measuring uncertainty regarding companies’ outlooks shot up from 9.1 to 20.9, with more than a third of manufacturing executives indicating increased uncertainty from June.
Labor market measures indicated modest growth in employment and workweek length. The employment index pushed up from -1.5 to 3.1, marking its first positive reading since January. Eighteen percent of firms noted net hiring, while 15 percent noted net layoffs. The hours worked index also turned positive, rising from -4.3 to 5.8.
emphasis added


