 RSS Feed
 by Calculated Risk on 5/18/2020 08:16:00 AM
Monday, May 18, 2020
Six High Frequency Indicators for the Eventual Recovery
These indicators are for travel and entertainment - some of the sectors that will probably recover very slowly.
The TSA is providing daily travel numbers.
 Click on graph for larger image.
This data shows the daily total traveler throughput from the TSA for 2019 (Blue) and 2020 (Red).
On May 17th there were 253,807 travelers compared to 2,620,276 a year ago.
That is a decline of 90.3%. There has been some increase off the bottom, but it is pretty small compared to the normal level of travel.
The second graph shows the year-over-year change in diners as tabulated by OpenTable for the US and several selected cities.
 Thanks to OpenTable for providing this restaurant data:
This data is updated through May 16, 2020.
The US was off 100% YoY as of March 21st.
California and New York are still off 100%.
Some states - like Texas and Georgia - have started to open up. In Texas, diner traffic was only down 75% YoY.
 This data shows domestic box office for each week (red) and the maximum and minimum for the previous four years. Data is from BoxOfficeMojo.
Note that the data is noisy and depends on when blockbusters are released.
Movie ticket sales have been essentially at zero for eight weeks.
Basically movie theaters are closed all across the country, and will probably reopen slowly (probably with limited seating at first).
The following graph shows the seasonal pattern for the hotel occupancy rate using the four week average.
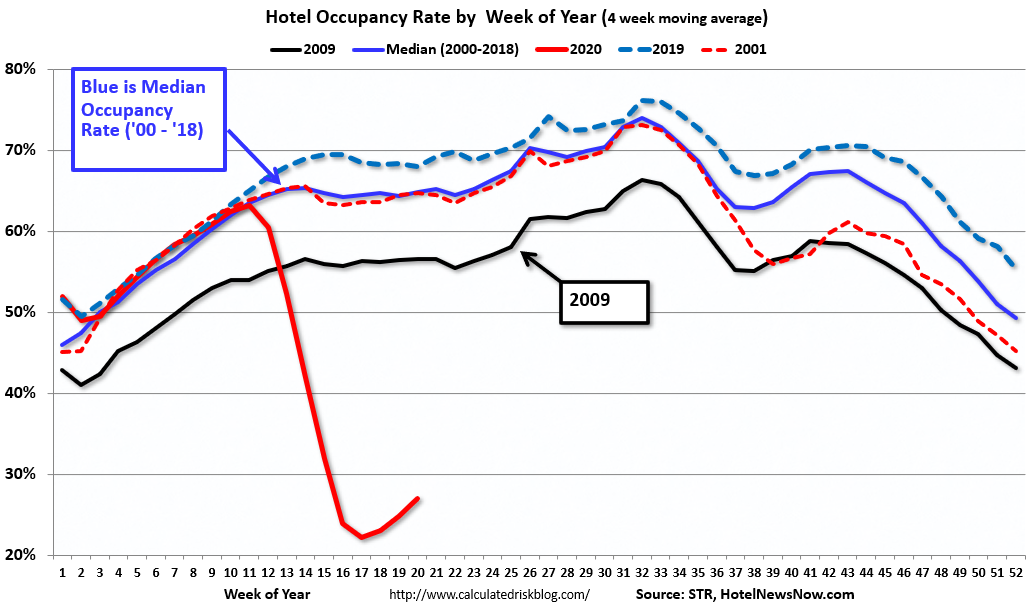 The red line is for 2020, dash light blue is 2019, blue is the median, and black is for 2009 (the worst year probably since the Great Depression for hotels).
2020 was off to a solid start, however, COVID-19 has crushed hotel occupancy.
Notes: Y-axis doesn't start at zero to better show the seasonal change. I added 2001 to show the impact on hotel occupancy after 9/11.
STR reported hotel occupancy was off 55.9% year-over-year last week. Occupancy has increased slightly over the last few of weeks.
 This graph, based on weekly data from the U.S. Energy Information Administration (EIA), shows the year-over-year change in gasoline consumption.
At one point, gasoline consumption was off almost 50% YoY.
As of May 8th, gasoline consumption was off about 20% YoY (about 80% of normal).
The final graph is from Apple mobility.
 This data is through May 16th for the United States.
According to the Apple data, driving is back to normal, walking is a somewhat below normal, but public transit is still off 69% from the pre-crisis level.
Sunday, May 17, 2020
Monday: Builder Confidence
by Calculated Risk on 5/17/2020 07:01:00 PM
Weekend:
• Schedule for Week of May 17, 2020
Monday:
• At 10:00 AM ET, The May NAHB homebuilder survey. The consensus is for an increase to 33 from 30 last month. Any number below 50 indicates that more builders view sales conditions as poor than good.
From CNBC: Pre-Market Data and Bloomberg futures S&P 500 are up 8 and DOW futures are up 88 (fair value).
Oil prices were up over the last week with WTI futures at $30.03 per barrel and Brent at $33.29 barrel. A year ago, WTI was at $63, and Brent was at $74 - so WTI oil prices are down over 50% year-over-year.
Here is a graph from Gasbuddy.com for nationwide gasoline prices. Nationally prices are at $1.88 per gallon. A year ago prices were at $2.86 per gallon, so gasoline prices are down $0.98 per gallon year-over-year.
May 17 Update: US COVID-19 Test Results: Test-and-Trace Success for Smallpox
by Calculated Risk on 5/17/2020 05:50:00 PM
From Dr. Bill Foege (former Director of CDC) in the Atlanta Journal-Constitution: Opinion: Lessons of Smallpox eradication and COVID-19
Contact tracing and isolation were hallmarks of the smallpox program with labor-intensive work before computers and smart phones were available for workers. In a single state in India, in May 1974, they reported 1,500 new cases a day. That required 1,500 new investigations each day, with the isolation of cases, the locating of contacts, vaccination of contacts and isolation of those with symptoms until a diagnosis could be made. It required tens of thousands of people simply to act as watch guards of the homes of cases and to vaccinate all visitors. All of this with difficult communications and yet currently we hear that contact tracing is not possible until the numbers of cases are reduced. Of course, the diseases are different. A vaccine and the lack of subclinical cases favored smallpox work. However, the approaches to control are similar. A current problem is that testing remains inadequate months after the problem was defined.In late April, Dr. Fauci said the US might be able to test 400,000 to 600,000 people per day, and this is the first day in that range. This might be close to enough to allow test-and-trace.
However, the US might need more than 900,000 tests per day according to Dr. Jha of Harvard's Global Health Institute.
There were 422,024 test results reported over the last 24 hours.
 Click on graph for larger image.
This data is from the COVID Tracking Project.
The percent positive over the last 24 hours was 5.0% (red line). The US probably needs enough tests to keep the percentage positive well below 5%. (probably much lower based on testing in New Zealand).
NOTE: A few states are apparently including antibody tests with virus tests. The Covid tracking project is working to straighten that out.
Saturday, May 16, 2020
May 16 Update: US COVID-19 Test Results
by Calculated Risk on 5/16/2020 05:25:00 PM
The US might be able to test 400,000 to 600,000 people per day sometime in May according to Dr. Fauci - and that might be enough for test and trace.
However, the US might need more than 900,000 tests per day according to Dr. Jha of Harvard's Global Health Institute.
There were 356,994 test results reported over the last 24 hours.
 Click on graph for larger image.
This data is from the COVID Tracking Project.
The percent positive over the last 24 hours was 7.0% (red line). The US probably needs enough tests to keep the percentage positive well below 5%. (probably much lower based on testing in New Zealand).
NOTE: A few states are apparently including antibody tests with virus tests. The Covid tracking project is working to straighten that out.
Schedule for Week of May 17, 2020
by Calculated Risk on 5/16/2020 08:11:00 AM
The key reports this week are April Housing Starts and Existing Home Sales.
For manufacturing, the May Philly Fed manufacturing survey will be released.
Fed Chair Jerome Powell testifies before the Senate Banking Committee on Tuesday.
10:00 AM: The May NAHB homebuilder survey. The consensus is for an increase to 33 from 30 last month . Any number below 50 indicates that more builders view sales conditions as poor than good.
 8:30 AM ET: Housing Starts for April.
 This graph shows single and total housing starts since 1968.
The consensus is for 0.950 million SAAR, down from 1.216 million SAAR in March.
10:00 AM, Testimony, Fed Chair Jerome Powell, Coronavirus Aid, Relief, and Economic Security Act, Before the Senate Banking, Housing, and Urban Affairs Committee, U.S. Senate
7:00 AM ET: The Mortgage Bankers Association (MBA) will release the results for the mortgage purchase applications index.
During the day: The AIA's Architecture Billings Index for April (a leading indicator for commercial real estate).
2:00 PM: FOMC Minutes, Meeting of April 28-29, 2020
8:30 AM ET: The initial weekly unemployment claims report will be released. The consensus is for a 2.500 million initial claims, down from 2.981 million the previous week.
8:30 AM: the Philly Fed manufacturing survey for May. The consensus is for a reading of -45.0, up from -56.6.
 10:00 AM: Existing Home Sales for April from the National Association of Realtors (NAR). The consensus is for 4.30 million SAAR, down from 5.27 million.
The graph shows existing home sales from 1994 through the report last month.
Housing economist Tom Lawler expects the NAR to report sales of 4.17 million SAAR for April.
2:30 PM, Speech, Fed Chair Jerome Powell, Opening Remarks, At Fed Listens: How is COVID-19 Affecting Your Community?
10:00 AM: State Employment and Unemployment (Monthly) for April 2020
Friday, May 15, 2020
May 15 Update: US COVID-19 Test Results
by Calculated Risk on 5/15/2020 05:50:00 PM
The COVID Tracking Project put out an important statement today: Position Statement on Antibody Data Reporting
Earlier this week, we learned that for several weeks, the Commonwealth of Virginia has been combining viral test data with antibody test data in their public reporting on COVID-19. Virginia officials suggested that other states were pooling these two types of results so that, in essence, Virginia was forced to combine them to keep up.This means the number of tests being reported is too high, and the percent positive is probably higher than being reported. Hopefully the states will separate the tests in all reporting.
On May 13, 2020, we contacted 44 states and territories without clear statements about their antibody test reporting policy. As of May 15, we have confirmed that at least two states besides Virginia have been combining antibody and viral test results, though only Virginia's health department is on the record about combining their testing datasets. If more states are, in fact, combining viral and antibody results, we understand that they are making a choice that appears to increase their test totals. But we think it comes at much too high a price.
As antibody tests become more widely available across the United States, every state and territory will have to choose how to report this data to the public. We encourage all states and territories to standardize on reporting antibody and viral test results separately and fully, allowing government departments, journalists, and members of the public to maintain access to the most meaningful numbers throughout the COVID-19 outbreak in the United States.
emphasis added
The US might be able to test 400,000 to 600,000 people per day sometime in May according to Dr. Fauci - and that might be enough for test and trace.
However, the US might need more than 900,000 tests per day according to Dr. Jha of Harvard's Global Health Institute.
There were 378,410 test results reported over the last 24 hours.
 Click on graph for larger image.
This data is from the COVID Tracking Project.
The percent positive over the last 24 hours was 6.9% (red line). The US probably needs enough tests to keep the percentage positive well below 5%. (probably much lower based on testing in New Zealand).
Lawler: Early Read on Existing Home Sales in April
by Calculated Risk on 5/15/2020 04:50:00 PM
From housing economist Tom Lawler:
Based on publicly-available local realtor/MLS reports released across the country through today, I project that existing home sales as estimated by the National Association of Realtors ran at a seasonally adjusted annual rate of 4.17 million in April, down 20.6% from March’s preliminary pace and down 20.1% from last April’s seasonally adjusted pace.
I should note that this “earlier than normal” estimate is based on a smaller sample than my normal “early read.” In addition, there are huge differences in sales figures not just across states but within states, with much of the differences reflecting how states were affected by and how state governments responded to the pandemic. As such, this estimate is subject to greater than normal “sampling error.”
On the inventory front, local realtor/MLS data, as well as data from other inventory trackers, suggest that the inventory of existing homes for sale at the end of April will be 7down about 15.0% from a year earlier. Finally, local realtor/MLS data suggest that the median US existing single-family home sales price last month was up by about 8.3% from last April.
Here are a few other observations: first, while not all realtor reports break out sales by type of property (e.g., single-family detached vs. condo/townhomes), almost all that do reported a significantly larger YOY decline in condo/townhome sales than in single-family detached sales.
Second, while not all realtor reports include data on new pending sales – and some that do often revise those data significantly – it is worth nothing that almost all realtor reports with new pending sales data showed a significantly larger YOY drop in pending sales than in closed sales. E.g., of the realtor reports than included new pending sales, the combined closed sales in those reports were down 20% YOY while combined pending sales were down 34% YOY.
CR Note: The National Association of Realtors (NAR) is scheduled to release April existing home sales on Thursday, May 21, 2020 at 10:00 AM ET. The consensus is for 4.30 million SAAR.
NMHC: Rent Payment Tracker Finds 87.7 Percent Paid Rent as of May 13th
by Calculated Risk on 5/15/2020 01:57:00 PM
From the NMHC: NMHC Rent Payment Tracker Finds 87.7 Percent of Apartment Households Paid Rent as of May 13
The National Multifamily Housing Council (NMHC)’s Rent Payment Tracker found 87.7 percent of apartment households made a full or partial rent payment by May 13 in its survey of 11.4 million units of professionally managed apartment units across the country.CR Note: It appears most people are still paying their rent. This was a higher percentage than in April (at the same point in the month), and only down 2.1 percentage points from a year ago. (Commercial is a different story).
This is a 2.1-percentage point decrease in the share who paid rent through May 13, 2019 and compares to 85.0 percent that had paid by April 13, 2020. These data encompass a wide variety of market-rate rental properties across the United States, which can vary by size, type and average rental price.
“Once again, despite the economic and health challenges facing so many, we have found that apartment residents who live in professionally managed properties are meeting their obligations,” said Doug Bibby, NMHC President. “But it’s important to understand that our metric does not capture rent payments for smaller landlords or for affordable and subsidized properties. These excluded properties are the ones more likely to house residents experiencing financial stress. In addition, as current federal support programs begin to reach their limit, it will be even more critical for Congress to enact a meaningful renter assistance program. It’s the only way to avoid adding a housing crisis to our health and economic crisis.”
emphasis added
Q2 GDP Forecasts: Probably Around 30% Annual Rate Decline
by Calculated Risk on 5/15/2020 12:42:00 PM
Important: GDP is reported at a seasonally adjusted annual rate (SAAR). So a 30% Q2 decline is around 7% decline from Q1 (SA).
From Merrill Lynch:
We are tracking -5.2% qoq saar for 1Q GDP and expect a -30% qoq saar plunge in 2Q. [SAAR May 15 estimate]From the NY Fed Nowcasting Report
emphasis added
The New York Fed Staff Nowcast stands at -31.1% for 2020:Q2. [May 15 estimate]And from the Altanta Fed: GDPNow
The GDPNow model estimate for real GDP growth (seasonally adjusted annual rate) in the second quarter of 2020 is -42.8 percent on May 15, down from -34.9 percent on May 8. [May 15 estimate]
NY Fed: Manufacturing "Business activity continued to deteriorate significantly in New York State"
by Calculated Risk on 5/15/2020 12:35:00 PM
Earlier from the NY Fed: Empire State Manufacturing Survey
Business activity continued to deteriorate significantly in New York State, according to firms responding to the May 2020 Empire State Manufacturing Survey. The headline general business conditions index climbed thirty points, but remained well below zero at -48.5.This was another weak report and suggests activity continued to "deteriorate significantly" in May.
...
After plunging last month, the index for number of employees increased nearly 50 points to -6.1, suggesting that after declining sharply last month, employment levels fell somewhat further in May. The average workweek index also increased, but at -21.6, the index pointed to ongoing declines in hours worked.
emphasis added


